. 2021 May 19;109(10):1657-1674.e7.
doi: 10.1016/j.neuron.2021.03.024. Epub 2021 Apr 7.

Selective removal of astrocytic APOE4 strongly protects against tau-mediated neurodegeneration and decreases synaptic phagocytosis by microglia

Affiliations

Selective removal of astrocytic APOE4 strongly protects against tau-mediated neurodegeneration and decreases synaptic phagocytosis by microglia

Chao Wang et al. Neuron. .

Abstract

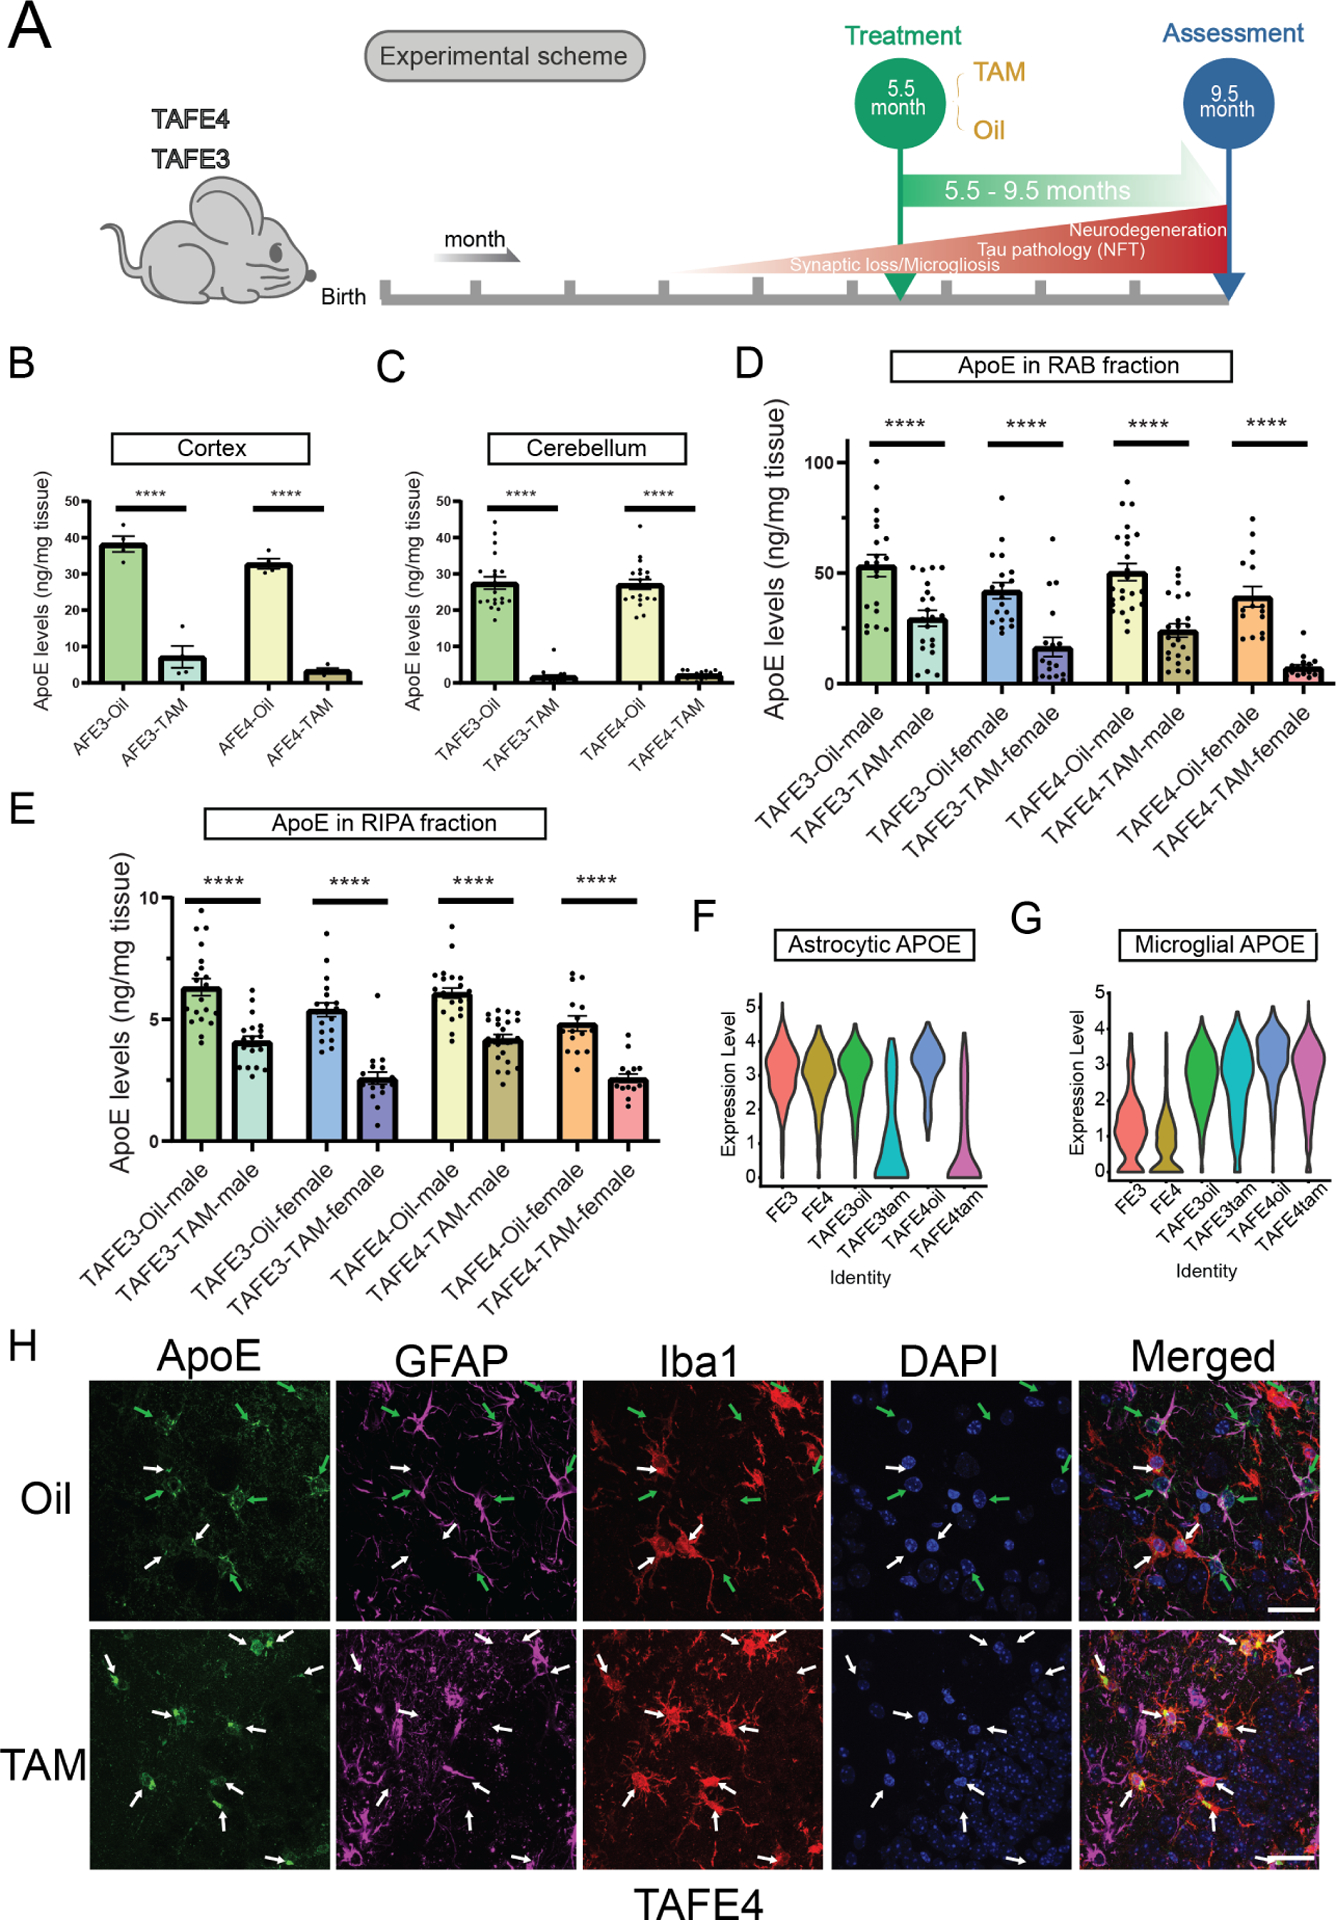
The apolipoprotein E (APOE) gene is the strongest genetic risk factor for Alzheimer's disease and directly influences tauopathy and tau-mediated neurodegeneration. ApoE4 has strong deleterious effects on both parameters. In the brain, apoE is produced and secreted primarily by astrocytes and by activated microglia. The cell-specific role of each form of apoE in the setting of neurodegeneration has not been determined. We generated P301S Tau/Aldh1l1-CreERT2/apoE3flox/flox or Tau/Aldh1l1-CreERT2/apoE4flox/flox mice. At 5.5 months of age, after the onset of tau pathology, we administered tamoxifen or vehicle and compared mice at 9.5 months of age. Removing astrocytic APOE4 markedly reduced tau-mediated neurodegeneration and decreased phosphorylated tau (pTau) pathology. Single-nucleus RNA sequencing analysis revealed striking gene expression changes in all cell types, with astrocytic APOE4 removal decreasing disease-associated gene signatures in neurons, oligodendrocytes, astrocytes, and microglia. Removal of astrocytic APOE4 decreased tau-induced synaptic loss and microglial phagocytosis of synaptic elements, suggesting a key role for astrocytic apoE in synaptic degeneration.

Keywords: APOE; astrocyte; microglia; neurodegeneration; tau.


Conflict of interest statement

Declaration of interests D.M.H. is as an inventor on a patent licensed by Washington University to C2N Diagnostics on the therapeutic use of anti-tau antibodies. D.M.H. co-founded and is on the scientific advisory board of C2N Diagnostics. C2N Diagnostics has licensed certain anti-tau antibodies to AbbVie for therapeutic development. D.M.H. is on the scientific advisory board of Denali and consults for Genentech, Merck, and Cajal Neuroscience. All other authors declare no competing interests.

Figures

Figure 1.
Figure 1.. Tamoxifen treatment reduces astrocytic APOE mRNA and protein levels in both TAFE4 and TAFE3 mice
(A) Timeline of tamoxifen treatment in TAFE mice. Neurofibrillary tangle: NFT. (B) RAB-soluble apoE levels in cortical tissue in male AFE mice (n=4). (C) RAB-soluble apoE levels in the cerebellum in male TAFE mice (n=20). (D and E) RAB-soluble (D) and RIPA-soluble (E) apoE levels in cortical tissue assessed in TAFE mice (n=15–24). (F) Violin plots of astrocytic APOE expression (Y-axis, log normalized values). (G) Violin plots of microglial APOE expression (Y-axis, log normalized values). (H) Brain sections from TAFE4 mice treated with oil (top row) or TAM (bottom row) co-stained with ApoE (green), GFAP (magenta), Iba1 (red), and DAPI (blue). Green arrows – apoE expression by astrocyte cells; White arrows – apoE expression by microglia. Scale bar = 25 μm. In (B–E), ****p<0.0001; Two-way ANOVA and Sidak’s post hoc test in (B) and (C); Three-way ANOVA and Sidak’s post hoc test in (D) and (E). Data expressed as mean ± SEM. See also Figure S1 and Table S1.
Figure 2.
Figure 2.. Decreasing astrocytic APOE4 but not APOE3 expression starting at 5.5-months-of-age rescues mouse nest-building behavior and reduces brain atrophy at 9.5 months of age
(A) Representative Sudan Black staining images of 9.5-month-old TAFE mice. (B–F) Quantification of hippocampal volumes (B), EC/PC volumes (C), ventricular volumes (D), brain weight (E), and nest-building behavior (F). All mice in B–G are 9.5 months of age except the first 2 groups in B–D and F which are at 5.5 months of age. (G) Protein levels of neurofilament light chain (NFL). B–G: TAFE: n=11–24; **p<0.01; *p<0.05; Three-way ANOVA and Sidak’s post hoc test (B–E); Chi-square (F); Three-way ANOVA with Sidak’s post hoc test and unpaired Student’s t-test (G); Data plotted as mean ± SEM. See also Figure S2 and Table S1.
Figure 3.
Figure 3.. Knocking down astrocytic APOE4 expression at 5.5-months-of-age reduces phosphorylated tau deposition
(A–C) Total cortical tau concentrations in RAB (A), RIPA (B), and FA (C) fractions assessed by ELISA. (D–F) pTau concentrations in RAB fraction (D), RIPA fraction (E), and FA fractions (F) measured by ELISA. (G and H) Representative AT8 hippocampal staining of 9.5-month-old TAFE mice (G) and quantification (H). Scale bar = 500 μm. n=15–24; *p<0.05; Three-way ANOVA and Sidak’s post hoc test; Data expressed as mean ± SEM. See also Figure S3 and Table S1.
Figure 4.
Figure 4.. snRNAseq reveals cell-type specific changes regulated by astrocytic APOE removal in tauopathy
(A) snRNAseq of hippocampal tissues from 9.5-month-old male mice (n=5 pooled per group). UMAP plot showing 16 distinguishable clusters (1–16) with corresponding cell-types identified using known cell markers. (B) UMAP plot split by experimental groups. (C) Relative frequency of cell clusters in each experimental group. Cluster 1 (black) starts at bottom of graph with increasing numbers going bottom to top. See also Figure S4, Table S2, and S3.
Figure 5.
Figure 5.. Identification of distinct neuronal subpopulations associated with tau pathology and astrocytic APOE removal
(A) Hallmark and KEGG pathways in Cluster 6. (B–E) Marker genes Rorb (B), Arpp21 (C), Cux2 (D), and R3hdm1 (E) from Cluster 6 verified by qPCR in female mice. FE: n=5; TAFE: n=8 per group; ***p<0.001; **p<0.01; Two-way ANOVA and Sidak’s post hoc test; Data expressed as mean ± SEM. (F) Brain sections from TAFE4-Oil (top row), TAFE4-TAM (second row), TAFE3-Oil (third row), TAFE3-TAM (fourth row), and AD human patient (bottom row) co-stained with Arpp21 (red), and AT8 (Green). Scare bar = 25 μm. See also Figure S5, Table S1, and S3.
Figure 6.
Figure 6.. Tau-dependent changes in astrocyte transcriptional profile are attenuated by deletion of astrocytic APOE
(A) UMAP plot of re-clustered astrocyte population showing 3 distinguishable clusters (Astro1–3). (B) Relative frequency of all astrocyte clusters per genotype and treatment. (C) Volcano plots showing differentially expressed genes (DEGs) in Astro1 vs. Astro2. (D–F) Marker genes GFAP (D), Clu (E), and Vim (F) from Astro2 verified by qPCR in female mice. FE: n=5; TAFE: n=8 per group. (G and H) Representative GFAP-stained hippocampal images of 9.5-month-old TAFE mice that received different treatments (G) with quantification (H). Scale bar = 500 μm; n=15–24. (I and J) Brain sections from female TAFE4-Oil (upper panel), and TAFE4-TAM (bottom panel) co-stained with AQP4 (green) and GFAP (red) (I) with quantification of coverage in hippocampus (J). Scale bar = 200 μm; n=15–16. **p<0.01; *p<0.05; Two-way ANOVA and Sidak’s post hoc test (D–F); Three-way ANOVA and uncorrected Fisher’s LSD (H); Student t-test (J); Data expressed as mean ± SEM. See also Figure S5, Table S1, and S4.
Figure 7.
Figure 7.. Tau and astrocyte-APOE dependent changes in microglial activation
(A) UMAP plot of re-clustered microglial population showing 3 distinguished clusters (Micro1 – 3). (B) Relative frequency of all microglial clusters in each experimental group. (C) Volcano plots showing DEGs in Micro1 vs. Micro2. (D) Hallmark and KEGG pathways enriched in Micro1. (E) P2ry12 immunofluorescent staining in representative TAFE4-Oil vs. TAFE4-TAM treated mice. Scale bar = 50 μm. (F) Quantification of % area of hippocampus covered by P2ry12 staining in FE3, FE4, TAFE3 and TAFE4 mice. FE: n = 4; TAFE: n = 15–19. (G–I) Verification of marker genes H2-Aa (G), H2-Eb1 (H), and SPP1 (I) from Micro1 (activated cluster) with qPCR in female mice. FE: n=5; TAFE: n=8 per group. (J) Clec7a immunofluorescent staining in representative TAFE4-Oil vs. TAFE4-TAM treated mice. Scale bar = 50 μm. (K) Quantification of % area of hippocampus covered by Clec7a staining in FE3, FE4, TAFE3 and TAFE4 mice. FE: n = 4; TAFE: n = 15–19. ***p<0.001, **p<0.01, *p<0.05; Two-way ANOVA and Sidak’s post hoc test (F–I, K); Data expressed as mean ± SEM. See also Figure S8, Table S1 and S6.
Figure 8.
Figure 8.. Reduction of synaptic loss by microglial engulfment after removal of astrocytic APOE4
(A) Representative PSD-95 puncta staining in 9.5-month-old TAFE female mice in EC/PC. (B) Quantification of PSD-95 puncta using Imaris. FE4: n=2; TAFE4: n=14–17. (C) Western blot detection of PSD-95 and α-tubulin protein levels from female hippocampal tissue. (D) Quantitative analysis of PSD-95 expression after normalized to α-tubulin (n=7 per group). (E and F) Representative CD68 staining images of 9.5-month-old TAFE mice that received different treatments (E) with percent area covered in hippocampus (F). n=15–24; Scale bar = 500 μm. (G) Representative confocal images (upper panel) and relative 3D surface rendering (bottom panel) showing volume reconstruction of Iba1 (white), CD68 (green), and engulfed PSD-95 puncta (red), detected within microglial CD68 positive vesicles in female hippocampus. Scale bar = 5 μm. (H) CD68 volume normalized to Iba1 volume in hippocampal area. (I) Quantification of engulfed PSD-95 puncta within CD68 positive vesicles per microglial. ****p<0.0001; **p<0.01; *p<0.05; Student t-test (B, D, H, and I); Three-way ANOVA and Sidak’s post hoc test (F); Data expressed as mean ± SEM. See also Table S1.

Comment in

References

    1. Apicco DJ, Ash PEA, Maziuk B, LeBlang C, Medalla M, Al Abdullatif A, Ferragud A, Botelho E, Ballance HI, Dhawan U, et al. (2018). Reducing the RNA binding protein TIA1 protects against tau-mediated neurodegeneration in vivo. Nat. Neurosci 21, 72–80. - PMC - PubMed
    1. Arendt T, Schindler C, Bruckner MK, Eschrich K, Bigl V, Zedlick D, and Marcova L (1997). Plastic neuronal remodeling is impaired in patients with Alzheimer’s disease carrying apolipoprotein epsilon 4 allele. J. Neurosci 17, 516–529. - PMC - PubMed
    1. Atagi Y, Liu C-C, Painter MM, Chen X-F, Verbeeck C, Zheng H, Li X, Rademakers R, Kang SS, Xu H, et al. (2015). Apolipoprotein E Is a Ligand for Triggering Receptor Expressed on Myeloid Cells 2 (TREM2). J.Bio.Chem 290, 26043–26050. - PMC - PubMed
    1. Bai B, Hales CM, Chen P-C, Gozal Y, Dammer EB, Fritz JJ, Wang X, Xia Q, Duong DM, Street C, et al. (2013). U1 small nuclear ribonucleoprotein complex and RNA splicing alterations in Alzheimer’s disease. Proc. Natl. Acad. Sci. USA 110, 16562–16567. - PMC - PubMed
    1. Bejanin A, Schonhaut DR, La Joie R, Kramer JH, Baker SL, Sosa N, Ayakta N, Cantwell A, Janabi M, Lauriola M, et al. (2017). Tau pathology and neurodegeneration contribute to cognitive impairment in Alzheimer’s disease. Brain 140, 3286–3300. - PMC - PubMed

Publication types