. 2021 Jun 3;28(6):1040-1056.e6.
doi: 10.1016/j.stem.2021.02.025. Epub 2021 Apr 7.

Human naive epiblast cells possess unrestricted lineage potential

Affiliations

Human naive epiblast cells possess unrestricted lineage potential

Ge Guo et al. Cell Stem Cell. .

Abstract

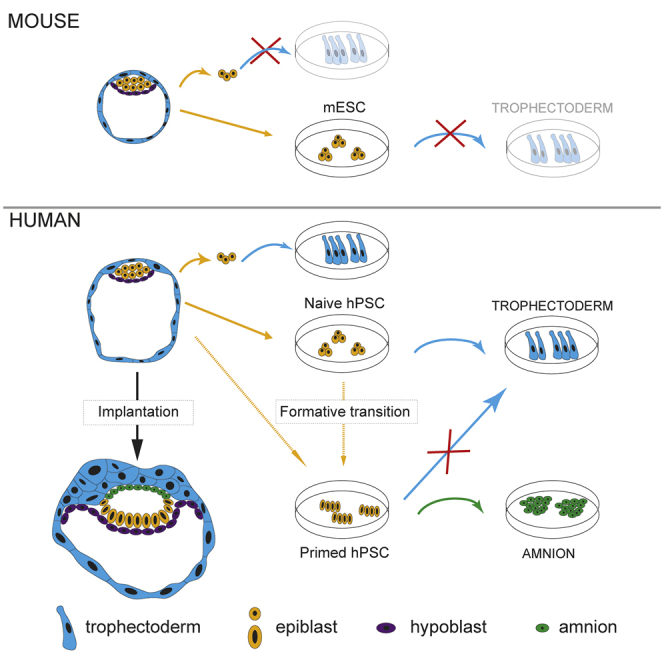
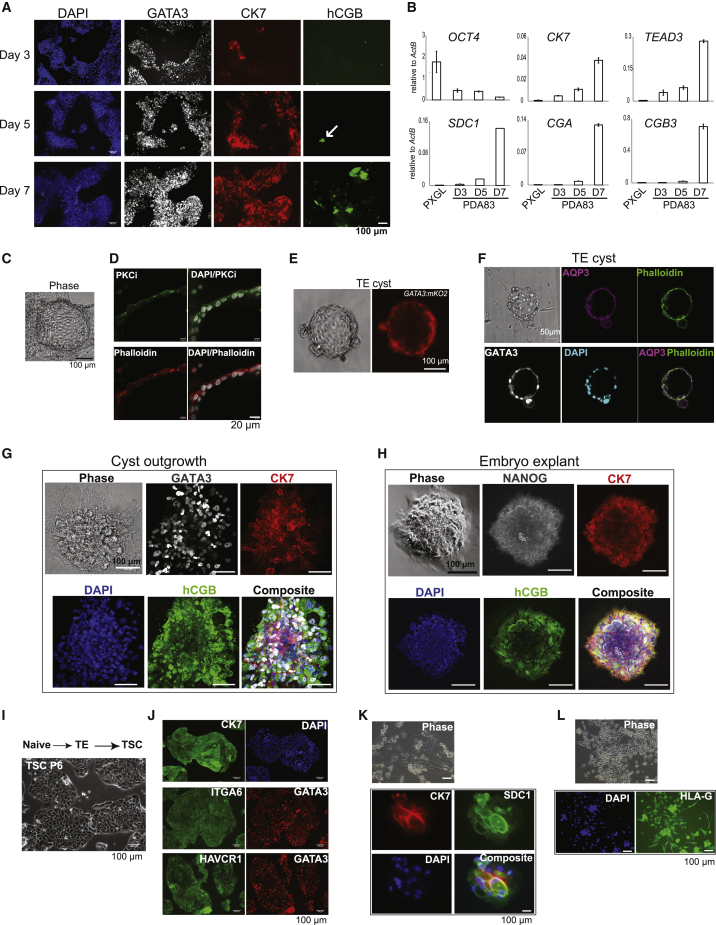
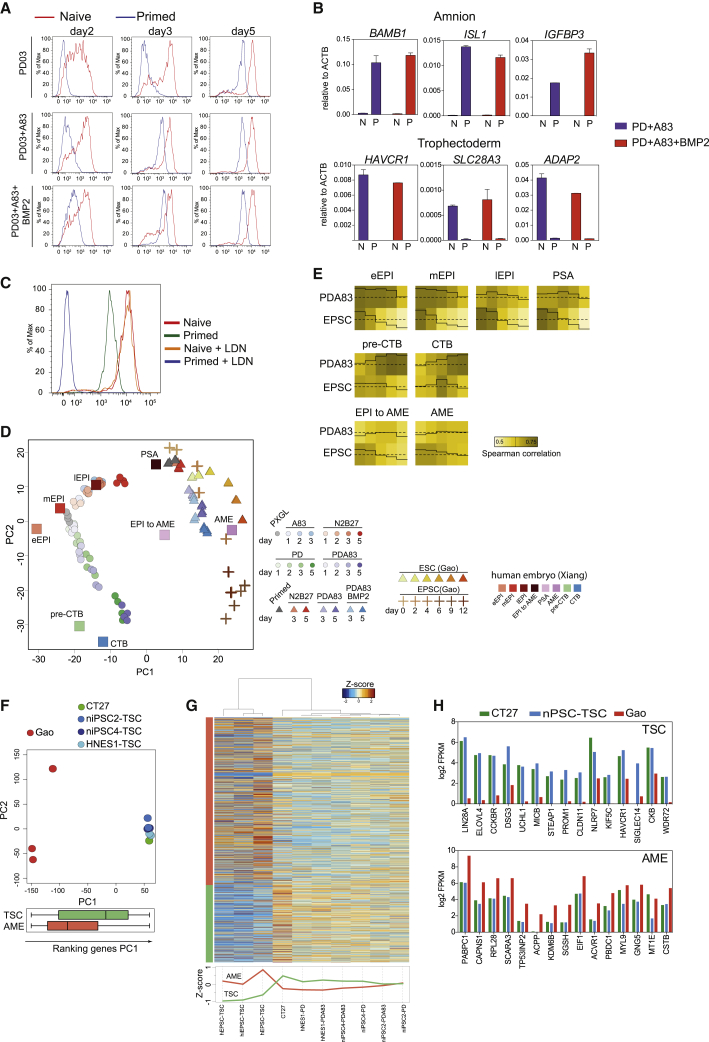
Classic embryological experiments have established that the early mouse embryo develops via sequential lineage bifurcations. The first segregated lineage is the trophectoderm, essential for blastocyst formation. Mouse naive epiblast and derivative embryonic stem cells are restricted accordingly from producing trophectoderm. Here we show, in contrast, that human naive embryonic stem cells readily make blastocyst trophectoderm and descendant trophoblast cell types. Trophectoderm was induced rapidly and efficiently by inhibition of ERK/mitogen-activated protein kinase (MAPK) and Nodal signaling. Transcriptome comparison with the human embryo substantiated direct formation of trophectoderm with subsequent differentiation into syncytiotrophoblast, cytotrophoblast, and downstream trophoblast stem cells. During pluripotency progression lineage potential switches from trophectoderm to amnion. Live-cell tracking revealed that epiblast cells in the human blastocyst are also able to produce trophectoderm. Thus, the paradigm of developmental specification coupled to lineage restriction does not apply to humans. Instead, epiblast plasticity and the potential for blastocyst regeneration are retained until implantation.

Keywords: pluripotency, epiblast, embryonic stem cells, trophoblast, embryo, blastocyst, lineage segregation, differentiation.


Conflict of interest statement

Declaration of interests A.S. and G.G. are inventors on a patent application relating to human naive stem cells filed by the University of Cambridge.

Figures

None
Graphical abstract
Figure 1
Figure 1
Trophectoderm formation (A) Images of naive stem cells and cells differentiating in PD after 3 days. (B) qRT-PCR assay for post-implantation epiblast, trophectoderm, and core pluripotency markers after 5 days under the indicated conditions. Error bars are from technical duplicates. (C) Phase and fluorescence images of GATA3:mKO2 reporter cells after 3 days in PD only. (D) Flow cytometry analysis of GATA3:mKO2 cells exposed to PD+A83 for the indicated periods. (E) qRT-PCR assay of GATA2 and GATA3 expression over time under the indicated conditions. Error bars are from technical duplicates. (F) Immunostaining for the trophectoderm markers GATA3 and cytokeratin 18 (CK18) and the naive markers KLF17 and NANOG after 3 days in PD+A83. (G) Flow cytometry analysis of GATA3:mKO2 cells treated with PD+A83 for the indicated periods, followed by N2B27. (H) Flow cytometry analysis of GATA3:mKO2 cells treated with PD for 24 h, followed by transfer to A83 or Activin A for 48 h.
Figure 2
Figure 2
Trophoblast differentiation and TSC generation (A) Immunostaining for GATA3, CK7, and hCGB after the indicated days in PD+A83. (B) qRT-PCR assay of trophoblast marker expression at the indicated times. Error bars from technical duplicates. (C) Phase image of adherent epithelial cyst formed after PD+A83 treatment for 5 days. (D) Confocal image of adherent cyst immunostained for aPKCι. (E) GATA3-mKO-positive cyst formed in suspension culture in PD+A83 for 3 days. (F) Phalloidin and immunofluorescence staining of a cyst formed in suspension. (G) Immunostained outgrowth from a suspension cyst plated on laminin111-E8 for 5 days in N2B27. (H) Immunostained human blastocyst (E6) outgrowth after 5 days in N2B27 on laminin111-E8. (I) Phase contrast images of naive stem-cell-derived TSCs. (J) Immunostaining of naive stem-cell-derived TSCs at passage 5. (K and L) Phase contrast and immunostained images of naive stem-cell-derived TSCs differentiated under conditions for syncytiotrophoblast (K) or extravillous trophoblast (L).
Figure 3
Figure 3
Whole-transcriptome analysis (A) PCA computed with all expressed protein-coding genes (log2 expression > 0, n = 19,450) and two-dimensional kernel density estimation of the contribution of genes with enriched expression in late trophectoderm (TE; purple dotted lines; late TE versus EPI log2FC [fold-change] > 2, n = 409) or in primed hPSCs (red dotted lines; primed versus naive; Stirparo et al., 2018; log2FC > 2, n = 1,778). (B) One-way hierarchical clustering of differentially expressed genes between late TE (blue) and epiblast (EPI; red) (top 200 up- and down-ranked genes; rank is the product of –log10padj [adjusted p-value] and FC) in HNES1 time courses under the indicated conditions. (C) Log2 FPKM (fragments per kilobase per million mapped reads) expression value for selected TE genes under A83, N2B27, PD, and PD+A83 conditions. Error bars are from biological duplicates. (D) Heatmap of Z score centered values for clusters identified in the PD+A83 time course (cluster 1, 1,787; cluster 2, 2,594; cluster 3, 1,872; cluster 4, 1,227; cluster 5, 2,055; cluster 6, 1,839). (E) Ratio of modulated genes between eTE/ICM (blue and green) and lTE/EPI (purple and red) in each cluster. (F) Bootstrap Spearman correlation (100 iterations, number of genes = 50) between the PD+A83 time course (PXGL, d1,d2,d3,d5, log2 expression > 1) and human embryo stages.
Figure 4
Figure 4
Single-cell analysis (A) UMAP of the PD+A83 time course, colored according to sample day. (B) Expression of selected pluripotency markers in (A). (C) Expression of selected TE and early trophoblast markers in (A). (D) Expression in (A) of genes enriched in the indicated human embryo stages (Xiang et al., 2019): eEPI, E6–E8 Epi; preCTB, TE (E6–E7); CTB, cytotrophoblast; eSTB, early syncytiotrophoblast. (E) UMAP with addition of cells cultured for 24 h in PD+A83 followed by 3 days in N2B27 only. (F) Expression of selected post-implantation Epi markers in (E). (G) Expression of selected hypoblast markers in (E). (H) Expression in (E) of genes enriched in the indicated human embryo stages (Xiang et al., 2019): eEPI, E6–E8 Epi; mEPI, E9–E10 Epi; lEPI, E12–E14 Epi; HYP, hypoblast.
Figure 5
Figure 5
Genetic perturbations (A) Immunostaining for the indicated markers after Cas9/gRNA RNP targeting of OCT4, SOX2, or NANOG in HNES1 cells and maintenance in PXGL for 5 days. (B) As (A), but the culture was changed to N2B27 after 1 day. (C) qRT-PCR assay of TE marker expression after Cas9/gRNA RNP targeting of the indicated genes in HNES1 cells. Error bars from technical duplicates. (D) GATA3:mKO2 cells with or without DOX (doxycline) induction of NANOG in PD+A83 for 5 days. (E) Flow cytometry histogram of GATA3:mKO2 expression in N2B27 or PD+A83 with or without DOX induction of NANOG. (F) Heatmap of qRT-PCR gene expression values with and without DOX induction of NANOG in N2B27 or PD+A83. (G) GATA3:mKO2 flow cytometry plots after GFP (control) or TFAP2C targeting by gRNA plasmid transfection and culture for 4 days in PD. (H) qRT-PCR assay of marker expression after GFP or TFAP2C targeting and culture as in (H). Error bars from technical duplicates.
Figure 6
Figure 6
Potency of naive versus primed hPSCs (A) Flow cytometry analysis of naive and primed GATA3:mKO2 cells in PD03, PD03+A83, or PD03+A83+BMP2. (B) qRT-PCR assay of selected AME and TE markers after 5 days culture of naive (N) or primed (P) cells in PD03+A83 with or without BMP2. Error bars from technical duplicates. (C) Flow cytometry analysis of naive and primed GATA3:mKO2 cells in PD03+A83 with or without the BMP inhibitor LDN. (D) PCA of RNAseq data fromdifferentiation time courses for naive cells (HNES1 and cR-H9), hEPSCs (Gao et al., 2019), and primed hPSCs (H9, HNES1), together with averaged values for human embryo stages during extended in vitro development (Xiang et al., 2019). Computed using the 1,000 most variable genes between embryo stages with log2FPKM ≥ 1 in at least one stage. (E) Traced heatmap computed with median of bootstrap Spearman correlation (iteration 100, number of genes = 50). (F) Top: PCA computed with all expressed genes for hEPSC derivatives (Gao et al., 2019), placental TSCs (CT27), and N stem-cell-derived TSC samples. Values from this study are averages from biological duplicates. Naive stem-cell-derived TSCs were generated after initial induction with PD only or with PD+A83. Bottom: Box and whisker plot of distribution along PC1 of genes enriched for expression in TSCs (Okae et al., 2018) compared with trophoblast lineages in the embryo or in AME compared with other embryo stages (Xiang et al., 2019). (G) Top: heatmap computed with AME- and TSC-enriched genes for hEPSC-derived cells, placental cytotrophoblast TSCs, and naive cell-derived TSCs. Bottom: median Z score for AME- and TSC-enriched genes in cell line samples. (H) Log2 FPKM-averaged expression in cells from the indicated studies of the top 15 differentially enriched genes in TSCs or AME.
Figure 7
Figure 7
Plasticity of human embryo pre-implantation Epi (A) Immunostaining of fully expanded human blastocysts as used in this study for markers of TE, Epi, and HYP. (B) Schematic of live-cell labeling of TE and Epi cells for culture analysis. (C) Live-cell images after SUSD2 labeling 20 h after plating. In the bottom panel, a and b denote separate SUSD2-positive cell clusters, and arrows indicate SUSD2-negative, WGA-positive cells. (D) Immunostaining of cultures in (D) after culture for 96 h. (E) Schematic summary of findings showing that N cells can differentiate to TE or progress to formative pluripotency with a switch of lineage competence from TE to AME.

Comment in

References

    1. Adachi K., Nikaido I., Ohta H., Ohtsuka S., Ura H., Kadota M., Wakayama T., Ueda H.R., Niwa H. Context-dependent wiring of Sox2 regulatory networks for self-renewal of embryonic and trophoblast stem cells. Mol. Cell. 2013;52:380–392. - PubMed
    1. Amita M., Adachi K., Alexenko A.P., Sinha S., Schust D.J., Schulz L.C., Roberts R.M., Ezashi T. Complete and unidirectional conversion of human embryonic stem cells to trophoblast by BMP4. Proc. Natl. Acad. Sci. USA. 2013;110:E1212–E1221. - PMC - PubMed
    1. Anders S., Huber W. Differential expression analysis for sequence count data. Genome Biol. 2010;11:R106. - PMC - PubMed
    1. Anders S., Pyl P.T., Huber W. HTSeq — A Python framework to work with high-throughput sequencing data. bioRxiv. 2014 - PMC - PubMed
    1. Beddington R.S.P., Robertson E.J. An assessment of the developmental potential of embryonic stem cells in the midgestation mouse embryo. Development. 1989;105:733–737. - PubMed

Publication types