. 2021 May 13;184(10):2605-2617.e18.
doi: 10.1016/j.cell.2021.03.027. Epub 2021 Mar 16.

SARS-CoV-2 evolution in an immunocompromised host reveals shared neutralization escape mechanisms

Affiliations

SARS-CoV-2 evolution in an immunocompromised host reveals shared neutralization escape mechanisms

Sarah A Clark et al. Cell. .

Abstract

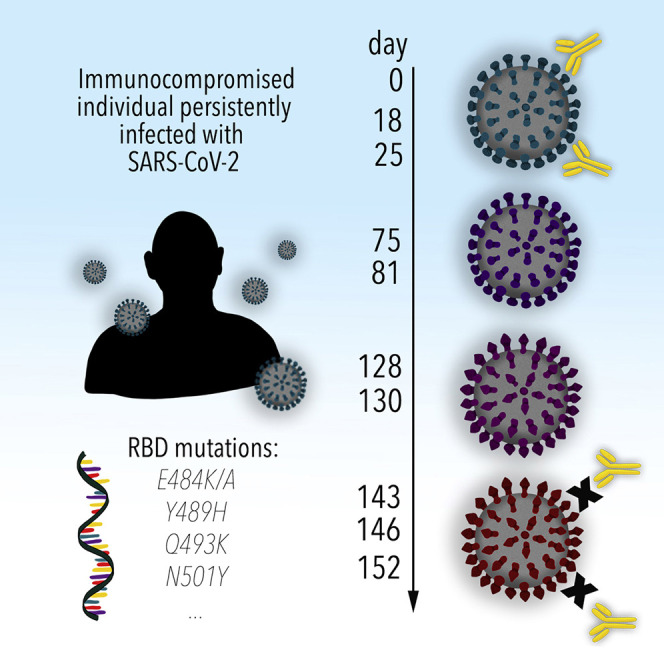
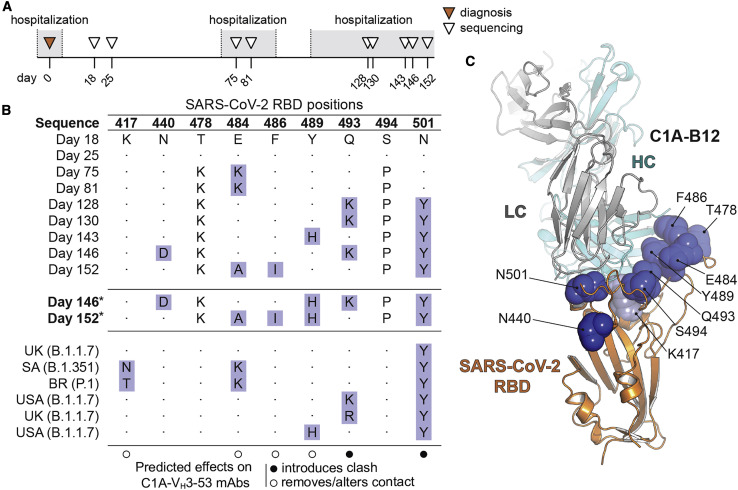
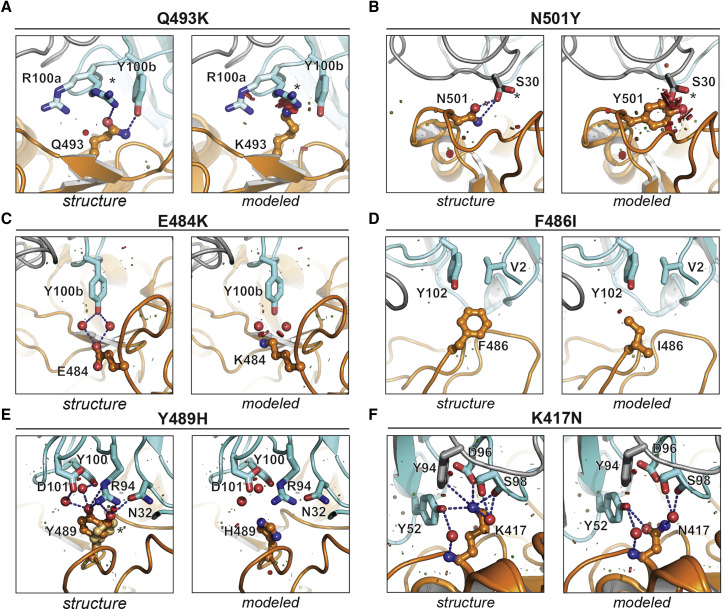
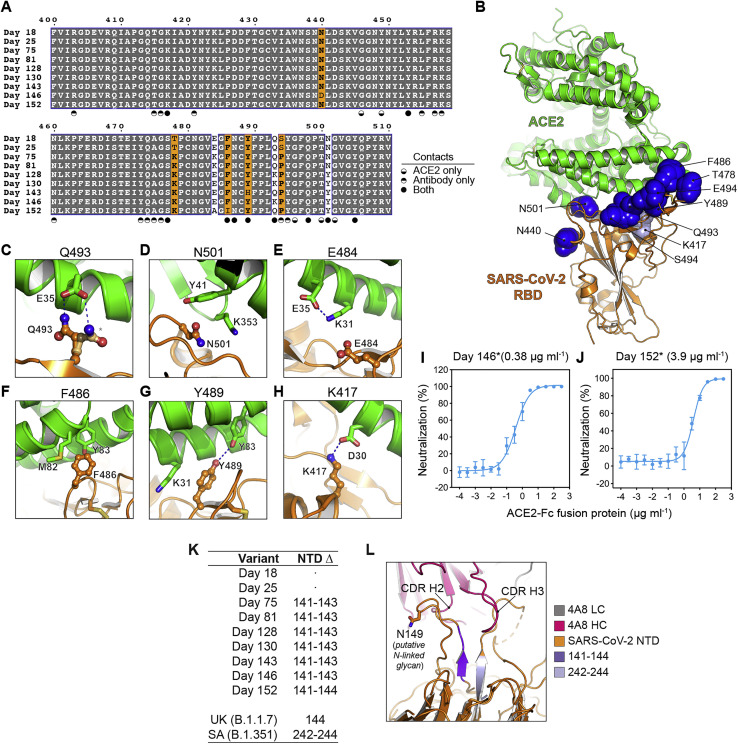
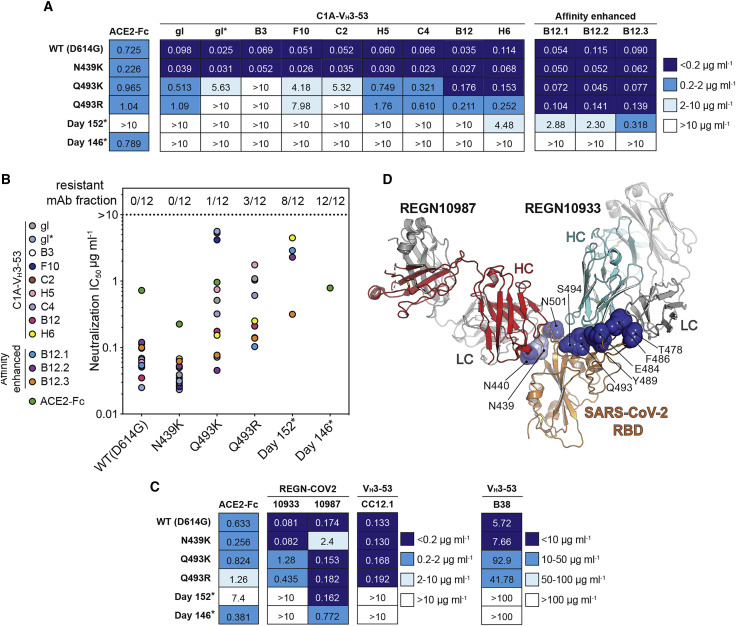
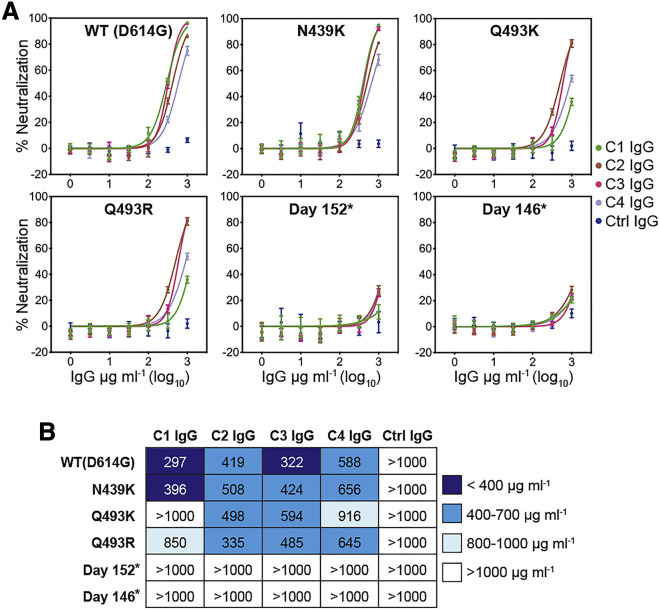
Many individuals mount nearly identical antibody responses to SARS-CoV-2. To gain insight into how the viral spike (S) protein receptor-binding domain (RBD) might evolve in response to common antibody responses, we studied mutations occurring during virus evolution in a persistently infected immunocompromised individual. We use antibody Fab/RBD structures to predict, and pseudotypes to confirm, that mutations found in late-stage evolved S variants confer resistance to a common class of SARS-CoV-2 neutralizing antibodies we isolated from a healthy COVID-19 convalescent donor. Resistance extends to the polyclonal serum immunoglobulins of four out of four healthy convalescent donors we tested and to monoclonal antibodies in clinical use. We further show that affinity maturation is unimportant for wild-type virus neutralization but is critical to neutralization breadth. Because the mutations we studied foreshadowed emerging variants that are now circulating across the globe, our results have implications to the long-term efficacy of S-directed countermeasures.

Keywords: COVID-19; SARS-CoV-2; affinity maturation; antibody neutralization; immunocompromised host; neutralization escape; variants of concern.


Conflict of interest statement

Declarations of interest A provisional application protecting various aspects of inventions described in this publication has been filed by the President and Fellows of Harvard University.

Figures

None
Graphical abstract
Figure S1
Figure S1
Isolation of SARS-CoV-2 S-reactive antibodies from a COVID-19 convalescent individual, related to Table 1 (A) Entry levels of SARS-CoV-2 or vesicular stomatitis virus (VSV) lentivirus pseudotypes after pre-incubation with polyclonal immunoglobulins (IgG) purified from the plasma of a COVID-19 convalescent individual (“C1”), a non-immune control donor (“ctrl”), or with an ACE2-Fc fusion protein all at a concentration of 316 μg ml-1. Data are normalized to a no antibody control. Means ± standard deviation from two experiments performed in triplicate (n = 6) are shown. One-way ANOVA with Tukey’s multiple comparisons test. ∗∗∗∗p < 0.0001. (B) Density plot from a FACS experiment to isolate memory B cells that bind phycoerythrin (PE)-labeled streptavidin tetramers coupled to a prefusion-stabilized SARS-CoV-2 S construct (S2P-PE). The approximate location of the sorting gate is shown as a box, and the percentage of cells that fall within the gate is indicated. The left panel is for a control donor and the right panel is for COVID-19 convalescent donor C1. CD19 is a B cell marker. (C) Whisker plot showing ELISA values for IgG binding to S2P, the SARS-CoV-2 RBD, or a control protein Lujo virus (LUJV) GP1. Antibodies were added at a single concentration of 100 μg ml-1. Dashed line represents the cut off for our definition of antibodies that bind the respective protein. (D) Antibody heavy and light chain gene usage for SARS-CoV-2 S-reactive monoclonal antibodies. Asterisks indicate clonally related VH3-53/VK1-9 antibodies (referred to as “C1A-VH3-53 antibodies” in the text). (E-F) Violin plots showing CDR3 loop lengths and somatic hypermutation frequencies (S.H.M.) for S-reactive monoclonal antibodies. The median and quartiles are shown as dashed and dotted lines, respectively. For CDR3 loop lengths, the median and first quartile marker overlap. (G) SARS-CoV-2 or VSV lentivirus pseudotypes were pre-incubated with 100 μg ml-1 of the indicated monoclonal antibody or an ACE2-Fc fusion protein (indicated in bold) and the mixture was used to infect HEK293T-hACE2 cells. Entry levels were quantified 48 h later using FACS. Data are normalized to a no antibody control. Dashed line indicates 10% relative entry. Means ± standard deviation from two experiments performed in triplicate (n = 6) are shown.
Figure 1
Figure 1
Affinity maturation of C1A-VH3-53 antibodies (A and B) Alignment of antibody variable heavy (A) or light chain (B) gene sequences. The Kabat numbering scheme is used. The C1A-gl sequences shown are germline revertant sequences designed using IMGT/V-QUEST (Brochet et al., 2008). Note in (A) that CDR H3 germline sequences are impossible to predict but we could identify a possible substitution (see Figure 2A). Panels were generated using ESPrit3 (Robert and Gouet, 2014) and modified. RBD contacting residues are indicated with a filled black circle. (C) Ribbon diagram of the crystal structure of the C1A-B3 Fab/RBD complex showing the location of somatic mutations. See also Figure S4. (D) Interactions for CDR H1 residue 31 with the RBD are shown for C1A-B3 (left panel) or C1A-C2 (right panel) showing the effects of the S31NVH substitution. (E) Interactions occurring at the base of CDR H1 near the framework regions are shown for C1A-B3 (left panel) or C1A-C2 (right panel) showing the effects of the A24VVH mutation. (F) Interactions of CDR H2 residue 56 with the RBD are shown for C1A-B3 (left panel) or C1A-B12 (right panel) showing the effects of the S56T/AVH mutations. Both sets of interactions shown occur after somatic mutations; we did not visualize germline interactions at this position. (G) Interactions of CDR L3 residue 92 with the RBD are shown for C1A-B3 (left panel) or C1A-B12 (right panel) showing the effects of the N92IVL substitution. For (D), (E), and (G), “germline” indicates baseline interactions occurring when a given residue is not somatically mutated. See also Figure S5 and Table S2.
Figure S2
Figure S2
SARS-CoV-2 pseudotype and infectious virus neutralization assays, related to Figure 5 and Table 1 (A) SARS-CoV-2 lentivirus pseudotypes were pre-incubated with monoclonal antibodies at the indicated concentrations and the mixture was used to infect HEK293T-hACE2 cells. Entry levels were quantified 48 h later using FACS. VSV pseudotypes are included as a negative control. Data are normalized to a no antibody control. Means ± standard deviation from two experiments performed in triplicate (n = 6) are shown. For some data points, error bars are smaller than symbols. IC50 values are shown in parentheses. (B) Infectious SARS-CoV-2 (strain USA-WA1/2020) was incubated with monoclonal antibodies at the indicated concentration with infection of Vero E6 cells subsequently measured in a PRNT assay (Zhang et al., 2020). Means ± standard deviation from three experiments performed in triplicate (n = 9) are shown. Data are normalized to a no antibody control. For some data points, error bars are smaller than symbols. IC50 values are shown in parentheses. (C) Dose response neutralization assays of C1A-VH3-53 and affinity enhanced versions of C1A-B12 with the indicated S pseudotypes. Data are normalized to a no antibody control. Means ± standard deviation from two experiments performed in triplicate (n = 6) are shown. IC50 values are shown in Figures 5A and 5B. (D) Dose response neutralization assays of REGN10933 and REGN10987 (Baum et al., 2020; Hansen et al., 2020) and CC12.1 (Rogers et al., 2020) with the indicated S pseudotypes. Data are normalized to a no antibody control. Means ± standard deviation from two experiments performed in triplicate (n = 6) are shown. IC50 values are shown in Figure 5C. (E) Dose response neutralization assays of monoclonal antibody B38 (Wu et al., 2020). Means ± standard deviation from two experiments performed in triplicate (n = 6) are shown. IC50 values are shown in Figure 5C.
Figure S3
Figure S3
Fab binding kinetics to the SARS-CoV-2 receptor-binding domain, related to Table 1 Fab affinities for the SARS-CoV-2 RBD were measured using biolayer interferometry. Red lines represent the fit for a 1:1 binding model, and alternate colors represent response curves measured at varying concentrations. Binding kinetics were measured for six concentrations of Fab at twofold dilutions ranging from 500 to 15.6 nM (C1A-B3, C1A-F10, C1A-gl, C1A-gl), 250 to 7.8 nM (C1A-C2, C1A-H5, C1A-C4), and from 15.6 to 0.49 nM (C1A-B12 and C1A-H6). For affinity enhanced antibodies, binding kinetics were measured at seven concentrations of Fab at twofold dilution ranging from 100 to 1.56 nM (C1A-B12.1) or from 10 to 0.16 nM (C1A-B12.2 and C1A-B12.3). Each experiment was performed at least twice, and representative data are shown.
Figure S4
Figure S4
SARS-CoV-2 receptor-binding domain recognition by C1A-VH3-53 antibodies, related to Figure 1 (A) BLI-based competition assay for C1A-B12 Fab, CR3022 Fab, and human ACE2 ectodomain Fc fusion protein (ACE2-Fc) binding to the SARS-CoV-2 RBD. Arrows show the time point at which the indicated protein was added. Representative results of two replicates for each experiment are shown. (B) Overlay of ribbon diagrams for X-ray crystal structures of Fab/RBD complexes. CDR loops contacting the RBD are indicated. (C) Ribbon diagram of the X-ray crystal structure of the RBD bound to the ACE2 ectodomain (PDB ID: 6M0J) (Lan et al., 2020) with the RBD in the same orientation as shown in (B) for comparison. (D-G) Details of the RBD/antibody interface for C1A-B3. The panels show significant contacts made by antibody CDR loops.
Figure 2
Figure 2
Affinity maturation plays a limited role in potent SARS-CoV-2 neutralization (A) Nucleotide sequences of the D segment of C1A-VH3-53 antibodies. Changes that likely occurred at CDR H3 position 100a (S100aR or S100aK) during somatic hypermutation are highlighted. (B) C1A-B12/RBD complex showing interactions occurring with alternate side chain conformers of CDR H3 residue R100a (one conformer is labeled with an asterisk). (C) Amino acid sequences for CDR H3 loops of C1A-gl and C1A-gl. (D) Results of a PRNT assay with infectious SARS-CoV-2 and the indicated antibodies. Data are normalized to a no antibody control. Means ± standard deviation from three experiments performed in triplicate (n = 9) are shown. Error bars indicate standard deviation. For some data points, error bars are smaller than symbols. (E) Dose response neutralization assay results with SARS-CoV-2 D614GS pseudotype. Data are normalized to a no antibody control. Means ± standard deviation from two experiments performed in triplicate (n = 6) are shown. For some data points, error bars are smaller than symbols. (F) Correlation analysis of Fab/RBD antibody affinity measurements for the indicated antibodies and SARS-CoV-2 USA/WA1/2020 neutralization IC50 values. r, Pearson correlation coefficient; n.s., not significant.
Figure S5
Figure S5
Structure-guided affinity maturation of C1A-B12, related to Figures 1 and 5 (A) Examples of gene usage and CDR H3 lengths for other VH3-53/3-66 antibodies for which structures are available. All antibodies, which were isolated from COVID-19 convalescent donors, engage the RBD with an essentially identical binding mode. CDR H3 length was determined using IMGT/V-QUEST definitions (Brochet et al., 2008). aa: amino acids. PDB ID: protein data bank identification code. (B) Structural alignment of variable heavy (HC) and light chain (LC) Fab portions of VH3-53/3-66 antibodies bound to the RBD. Antibodies included in the alignment are listed in (A). (C-D) Alignment of variable heavy chain (C) and VK1-9-derived light chain (D) gene sequences of VH3-53/3-66-derived antibodies reported here and elsewhere. Antibody sequences were obtained from the RCSB record and protein data bank (PDB) IDs listed in (A). Panels were generated using ESPrit3 (Robert and Gouet, 2014) and modified. The Kabat numbering scheme is used. (E-F) Interactions occurring at the base of CDR H1 with framework regions are shown for the B38 Fab/RBD complex (PDB: 7BZ5) (Wu et al., 2020) (E) or CV30 Fab/RBD complex (PDB: 6XE1) (Hurlburt et al., 2020) (F). The T28IVH mutation adds a hydrophobic contact with G476RBD, and the F27VVH mutation probably makes CDR H1 more flexible, allowing local polar contacts to be optimized. (G) Partial sequence alignment of C1A-VH3-53 and affinity enhanced antibodies C1A-B12.1, C1A-B12.2, and C1A-B12.3. (H) Infectious SARS-CoV-2 (strain USA-WA1/2020) was incubated with monoclonal antibodies at the indicated concentrations with infection of Vero E6 cells subsequently measured in a PRNT assay. Means ± standard deviation from three experiments performed in triplicate (n = 9) are shown. Data are normalized to a no antibody control. For some data points, error bars are smaller than symbols. IC50 values are in parentheses.
Figure 3
Figure 3
RBD sequence evolution during persistent SARS-CoV-2 infection (A) Timeline and sequencing interval during persistent SARS-CoV-2 infection of an immunocompromised individual as reported by Choi et al. (2020). The individual was admitted three times between days 6 and 68; prolonged hospitalizations are shown in gray. Sequencing on days 18 and 25 was obtained during shorter hospitalizations, which are not shown. (B) Table showing SARS-CoV-2 S RBD mutations occurring during persistent infection (Choi et al., 2020). Predicted effects of substitutions on binding of the C1A-VH3-53 antibodies are shown in the legend. Mutations that are the focus of our analysis are highlighted. For pseudotyping, we generated S mutants for day 146 and 152 S sequences that retain the Y489HRBD mutation that occurred on day 143 (these are labeled “day 146” and “day 152”). Sequences from variants that were first detected in the United Kingdom (“UK,” B.1.1.7), South Africa (“SA,” B.1.351), and Brazil (“BR,” P.1), and additional human-derived S sequences containing relevant mutations from samples collected in the United States (USA), are also included for comparison (see Figure S6 and Table S3). (C) Structure of the C1A-B12 Fab/RBD complex with mutated residues indicated in (B) shown as spheres. Residues mutated during SARS-CoV-2 evolution in the immunocompromised individual are shown as dark blue spheres, and a residue mutated in the B.1.351 and P.1 variants (K417) is shown as a light blue sphere. See also Figure S7.
Figure 4
Figure 4
Predicted effects of RBD mutations on C1A-VH3-53 neutralizing antibody binding (A–F) For each indicated mutation, interactions observed in the C1A-B12/RBD complex structure are shown in the left panels (labeled “structure”) and predicted effects of mutations based on modeling are shown in the right panels (labeled “modeled”). PyMol was used to model mutations and visualize steric clashes; short green lines or small green disks are present when nearby atoms are almost in contact, and large red disks indicate significant van der Waals overlap. For modeling, only residues on the RBD were modified, and all RBD residue rotamers in the rotamer library were checked and the one that caused the least clashes was chosen. Alternate side chain rotamers for R100aVH in (A), S30VL in (B), and for Y489RBD in (E) are indicated with an asterisk. See also Figure S7 and Table S3.
Figure S6
Figure S6
Alignment of SARS-CoV-2 S sequences, related to Figure 3 Alignment of SARS-CoV-2 sequences. The following sequences were used for the alignment: Day 18: hCoV-19/USA/MA-JLL-D18/2020 (EPI_ISL_593478); Day 25: hCoV-19/USA/MA-JLL-D25/2020 (EPI_ISL_593479); Day 75: hCoV-19/USA/MA-JLL-D75/2020 (EPI_ISL_593480); Day 81: hCoV-19/USA/MA-JLL-D81/2020 (EPI_ISL_593553); Day 128: hCoV-19/USA/MA-JLL-D128/2020 (EPI_ISL_593554); Day 130: hCoV-19/USA/MA-JLL-D130/2020 (EPI_ISL_593555); Day 143: hCoV-19/USA/MA-JLL-D143/2020 (EPI_ISL_593556); Day 146: hCoV-19/USA/MA-JLL-D146/2020 (EPI_ISL_593557); Day 152: hCoV-19/USA/MA-JLL-D152/2020 (EPI_ISL_593558). Sequences from United Kingdom (“UK”) B.1.1.7 hCoV-19/England/205261299/2020 (EPI_ISL_754289), South Africa (“SA”) B.1.351 hCoV-19/South Africa/Tygerberg-461/2020 (EPI_ISL_745186), Brazil (“BR”) P.1 hCoV-19/Brazil/AM-20143138FN-R2/2020, United States (USA) B.1.1.7 Q493K hCoV-19/USA/FL-CDC-STM-0000013-F04/2021 (EPI_ISL_884605), UK B.1.1.7 Q493R hCoV-19/England/MILK-11C2FCD/2021 (EPI_ISL_1006449), and USA B1.1.7 Y489H hCoV-19/USA/CA-CDC-STM-A100413/2021 (EPI_ISL_850699) are included for comparison. The “day 146” sequence shown is a version of the day 146 sequence that retains wild-type residues at positions 12-18, contains an NTD deletion spanning residues 142-144 (instead of 141-143), and contains the Y489HRBD mutation. The “day 152” sequence shown is a version of the day 152 sequence that contains the Y489HRBD mutation. Both day 146 and day 152 sequences contain mutations in the C-terminal cytoplasmic tail to allow for efficient lentivirus pseudotyping. The figure was generated using ESPrit3 (Robert and Gouet, 2014).
Figure S7
Figure S7
RBD sequence variation in relation to ACE2 interactions and predicted NTD deletion effects, related to Figures 3 and 4 (A) Sequence alignment for S residues spanning the RBD in an immunocompromised individual (Choi et al., 2020) at the indicated time points. RBD residues that interact with ACE2 only, C1A-VH3-53 antibodies only, or both, are indicated. (B) Ribbon diagram of the X-ray crystal structure of an ACE2 ectodomain/RBD complex (PDB ID: 6M0J) (Lan et al., 2020). Residues that are mutated during SARS-CoV-2 persistent infection are shown as dark blue spheres. The K417RBD residue, which is mutated in the B.1.351 and P.1 variants (see Figure 3B), is shown as light blue spheres. (C-H) Views highlighting where select RBD mutations (see Figures 3D–3I) fall with respect to the ACE2 interface. (I-J) SARS-CoV-2 day 146 (I) or day 152 (J) S pseudotypes were pre-incubated with an ACE2-Fc fusion protein at the indicated concentrations and the mixture was used to infect HEK293T-hACE2 cells. Entry levels were quantified 48 h later using FACS. Data are normalized to a no antibody control. Means ± standard deviation from two experiments performed in triplicate (n = 6) are shown. IC50 values are shown in parentheses. (K) Summary of SARS-CoV-2 S N-terminal domain (NTD) deletions occurring during persistent infection of an immunocompromised individual (Choi et al., 2020). Deletions found in United Kingdom (“UK”) B.1.1.7 (hCoV-19/England/205261299/2020, EPI_ISL_754289) and South Africa (“SA”) B.1.351 (hCoV-19/South Africa/Tygerberg-461/2020, EPI_ISL_745186) variants are also included for comparison. (L) Ribbon diagram of the 4A8 Fab:NTD interface (PDB: 7C2L) (Chi et al., 2020). Residues 141-144, which contain mutations starting on day 75, are shown in dark purple, and residues 242-244, which are mutated in the “SA” B.1.351 SARS-CoV-2 variant (Figure S6), are shown in light purple. The 141-144 deletion would reposition a putative N-linked glycosylation site (N149) and potentially block epitope access.
Figure 5
Figure 5
Neutralization escape from monoclonal antibodies (A) Table showing IC50 values for pseudotype neutralization tests with the indicated SARS-CoV-2 S pseudotypes. Monoclonal antibody names are abbreviated (e.g., C1A-gl is “gl” and C1A-B3 is “B3”). Antibodies are listed, left to right, in order of increasing affinity. IC50 values for an ACE2-Fc neutralization assay done as part of the same experiment are shown. See also Figure S2C. (B) Summary of results shown in (A) highlighting the fraction of resistant monoclonal antibodies for each S pseudotype. (C) Table showing IC50 values for SARS-CoV-2 S pseudotype neutralization tests with the indicated monoclonal antibodies. IC50 values for an ACE2-Fc neutralization assay done as part of the same experiment are shown. See also Figures S2D and S2E. (D) Ribbon diagram of the SARS-CoV-2 RBD bound to Fabs for antibodies REGN10987 and REGN10933 (PDB: 6XDG) (Hansen et al., 2020). Mutated residues of interest are shown as in Figure 3C, with the exception of residue N439RBD (shown as light blue spheres). See also Figure S5 and Table S4.
Figure 6
Figure 6
Neutralization escape from convalescent donor polyclonal serum IgG (A) Dose response neutralization assay with the indicated SARS-CoV-2 S pseudotypes with polyclonal serum IgG of four COVID-19 convalescent donors (C1, C2, C3, and C4) or that of a control, non-immune donor (“ctrl”). Means ± standard deviation from two experiments performed in triplicate (n = 6) are shown. (B) Table showing IC50 values for pseudotype neutralization tests shown in (A). See also Table S4.

Update of

Similar articles

Cited by

References

    1. Abraham J. Passive antibody therapy in COVID-19. Nat. Rev. Immunol. 2020;20:401–403. - PMC - PubMed
    1. Adams P.D., Afonine P.V., Bunkóczi G., Chen V.B., Davis I.W., Echols N., Headd J.J., Hung L.W., Kapral G.J., Grosse-Kunstleve R.W., et al. PHENIX: a comprehensive Python-based system for macromolecular structure solution. Acta Crystallogr. D Biol. Crystallogr. 2010;66:213–221. - PMC - PubMed
    1. Aricescu A.R., Lu W., Jones E.Y. A time- and cost-efficient system for high-level protein production in mammalian cells. Acta Crystallogr. D Biol. Crystallogr. 2006;62:1243–1250. - PubMed
    1. Avanzato V.A., Matson M.J., Seifert S.N., Pryce R., Williamson B.N., Anzick S.L., Barbian K., Judson S.D., Fischer E.R., Martens C., et al. Case study: prolonged infectious SARS-CoV-2 shedding from an asymptomatic immunocompromised individual with cancer. Cell. 2020;183:1901–1912. - PMC - PubMed
    1. Baum A., Fulton B.O., Wloga E., Copin R., Pascal K.E., Russo V., Giordano S., Lanza K., Negron N., Ni M., et al. Antibody cocktail to SARS-CoV-2 spike protein prevents rapid mutational escape seen with individual antibodies. Science. 2020;369:1014–1018. - PMC - PubMed

Publication types

Substances