. 2021 Apr 15;184(8):2239-2254.e39.
doi: 10.1016/j.cell.2021.03.009. Epub 2021 Apr 7.

Characterizing genetic intra-tumor heterogeneity across 2,658 human cancer genomes

Collaborators, Affiliations

Characterizing genetic intra-tumor heterogeneity across 2,658 human cancer genomes

Stefan C Dentro et al. Cell. .

Abstract

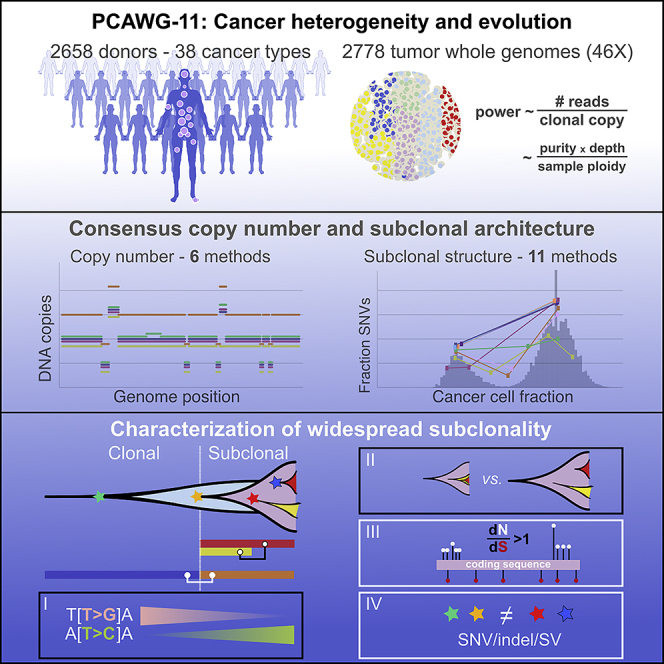
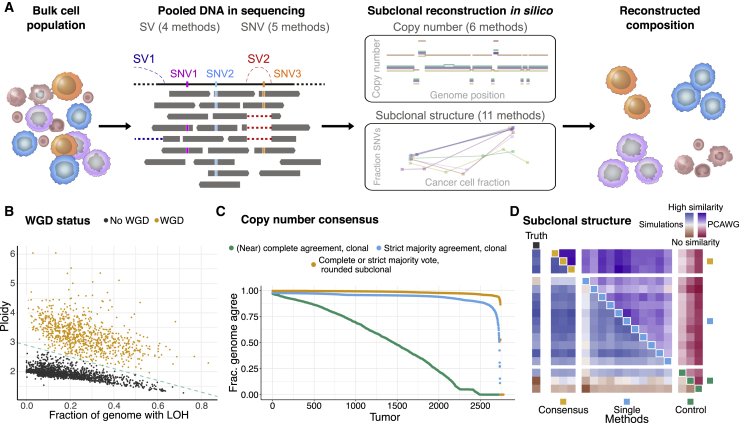
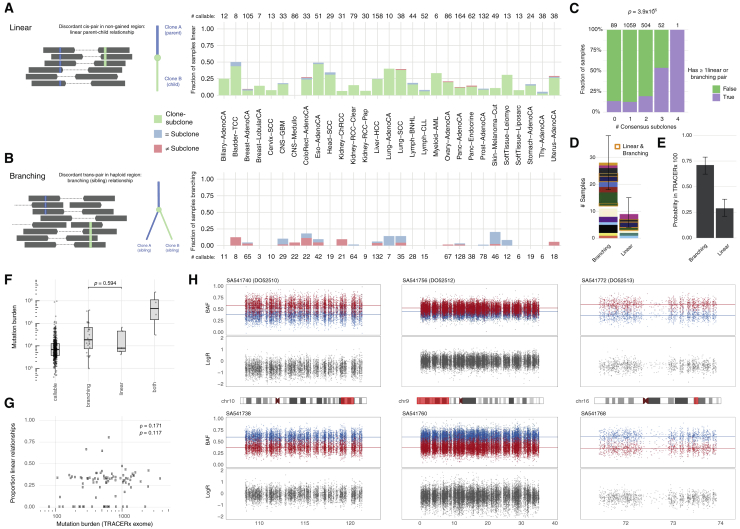
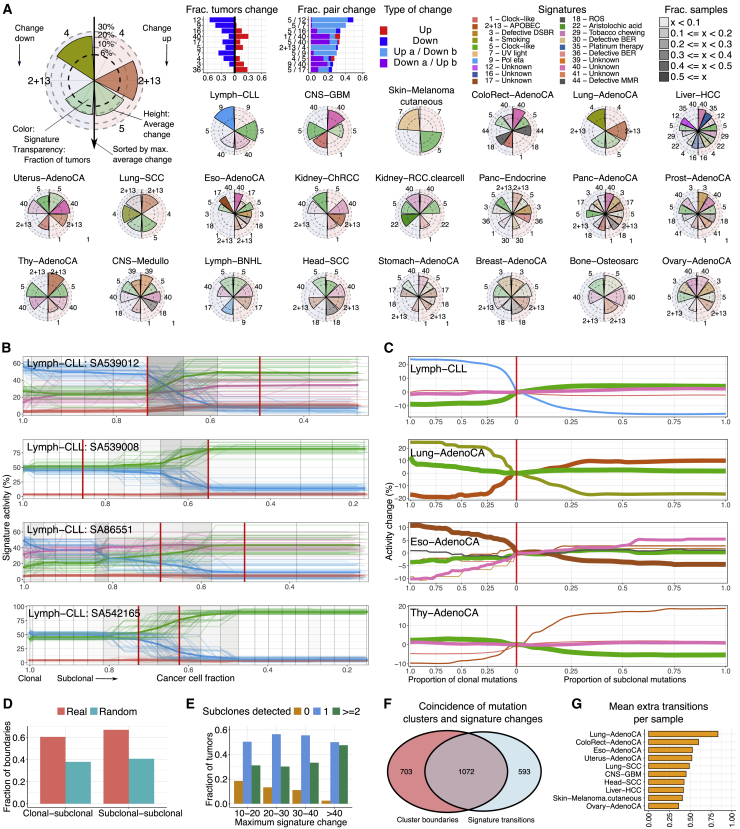
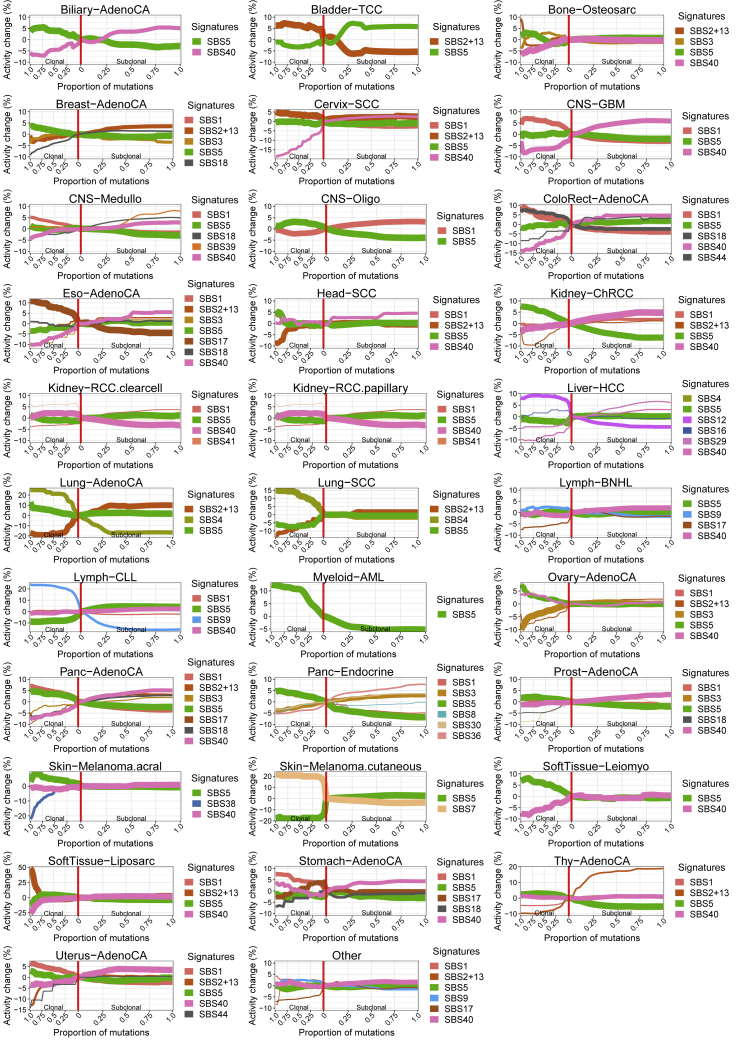
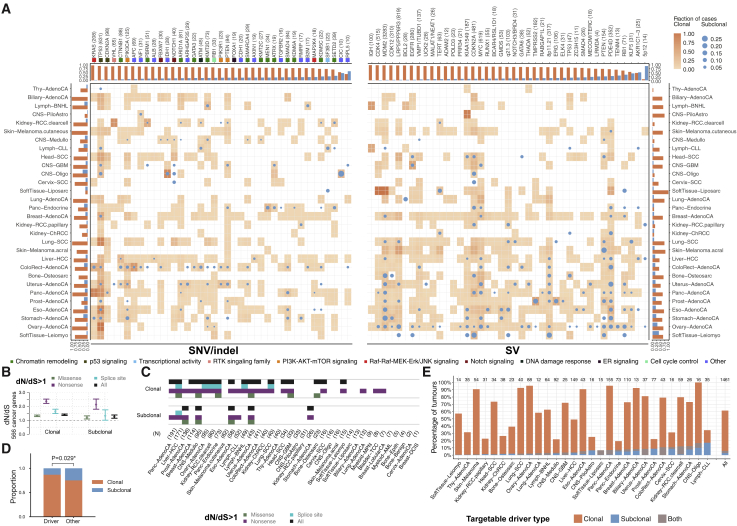
Intra-tumor heterogeneity (ITH) is a mechanism of therapeutic resistance and therefore an important clinical challenge. However, the extent, origin, and drivers of ITH across cancer types are poorly understood. To address this, we extensively characterize ITH across whole-genome sequences of 2,658 cancer samples spanning 38 cancer types. Nearly all informative samples (95.1%) contain evidence of distinct subclonal expansions with frequent branching relationships between subclones. We observe positive selection of subclonal driver mutations across most cancer types and identify cancer type-specific subclonal patterns of driver gene mutations, fusions, structural variants, and copy number alterations as well as dynamic changes in mutational processes between subclonal expansions. Our results underline the importance of ITH and its drivers in tumor evolution and provide a pan-cancer resource of comprehensively annotated subclonal events from whole-genome sequencing data.

Keywords: branching evolution; cancer driver genes; cancer evolution; intra-tumor heterogeneity; pan-cancer genomics; subclonal reconstruction; tumor phylogeny; whole-genome sequencing.


Conflict of interest statement

Declaration of interests G.M. and F.M. are cofounders and shareholders of Tailor Bio. R.B. owns equity in Ampressa Therapeutics. G.G. receives research funds from IBM and Pharmacyclics and is an inventor on patent applications related to MuTect, ABSOLUTE, MutSig, MSMuTect, and POLYSOLVER. I.L. is a consultant for PACT Pharma. B.J.R. is a consultant at and has ownership interest (including stock and patents) in Medley Genomics. N.M. has stock options in and has consulted for Achilles Therapeutics. C.S. acknowledges grant support from Pfizer, AstraZeneca, Bristol Myers Squibb, Roche-Ventana, Boehringer-Ingelheim, Archer Dx, and Ono Pharmaceutical; is an AstraZeneca Advisory Board Member and Chief Investigator for the MeRmaiD-1 clinical trial; has consulted for Pfizer, Novartis, GlaxoSmithKline, MSD, Bristol Myers Squibb, Celgene, AstraZeneca, Illumina, Amgen, Genentech, Roche-Ventana, GRAIL, Medicxi, Bicycle Therapeutics, and the Sarah Cannon Research Institute; has stock options in Apogen Biotechnologies, Epic Bioscience, and GRAIL; and has stock options and is co-founder of Achilles Therapeutics.

Figures

None
Graphical abstract
Figure 1
Figure 1
Consensus-based characterization of ITH (A) Schematic representation of our consensus-based ITH reconstruction. (B) Samples with and without WGD separate according to their consensus ploidy and the fraction of the genome showing loss of heterozygosity. (C) Agreement between the six copy number callers using a multi-tier consensus copy number calling approach. The three lines denote the fraction of the genome at which agreement is reached at different levels of confidence (STAR Methods). (D) Heatmap of the normalized average pairwise similarities of subclonal architectures identified by 11 individual, 3 consensus, and 3 control reconstruction methods. Each method is represented by one colored square on the diagonal. In rows and columns, each method is compared with all other methods. The upper triangle shows the similarities on the 2,658 PCAWG samples and the lower triangle on a validation set of 965 simulated samples. In the leftmost column, similarities are computed against the truth of the simulated set. Color intensities scale with the similarities and were normalized separately for PCAWG, simulations, and truth.
Figure S1
Figure S1
Validation of consensus purity values, related to Figure 1 The lower triangle shows pairwise scatterplots of the purities obtained through expression profiles of a panel of immune and stromal genes (ESTIMATE), somatic copy number data (ABSOLUTE), leukocyte unmethylation (LUMP), image analysis by hematoxylin and eosin staining (H&E staining), and consensus purity as derived by Aran et al., 2015 (CPE). The top triangle shows the respective Pearson correlation coefficients and the number of samples that have both purity estimates available.
Figure 2
Figure 2
CCF and subclonal mutation number correction (A) Validation of our approach to adjust for the overestimation effect at the lower bound of CCF. (B and C) The estimated cluster CCF (B) and SNV count (C) adjustment in all identified mutation clusters (ranked on the x axis according to effect size on the y axis). Subclonal clusters show a shift to smaller CCF values after correction (B), and the majority of clusters are estimated to contain additional missed SNVs (C).
Figure S2
Figure S2
Power analysis of the consensus subclonal architecture approach, related to Figure 3 (A) Our ability to detect subclones depends, not on the number of detected SNVs, but on the number of reads per tumor chromosomal copy (nrpcc) available. This metric takes tumor purity, ploidy and sequencing coverage into account (see STAR Methods). We control for this effect by including only tumors with nrpcc ≥ 10. In these tumors, we should be sufficiently powered to detect a subclone at a CCF ≥ 30% (see STAR Methods), as evidenced (B) which shows the minimum CCF of the detected clusters in each tumor against the number of reads per chromosome copy. (C) The fraction of subclonal mutations per sample does not show significant correlation with mutation burden across cancer types.
Figure 3
Figure 3
Overview and characterization of ITH across cancer types Evidence of ITH is shown for 1,705 samples with sufficient power to detect subclones at a CCF of more than 30% (STAR Methods). (A) Bar plot showing the fraction of samples with a given number of distinctive subclonal expansions. (B–E) Scatterplots showing the fractions of SNVs (B), indels (C), SVs (D), and arm-level CNAs (E) that were classified as subclonal. For SVs and CNAs, only samples with 5 or more events are plotted. Samples are ordered by increasing fraction of subclonal SNVs. (F and G) Violin plots showing total mutation burden (F) and fraction of the genome with CNAs (G). (H and I) Heatmaps showing the fraction of tumor samples with whole genome duplications (H) and the mean power to identify subclones per cancer type (nrpcc; STAR Methods) (I).
Figure S3
Figure S3
Illusion of clonality in single-sample versus multi-sample analysis, related to Figure 3 Comparison of clonality assignments and missed variants based on multi-region versus single-sample analyses for the five multi-region sequenced primary tumors in PCAWG. Subclonal mutations appearing to be clonal in the indicated sample display the illusion of clonality. Mutations detected in some, but not in other samples of the same tumor, are classified as uncalled in the latter samples.
Figure S4
Figure S4
Correlation in ITH between SNVs, indels, CNAs, and SVs by cancer type, related to Figure 3 Evidence of ITH is shown for 1,705 samples with sufficient power to detect subclones above 30% CCF (see STAR Methods), as in Figure 3. Pairwise scatterplots in the upper triangle show the fractions of subclonal SNVs, indels, CNAs and SVs per tumor sample. Pearson’s correlation coefficient (R) is separately computed for each panel across all samples. Panels on the diagonal show the kernel density estimate of the distribution of subclonal fractions. In the lower triangle, each point shows the median subclonal fraction per cancer type and intervals indicate the interquartile range. Panels only include samples with at least 5 arm-level CNAs (1,238 / 1,705) and at least 5 SVs (1,609 / 1,705).
Figure 4
Figure 4
Further characterization of ITH using mutation phasing (A and B) Proportion of powered tumors with evidence of linear and branching phylogenies through analysis of phased reads of variants in cis (A) or in trans (B) among tumors with at least one phaseable pair in the appropriate context. (C) Fraction of powered samples, stratified by number of consensus subclones, with at least one linear or branching pair (χ2 test for independence). (D) Number of samples with linear or branching pairs when sets are filtered to be comparable. Error bars indicate the 95% bootstrap interval. Samples are colored by tumor type and boxed (orange) when they present with pairs of both types. (E) Probabilities of observing a linear versus branching relationship when picking two random subclones from the TRAcking non-small cell lung Cancer Evolution through therapy [Rx] TRACERx 100 trees (Jamal-Hanjani et al., 2017). Error bars indicate the 95% bootstrap interval. (F) Mutation burden distribution for comparable samples reporting only non-informative phased SNV pairs and linear and/or branching pairs (Wilcoxon rank-sum test). Horizontal lines indicate the 25th, 50th, and 75th percentiles while whiskers extend to the most extreme observation no further than 1.5 times the interquartile range. (G) Proportion of linear subclone-subclone relationships versus exonic mutation burden in the TRACERx100 cohort (Spearman’s rank correlation and test for deviation from zero). (H) B allele frequency (BAF) and LogR at germline heterozygous SNPs across example loci exhibiting a mirrored subclonal allelic imbalance between sample pairs from three multi-region sequenced prostate tumors. Parental alleles are colored consistently (red and blue) within each sample pair (top and bottom), highlighting parallel gains or losses of alternate alleles.
Figure 5
Figure 5
Subclonal boundaries are associated with changes in mutation signature activity (A) Mutation signature changes across cancer types. Bar graphs show the proportion of tumors in which signature (pairs) change, and radial plots provide a view per cancer type. Each radial plot contains the signatures that are active in 5 or more tumors and change (>6%) in at least 3. The left and right sides of radial plots represent signatures that become less and more active, respectively. The height of a wedge represents the average activity change (log scale), the color denotes the signature, and the transparency shows the fraction of tumors in which the signature changes (as a proportion of tumors with that signature). Signatures are sorted from top to bottom by their average activity change. (B) Signature activity trajectories in four CLLs. Each horizontal line, colored by signature, is an inferred signature activity trajectory across pseudotime, as defined by the SNVs rank ordered by CCF and binned. Thin and bold lines reflect the individual bootstrapped replicates and their average, respectively. Vertical lines indicate time points placed at the average CCF of the binned SNVs, whereas the shading in between denotes the frequency of significant activity changes. Red vertical lines mark boundaries between consensus subclonal mutation clusters. (C) Average signature trajectories for selected cancer types. Each line, colored by signature, corresponds to the average activity across tumors of this cancer type in which the signature is active. Line width reflects the number of contributing tumors. Trajectories are centered around the activity at the boundary between clonal and subclonal SNVs (vertical red line) to highlight relative changes. (D) Fractions of observed and randomly placed signature change points that coincide with boundaries between mutation clusters. (E) Number of subclones detected in tumors grouped by the maximum signature activity change. (F) Venn diagram of coinciding SNV cluster boundaries and signature activity change points. (G) Mean number of additional signature change points detected per tumor.
Figure S5
Figure S5
Summary signature trajectories per cancer type, related to Figure 5 The average trajectories for mutation signatures were calculated across tumors of the same cancer type. The color of the line denotes the signature and its width reflects the number of contributing tumors. The trajectories have been centered around the activity at the boundary between clonal and subclonal mutations in order to highlight relative changes in signature activity.
Figure 6
Figure 6
Driver mutations and subclonal selection (A) Heatmaps showing the fraction of samples of each cancer type with clonal (orange squares, transparency) and subclonal (blue circles, size) driver SNVs and indels (left) and SVs (right). Marginal bar plots represent the total fraction of clonal and subclonal driver mutations in each cancer type (side) and each driver gene or candidate region (top). Genes with 4 or more subclonal driver mutations are shown. Gene color indicates gene set and pathway annotations for SNVs and indel drivers. (B) The ratios between the fraction of mutated nonsynonymous (dN) and synonymous (dS) sites, i.e. dN/dS for clonal and subclonal SNVs in 566 established cancer genes across all primary tumors. Values for missense, nonsense, splice site, and all mutations are shown, along with the 95% confidence intervals. (C) Cancer and mutation types for which dN/dS is greater than 1 (95% confidence intervals > 1) for clonal and subclonal mutations. Cancer types are ordered by the total number of samples. (D) Proportions of (sub)clonal driver gene fusions versus non-driver fusions. (E) Survey of actionable driver mutations across cancer types, stratified by clonal status.
Figure S6
Figure S6
Clonality analysis of significantly recurrent breakpoints, related to Figure 6 (A) Number and clonality of SVs observed at 52 loci with significantly recurrent breakpoints (SRBs) (Rheinbay et al., 2020). SVs with a subclonal probability larger than 50% were considered subclonal and clonal otherwise. (B) Proportion of cancer types contributing to the enrichment of clonal or subclonal SVs in a locus (see Figure 6A). The genes on the y axis represent the most likely driver gene for each locus (Rheinbay et al., 2020).

Comment in

References

    1. Abbosh C., Birkbak N.J., Wilson G.A., Jamal-Hanjani M., Constantin T., Salari R., Le Quesne J., Moore D.A., Veeriah S., Rosenthal R., TRACERx consortium. PEACE consortium Phylogenetic ctDNA analysis depicts early-stage lung cancer evolution. Nature. 2017;545:446–451. - PMC - PubMed
    1. Aitken S.J., Anderson C.J., Connor F., Pich O., Sundaram V., Feig C., Rayner T.F., Lukk M., Aitken S., Luft J., Liver Cancer Evolution Consortium Pervasive lesion segregation shapes cancer genome evolution. Nature. 2020;583:265–270. - PMC - PubMed
    1. Alexandrov L.B., Nik-Zainal S., Wedge D.C., Aparicio S.A., Behjati S., Biankin A.V., Bignell G.R., Bolli N., Borg A., Børresen-Dale A.L., Australian Pancreatic Cancer Genome Initiative. ICGC Breast Cancer Consortium. ICGC MMML-Seq Consortium. ICGC PedBrain Signatures of mutational processes in human cancer. Nature. 2013;500:415–421. - PMC - PubMed
    1. Alexandrov L.B., Kim J., Haradhvala N.J., Huang M.N., Tian Ng A.W., Wu Y., Boot A., Covington K.R., Gordenin D.A., Bergstrom E.N., PCAWG Mutational Signatures Working Group. PCAWG Consortium The repertoire of mutational signatures in human cancer. Nature. 2020;578:94–101. - PMC - PubMed
    1. Alizadeh A.A., Aranda V., Bardelli A., Blanpain C., Bock C., Borowski C., Caldas C., Califano A., Doherty M., Elsner M. Toward understanding and exploiting tumor heterogeneity. Nat. Med. 2015;21:846–853. - PMC - PubMed

Publication types