. 2021 Jan-Jun:296:100636.
doi: 10.1016/j.jbc.2021.100636. Epub 2021 Apr 6.

PIKfyve activity is required for lysosomal trafficking of tau aggregates and tau seeding

Affiliations

PIKfyve activity is required for lysosomal trafficking of tau aggregates and tau seeding

Alberto Carpinteiro Soares et al. J Biol Chem. 2021 Jan-Jun.

Abstract

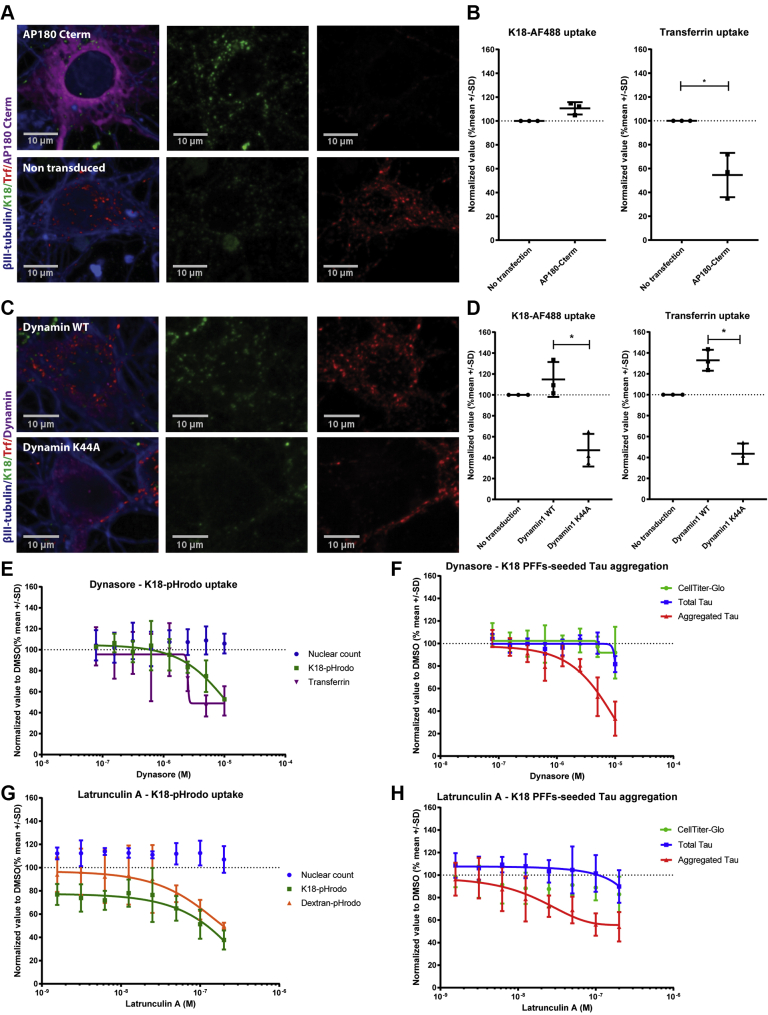
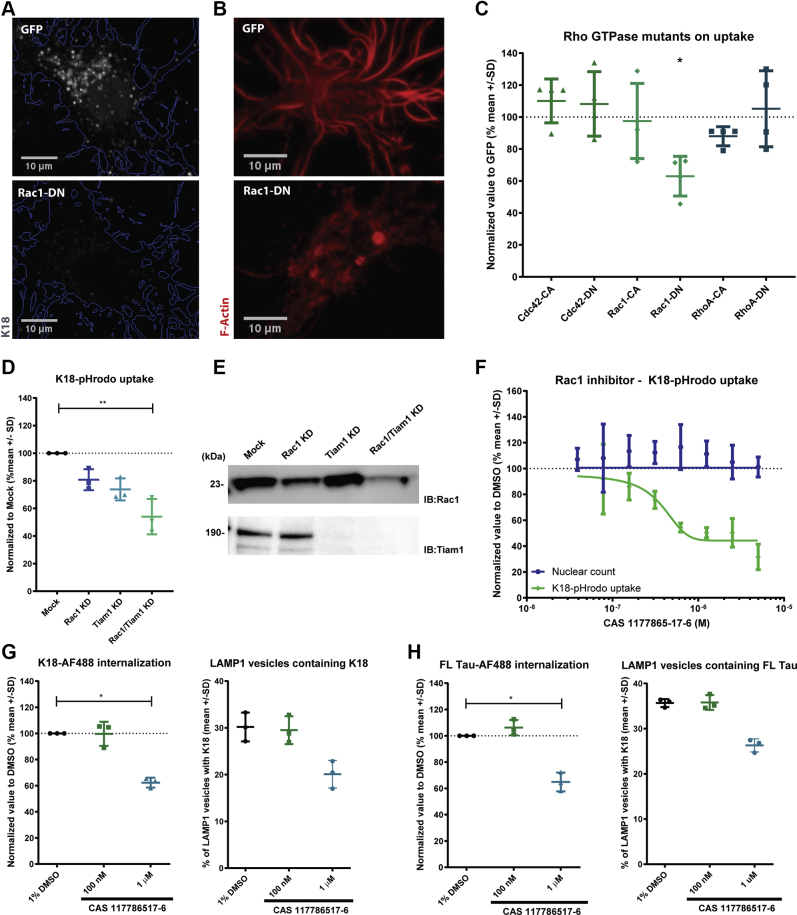
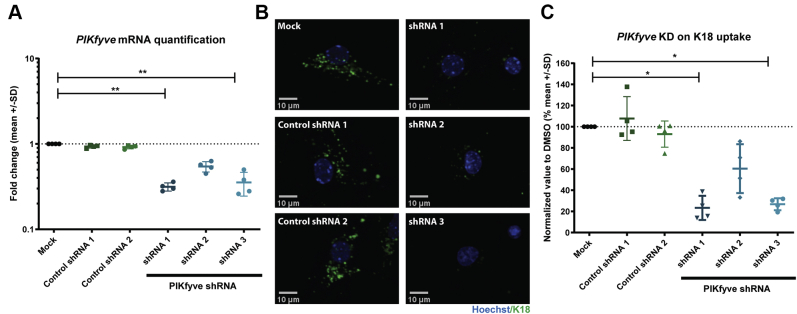
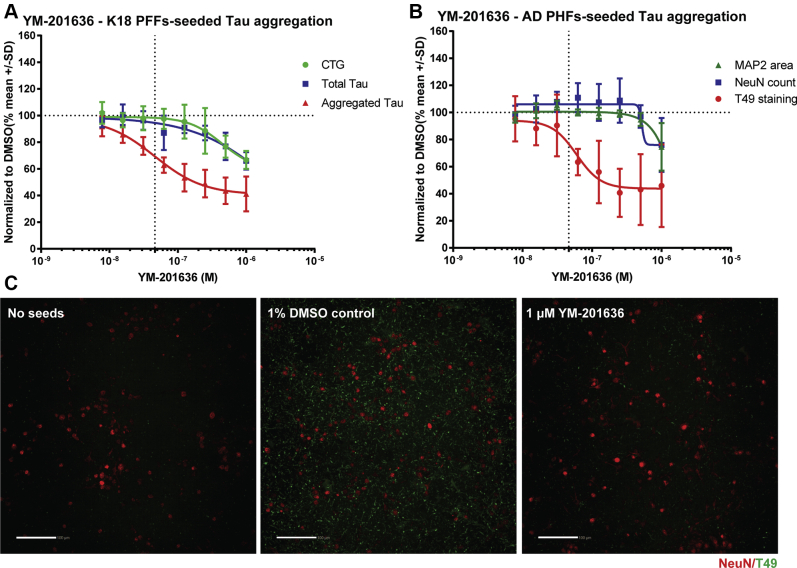
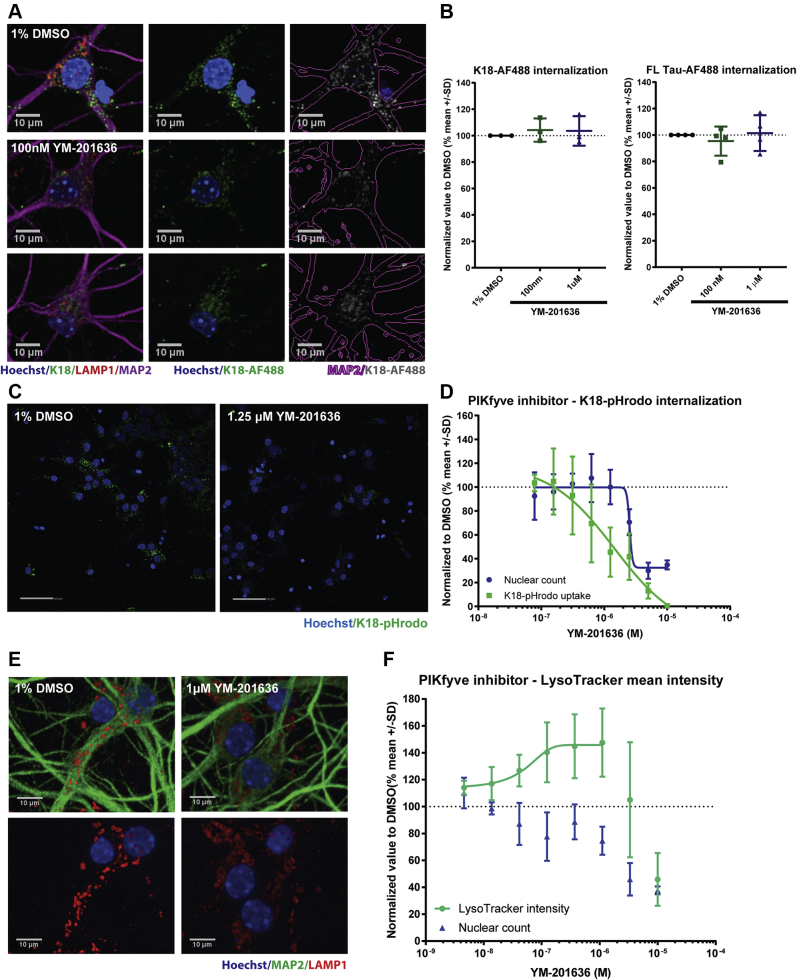
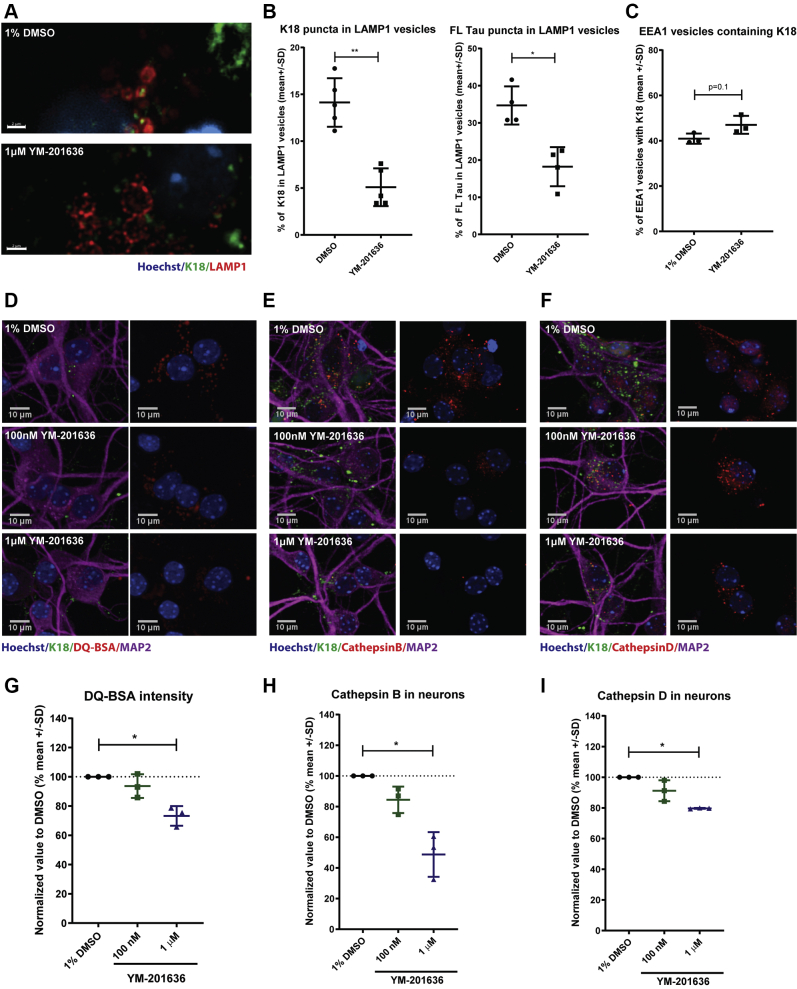
Tauopathies, such as Alzheimer's disease (AD), are neurodegenerative disorders characterized by the deposition of hyperphosphorylated tau aggregates. Proteopathic tau seeds spread through the brain in a temporospatial pattern, indicative of transsynaptic propagation. It is hypothesized that reducing the uptake of tau seeds and subsequent induction of tau aggregation could be a potential approach for abrogating disease progression in AD. Here, we studied to what extent different endosomal routes play a role in the neuronal uptake of preformed tau seeds. Using pharmacological and genetic tools, we identified dynamin-1, actin, and Rac1 as key players. Furthermore, inhibition of PIKfyve, a protein downstream of Rac1, reduced both the trafficking of tau seeds into lysosomes and the induction of tau aggregation. Our work shows that tau aggregates are internalized by a specific endocytic mechanism and that their fate once internalized can be pharmacologically modulated to reduce tau seeding in neurons.

Keywords: Alzheimer's disease; PIKfyve; Rac1; tau seeding; tau uptake; tauopathy.


Conflict of interest statement

Conflict of interest The authors declare that they have no conflicts of interest with the contents of this article.

Figures

Figure 1
Figure 1
Neuronal tau uptake is a clathrin-independent, but dynamin- and actin-dependent process.A and B, representative images of primary hippocampal neurons transfected with an AP180-Cterm construct and treated with 300 nM K18-AF488 and Transferrin-AF568 (Trf) for 30 min before fixation and staining, followed by puncta quantification (n = 3). C and D, representative images of primary hippocampal neurons transfected with Dyn1WT or Dyn1K44A mutant constructs and treated with 300 nM of K18-AF488 and Trf for 30 min before fixation followed by puncta quantification (one-way ANOVA, nonparametric test, ∗ <0.05, Kruskal–Wallis test, p = 0.0036, n = 3). E, imaging quantification of Trf and K18 pHrodo uptake in primary hippocampal cultures after 2-day pretreatment with dynasore in different concentrations (n = 3). F, CellTiter-Glo, total and aggregated tau measured in neurons treated with different concentrations of dynasore and 50 nM K18 PFFs to induce tau aggregation in neurons overexpressing tau:P301L (n = 3). G, quantification of dextran and K18 PFFs uptake in primary hippocampal cultures after 2-day pretreatment with Latrunculin A (n = 3). H, CellTiter-Glo, total and aggregated tau measured in neurons treated with Latrunculin A and 50 nM of K18 PFFs to induce tau aggregation in neurons overexpressing tau:P301L (n = 3).
Figure 2
Figure 2
Neuronal uptake of K18 PFFs requires actin polymerization through Rac1 activation.A, representative images of primary hippocampal neurons transfected with Rac1 dominant negative mutant or GFP as control and treated with 300 nM K18-AF488 for 16 h before fixation and imaging. B, representative images of primary hippocampal neurons cotransfected with Rac1 dominant negative mutant or GFP and LifeAct-RFP for F-actin visualization. C, quantification of K18-AF488 internalization in primary hippocampal cultures transfected with different GTPase mutants (one-way ANOVA, nonparametric test, ∗<0.05 Kruskal–Wallis test, p = 0.041, n = 3). D, imaging quantification of K18 PFFs uptake in hippocampal cultures transduced with LV-shRNAs against Rac1 and/or Tiam1 (one-way ANOVA, nonparametric test, ∗∗p < 0.05 Kruskal–Wallis test, p = 0.0006, n = 3). E, representative western blot analysis for Rac1 and Tiam1 in primary hippocampal cultures transduced with LV-shRNAs against Rac1 and/or Tiam1 for 7 days. F, imaging quantification of the uptake of K18-pHrodo in primary hippocampal cultures treated with the Rac1 inhibitor in dose–response (n = 3). Equal loading of cell lysates was evaluated with a total protein stain. Total protein staining (Cy5) full image can be found in Figure S3B. G, imaging quantification of K18-AF488 inside neurons and percentage of K18-AF488 inside LAMP1 vesicles on neurons treated with 1% DMSO, or 100 nM and 1 μM of YM-201636 (n = 3). H, imaging quantification of FL Tau-AF488 inside neurons and percentage of FL Tau-AF488 inside LAMP1 vesicles on neurons treated with 1% DMSO, or 100 nM and 1 μM of YM-201636 (n = 4).
Figure 3
Figure 3
Pikfyve knockdown reduces K18 PFFs internalization to acidic vesicles.A, quantification of Pikfyve mRNA on sample treated with either control LV-shRNA or LV-shRNAs targeting Pikfyve (n = 4, mean fold change versus control). B, representative images of primary hippocampal cultures treated with either control LV-shRNAs or LV-shRNA against Pikfyve followed by incubation with K18-pHrodo and lysis for mRNA quantification. C, quantification of K18-pHrodo uptake in primary hippocampal cultures treated with different LV-shRNAs. (n = 4).
Figure 4
Figure 4
Pharmacological inhibition of PIKfyve reduces seeding by K18 PFFs and AD PHFs.A, CellTiter-Glo, total and aggregated tau measured in neurons treated with different concentrations of YM-201636 and 50 nM of K18 PFFs to induce tau aggregation in neurons overexpressing tau:P301L (n = 4). B, T49, NeuN, and MAP2 area quantification of neurons treated with different concentrations of YM-201636 and AD PHFs (n = 3). C, representative images of primary hippocampal neurons treated with or without AD PHFs and 1% DMSO or YM-201636 (n = 3, scale bar: 50 μm).
Figure 5
Figure 5
PIKfyve inhibition does not change the uptake of labeled K18 PFFs in neurons.A, representative images of primary hippocampal neurons treated with 1% DMSO, 100 nM or 1 μM YM-201636 before 16 h incubation with K18-AF488 and fixation (n = 3). B, imaging quantification of the number of K18-AF488 and FL Tau-AF488 positive vesicles inside neurons treated with 1% DMSO, 100 nM or 1 μM YM-201636 (n = 3). C, representative images of primary hippocampal neurons treated with either 1% DMSO or YM-201636 before incubation and imaging of K18-pHrodo uptake (scale bar: 50 μm). D, imaging quantification of K18-pHrodo in primary hippocampal neurons treated with the YM-201636 inhibitor in dose–response (n = 4). E, representative images of primary hippocampal neurons treated either with 1% DMSO or YM-201636 before fixation and staining for LAMP1. F, image quantification of the LysoTracker positive vesicles intensity after treatment with different concentrations of YM-201636 (n = 3).
Figure 6
Figure 6
PIKfyve inhibition impairs the transport of K18 PFFs into lysosomes. A, representative images of primary hippocampal neurons treated with 1% DMSO or 1 μM YM-201636 before 16 h incubation with K18-AF488 and fixation and staining for LAMP1 (scale bar: 2 μm). B, image quantification of primary hippocampal neurons treated with 1% DMSO or 1 μM YM-201636 before a 16 h treatment with K18-AF488 or FL Tau-AF488 and fixation and staining for LAMP1 (Mann–Whitney test, ∗∗p < 0.05, n = 5 for LAMP1). C, image quantification of primary hippocampal neurons treated with 1% DMSO or 1 μM YM-201636 before 16 h treatment with K18-AF488 and fixation and staining for EEA1. D, representative images of mouse primary cultures treated with 1% DMSO, 100 nM or 1 μM YM-201636 before incubation with 20 μg/ml DQ-BSA (n = 3). E and F, representative images of mouse primary cultures treated with 1% DMSO, 100 nM or 1 μM YM-201636 and stained for cathepsin B and D respectively. GI, imaging quantification of DQ-BSA puncta, cathepsin B and D inside neurons respectively (one-way ANOVA, nonparametric test, ∗<0.05, n = 3).

References

    1. Goedert M., Wischik C.M., Crowther R. a, Walker J.E., Klug a. Cloning and sequencing of the cDNA encoding a core protein of the paired helical filament of Alzheimer disease: Identification as the microtubule-associated protein tau. Proc. Natl. Acad. Sci. U. S. A. 1988;85:4051–4055. - PMC - PubMed
    1. Kosik K.S., Joachim C.L., Selkoe D.J. Microtubule-associated protein tau (tau) is a major antigenic component of paired helical filaments in Alzheimer disease. Proc. Natl. Acad. Sci. U. S. A. 1986;83:4044–4048. - PMC - PubMed
    1. Arriagada P.V., Growdon J.H., Hedley-Whyte E.T., Hyman B.T. Neurofibrillary tangles but not senile plaques parallel duration and severity of Alzheimer’s disease. Neurology. 1992;42:631–639. - PubMed
    1. Braak H., Braak E. Neuropathological stageing of Alzheimer-related changes. Acta Neuropathol. 1991;82:239–259. - PubMed
    1. Braak H., Del Tredici K. The preclinical phase of the pathological process underlying sporadic Alzheimer’s disease. Brain. 2015;138:2814–2833. - PubMed

Publication types