. 2021 Jun:152:112178.
doi: 10.1016/j.fct.2021.112178. Epub 2021 Apr 5.

Environmentally relevant developmental methylmercury exposures alter neuronal differentiation in a human-induced pluripotent stem cell model

Affiliations

Environmentally relevant developmental methylmercury exposures alter neuronal differentiation in a human-induced pluripotent stem cell model

Lisa M Prince et al. Food Chem Toxicol. 2021 Jun.

Abstract

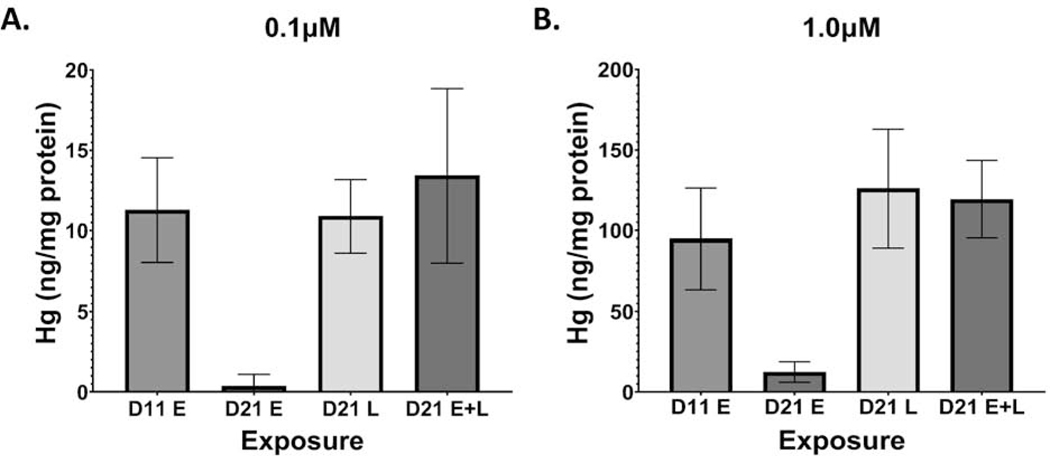
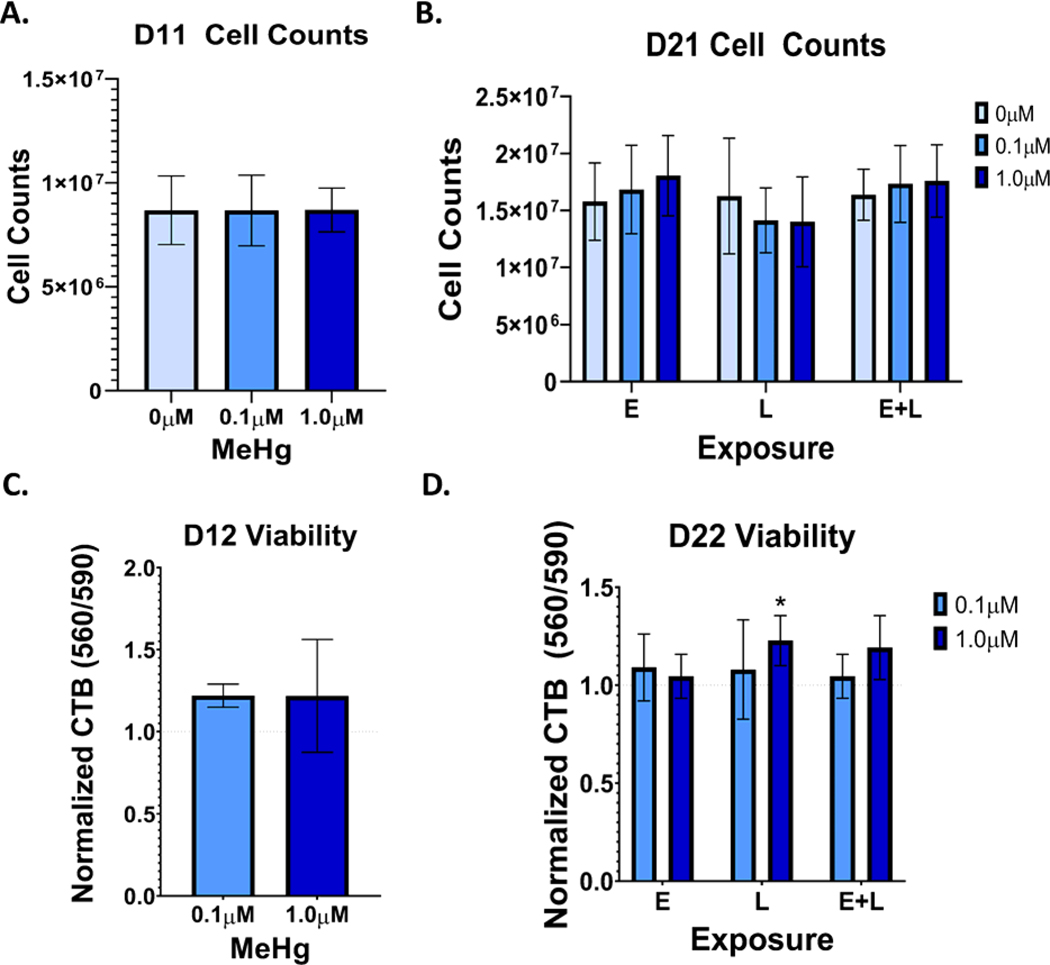
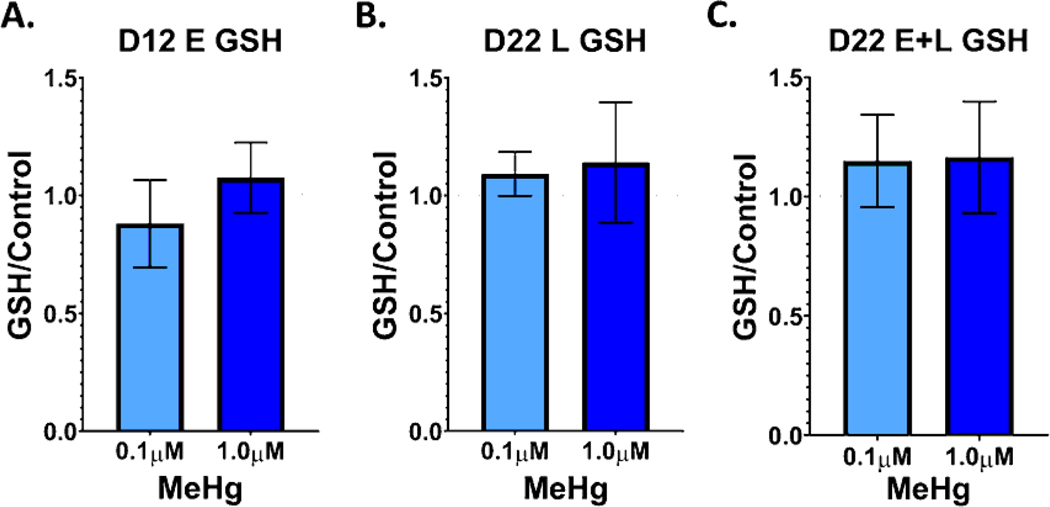
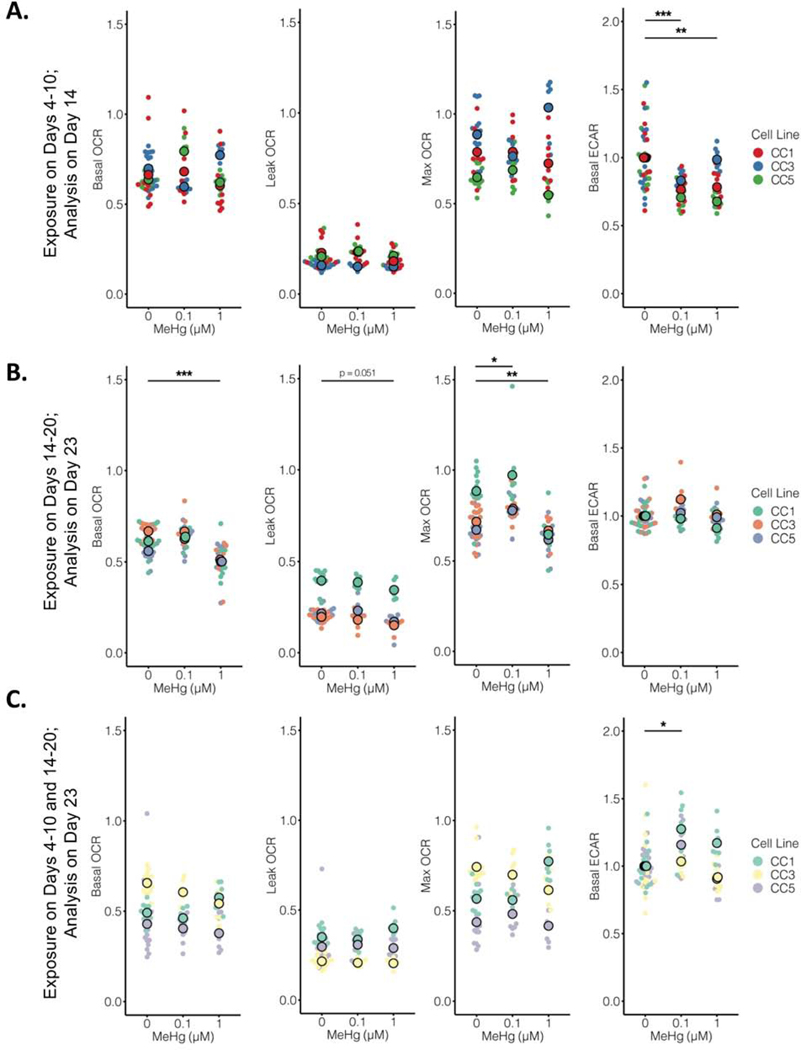
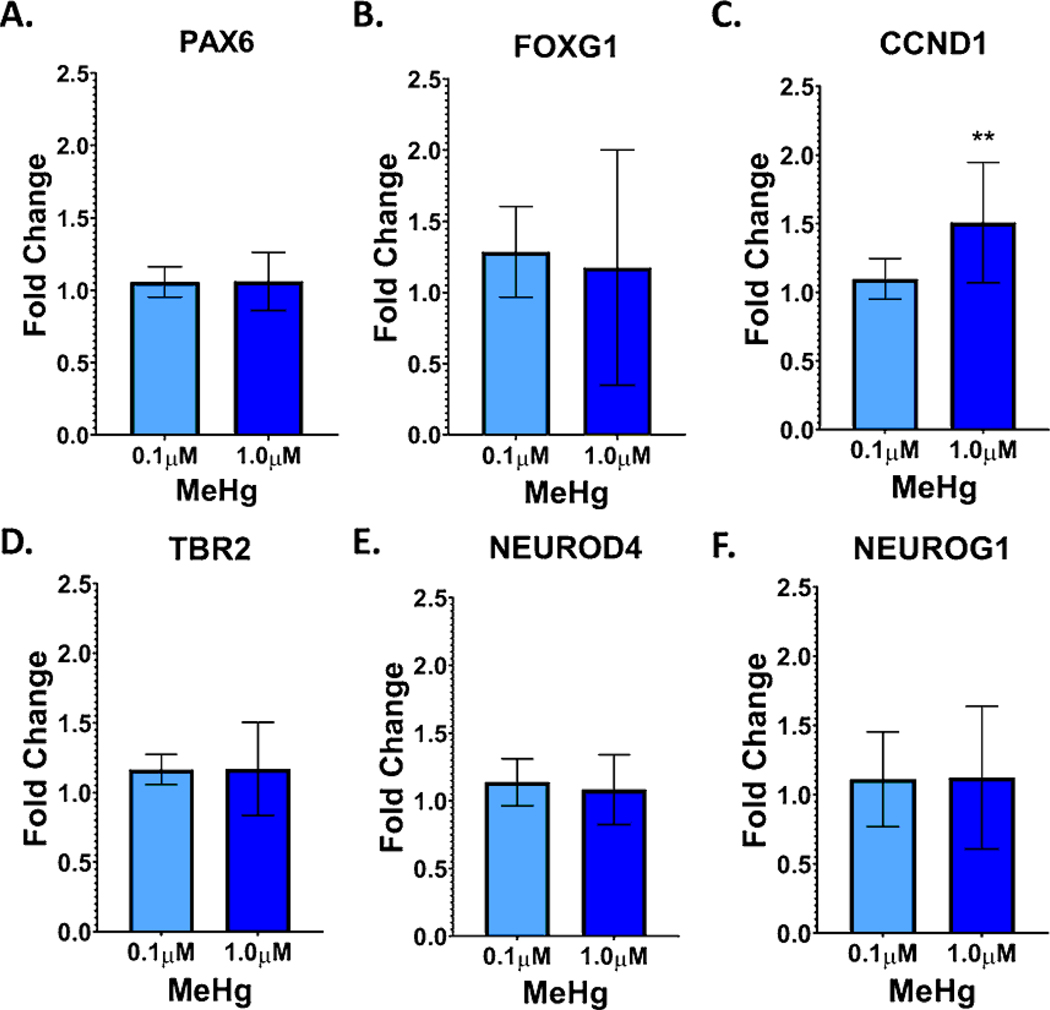
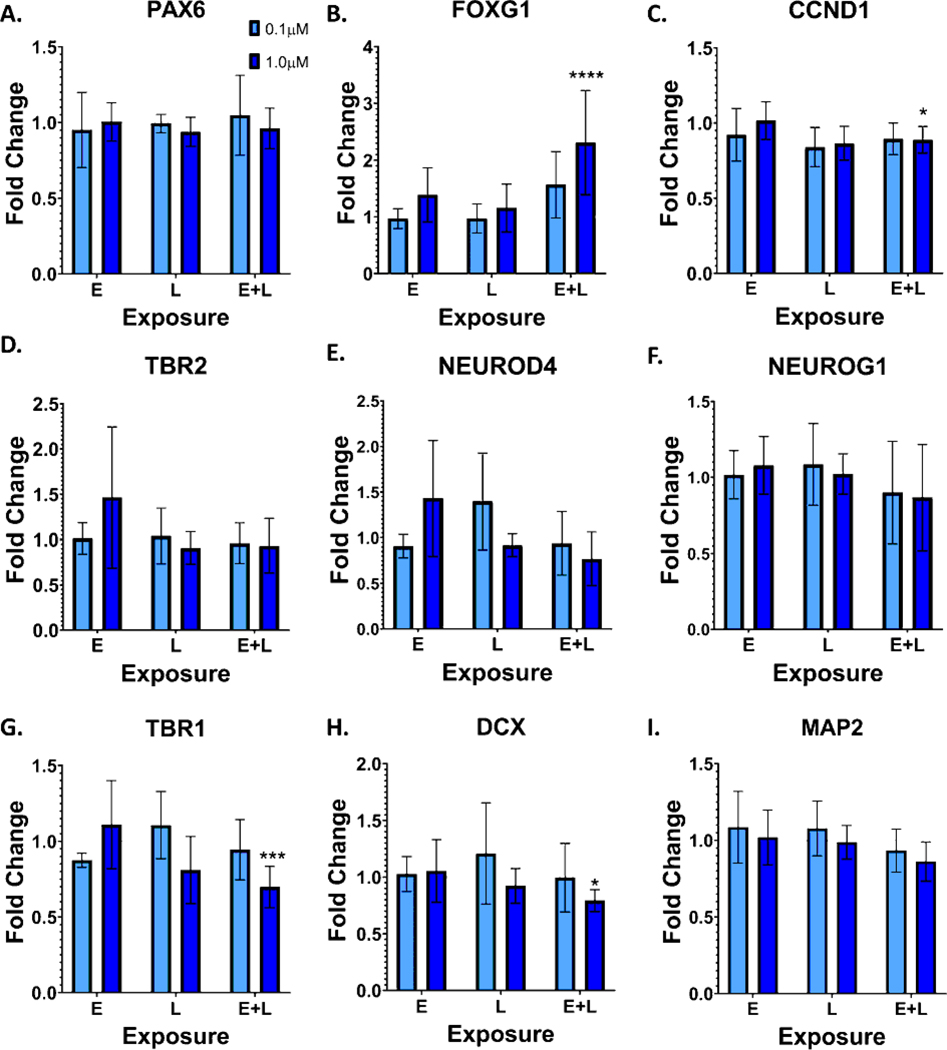
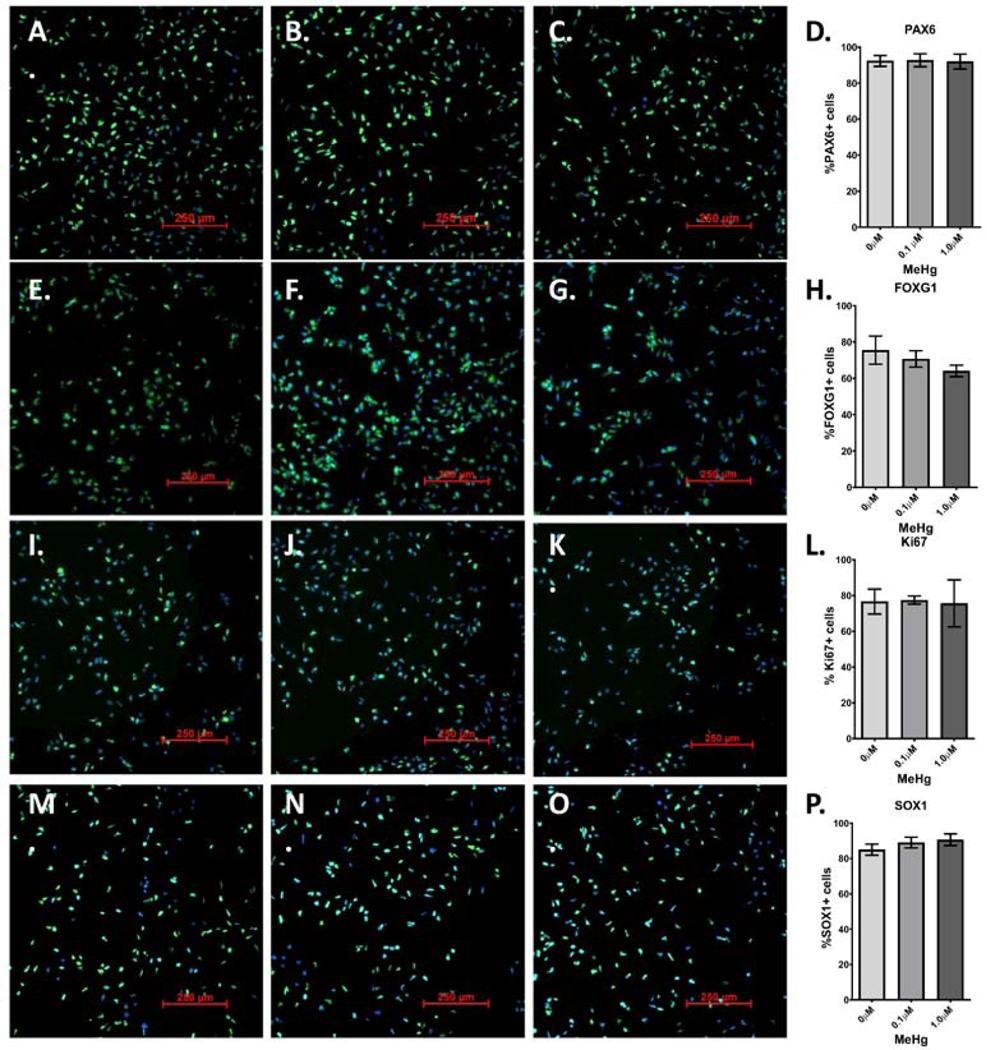
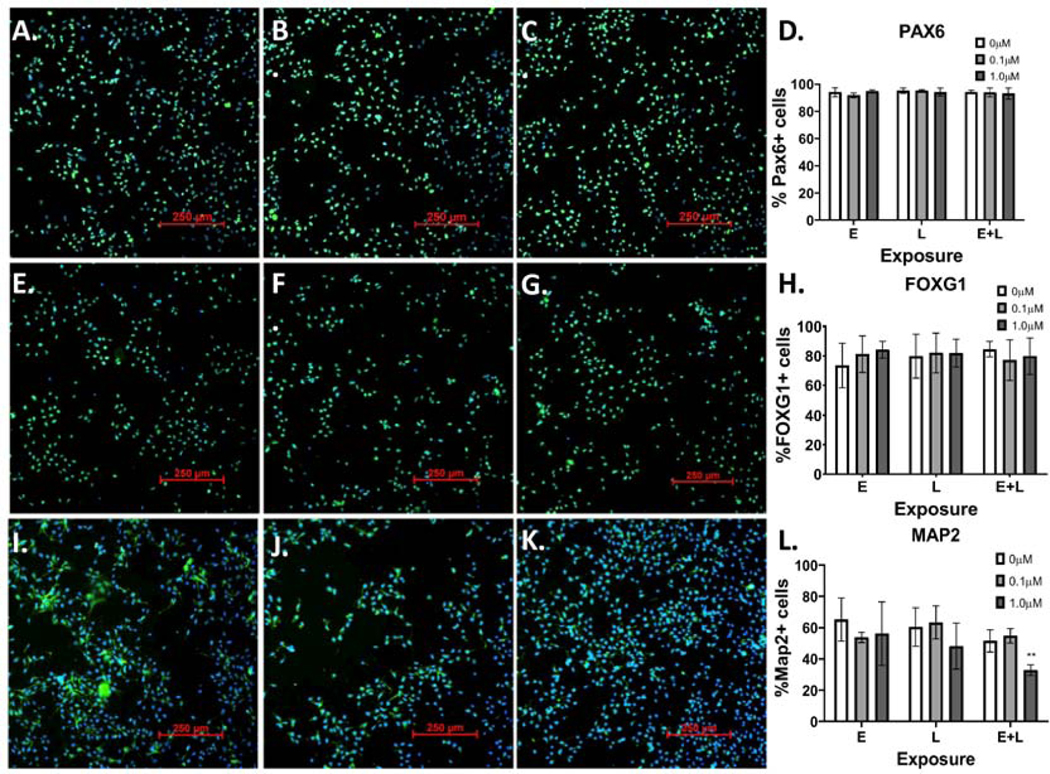
Developmental methylmercury (MeHg) exposure selectively targets the cerebral and cerebellar cortices, as seen by disruption of cytoarchitecture and glutamatergic (GLUergic) neuron hypoplasia. To begin to understand the mechanisms of this loss of GLUergic neurons, we aimed to develop a model of developmental MeHg neurotoxicity in human-induced pluripotent stem cells differentiating into cortical GLUergic neurons. Three dosing paradigms at 0.1 μM and 1.0 μM MeHg, which span different stages of neurodevelopment and reflect toxicologically relevant accumulation levels seen in human studies and mammalian models, were established. With these exposure paradigms, no changes were seen in commonly studied endpoints of MeHg toxicity, including viability, proliferation, and glutathione levels. However, MeHg exposure induced changes in mitochondrial respiration and glycolysis and in markers of neuronal differentiation. Our novel data suggests that GLUergic neuron hypoplasia seen with MeHg toxicity may be due to the partial inhibition of neuronal differentiation, given the increased expression of the early dorsal forebrain marker FOXG1 and corresponding decrease in expression on neuronal markers MAP2 and DCX and the deep layer cortical neuronal marker TBR1. Future studies should examine the persistent and latent functional effects of this MeHg-induced disruption of neuronal differentiation as well as transcriptomic and metabolomic alterations that may mediate MeHg toxicity.

Keywords: Developmental neurotoxicity; Glutamatergic neurons; Human-induced pluripotent stem cells; Methylmercury.


Conflict of interest statement

Declaration of interests

The authors declare that they have no known competing financial interests or personal relationships that could have appeared to influence the work reported in this paper.

Figures

Figure 1.
Figure 1.
Hg uptake at days 11 and 21 of differentiation, 24 hours after MeHg exposure paradigms. Total Hg levels were assessed by DMA80 at D11 and D21 for the A.) 0.1μM and B.) 1.0 μM exposure paradigms. All values are expressed as mean ± SD (n=7–8)
Figure 2.
Figure 2.
The MeHg exposure paradigms do not significantly induce cell loss in differentiating cortical neurons. A). Cell counts at D11 of cells exposed to either 0.1 or 1.0μM from days 4 to 9 of differentiation (E exposure). B.) Cell counts at D21 of cells exposed to either 0.1 or 1.0μM during E, L, and E + L stages of differentiation. C.) Cell Titer Blue fluorescence (560/590), normalized to control, at D12 of cells exposed to either 0.1 or 1.0μM from D4 to 10 of differentiation (E exposure). D.) Cell Titer Blue fluorescence (560/590), normalized to control, at D22 of cells exposed to either 0.1 or 1.0 μM from during E, L, and E + L stages of differentiation. A two-way analysis indicated a MeHg-dependent increase in CTB fluorescence: Finteraction(4, 36) = 1.030, p=0.4049; Fexposure paradigm(2, 36) = 0.6890, p=0.5086; FMeHg(2, 36) = 5.027, p=0.019. *p=0.0284 with Tukey’s multiple comparison’s test. All values are expressed as mean ± SD (n=5).
Figure 3.
Figure 3.
MeHg does not significantly alter cell proliferation in this model. Control normalized Cell Titer Blue signals of A.) E exposed cells at D12 and D13 (n=6) B.), D22 and 23 cells, L exposed (n=5) C.) and D22 and D23 cells, E+L exposed (n=4). Two-way repeated measures ANOVA with Sidak’s multiple comparisons test indicated no significant differences between exposure groups. All values are expressed as mean ± SD.
Figure 4.
Figure 4.
No significant changes to total glutathione levels were seen with any of the MeHg exposure paradigms. Total glutathione per well was measured and normalized to 0μM control, at A). D12, 48 hours after the E exposure (n=6), B.) D22, 48 hours after the L exposure (n=5), and C.) D22, 48 hours after the E + L exposure (n=4). One-way ANOVA with Tukey’s multiple comparisons test indicated no significant differences between exposure groups. All values are expressed as mean ± SD.
Figure 5.
Figure 5.
MeHg exposure paradigms differentially alter OCR and ECAR of developing neuroprogenitors. Oxygen consumption rate (OCR) and extracellular acidification rate (ECAR) were measured using the MitoStress test. A.) Basal, leak, and max OCR, and basal ECAR were measured 96 hours (D14) after the E exposure (n=8–16 across groups). A two-way permutation test detected a significant effect of MeHg exposure on basal ECAR (p < 0.000). A Dunn post-hoc test with Benjamini-Yekutieli correction for multiple comparisons revealed a significant reduction in basal ECAR at 0.1μM (*** p< 0.0000) and 1μM (** p < 0.001). B.) Basal, leak, and max OCR, and basal ECAR were measured 72 hours (D23) after the L exposure (n=8–16 across groups). A two-way permutation test detected a significant effect of MeHg exposure on basal OCR (p < 0.000), leak OCR (p<0.000), max OCR (p<0.000), and basal ECAR (p<0.04). A Dunn post-hoc test with Benjamini-Yekutieli correction for multiple comparisons revealed a significant reduction in basal ECAR at 1μM (*** p < 0.0000), a significant increase in max OCR at 0.1μM (* p = 0.014), and a significant decrease in max OCR at 1μM (** p = 0.002). C.) Basal, leak, and max OCR, and basal ECAR were measured 72 hours (D23) after the E+L exposure (n=8–16 across groups). A two-way permutation test detected a significant effect of MeHg exposure on basal ECAR (p < 0.000). A Dunn post-hoc test with Benjamini-Yekutieli correction for multiple comparisons revealed a significant increase in basal ECAR at 0.1μM (* p =0.003). For all plots, cell line (CC1, CC3, and CC5) group means are overlaid on individual well values.
Figure 6.
Figure 6.
MeHg exposure increases mRNA expression of the radial glial and intermediate progenitor marker CCND1. Marker expression was assessed with qPCR at D11, 24 hours after the E exposure ended for the following markers: A.) PAX6, B.) FOXG1, C.) CCND1, one-way ANOVA with Tukey’s multiple comparisons tests revealed a significant effect of MeHg exposure versus the vehicle control, F (2,19) = 7.491, p= 0.0040; *p=0.0043. D.) TBR2, E.) NEUROD4, and F.) NEUROG1. All values are expressed as mean ± SD (n=6–8) fold-change relative to the vehicle control levels for each replicate. Vehicle levels are thus defined as 1.0, shown as the dotted line at 1.0.
Figure 7.
Figure 7.
MeHg exposure alters mRNA expression of a subset of intermediate progenitor cell and neuronal markers. Marker expression was assessed with qPCR at D21 for the following markers: A.) PAX6, B.) FOXG1, two-way ANOVA with Tukey’s multiple comparisons showed a significant effect of MeHg and exposure paradigm versus vehicle controls, Finteraction (4, 39) = 2.578, p=0.0523; Fexposure paradigm (2, 39) = 7.140, p=0.0023; FMeHg (2, 39) = 7.096, p=0.0024; ****p<0.0001, C.) CCND1, Two-way ANOVA with Tukey’s multiple comparisons showed a significant effect of MeHg versus vehicle controls: Finteraction (4, 39) = 1.167, p=0.3401; Fexposure paradigm (2, 39) = 2.356, p=0.1082; FMeHg (2, 39) = 5.993, p=0.0054; *p=0.042, D.) TBR2, E.) NEUROD4, F.) NEUROG1, G.) TBR1, two-way ANOVA with Tukey’s multiple comparisons showed a significant interaction between MeHg and exposure paradigm versus vehicle controls, Finteraction (4, 39) = 4.558, p=0.0041; Fexposure paradigm (2, 39) = 2.738, p=0.0771; FMeHg (2, 39) = 3.212, p=0.0511; ***p=0.0005 H.) DCX, *p=0.0481, two-way ANOVA with Tukey’s multiple comparisons for MeHg versus vehicle controls and I.) MAP2. All values are expressed as mean ± SD (n=3–8) fold-change relative to the vehicle control levels for each replicate. Vehicle levels are thus defined as 1.0, shown as the dotted line at 1.0.
Figure 8.
Figure 8.
MeHg “E” exposure does not affect the percentage of cells expressing radial glial and intermediate progenitor cell markers. 48 hours after “E” exposure to 0μM (A., E., I, M.), 0.1μM (B., F., J., N.) or 1.0μM (C, G. K., D., O.), cells were immunostained with antibodies for: A-C.) PAX6, E-G.), FOXG1, I-K.) Ki67, and M-D.) SOX1. Percentage of cells expressing each marker-D.) PAX6, H.), FOXG1, L.) Ki67, and P.) SOX1 -was quantified. One-way ANOVA with Tukey’s multiple comparisons revealed no significant differences. All values are expressed as mean ± SD (n=3)
Figure 9.
Figure 9.
MeHg “E+L” exposure reduces the percentage of cells expressing MAP2. 48 hours after “E+L” exposure to 0μM (A., E., I.), 0.1μM (B., F., J.) or 1.0μM (C, G. K.), cells were immunostained with antibodies for: A-C.) PAX6, E-G.), FOXG1, I-K.) MAP2. Percentage of cells expressing each marker- D.) PAX6, H.) FOXG1, L.) Map2; two-way ANOVA with Tukey’s multiple comparisons revealed a significant effect of MeHg exposure: Finteraction (4, 12) = 2.929, p=0.0665; Fexposure paradigm (2, 6) = 1.301 p=0.3395; FMeHg (2, 12) = 10.91, p=0.002; *p=0.0116- was quantified for all exposure groups. All values are expressed as mean ± SD (n=3).

References

    1. Amin-Zaki L, Majeed MA, Elhassani SB, Clarkson TW, Greenwood MR, & Doherty RA (1979). Prenatal methylmercury poisoning. Clinical observations over five years. Am J Dis Child, 133(2), 172–177. - PubMed
    1. Aschner M. (2012). Considerations on methylmercury (MeHg) treatments in in vitro studies. Neurotoxicology, 33(3), 512–513. doi:10.1016/j.neuro.2012.05.002 - DOI - PMC - PubMed
    1. Aschner M, Ceccatelli S, Daneshian M, Fritsche E, Hasiwa N, Hartung T, Hogberg HT, Leist M, Li A, Mundi WR, Padilla S, Piersma AH, Bal-Price A, Seiler A, Westerink RH, Zimmer B. and Lein PJ (2017). Reference compounds for alternative test methods to indicate developmental neurotoxicity (DNT) potential of chemicals: example lists and criteria for their selection and use. ALTEX, 34(1), 49–74. doi:10.14573/altex.1604201 - DOI - PMC - PubMed
    1. Aschner M, Du YL, Gannon M, & Kimelberg HK (1993). Methylmercury-induced alterations in excitatory amino acid transport in rat primary astrocyte cultures. Brain Research, 602(2), 181–186. doi:10.1016/0006-8993(93)90680-l - DOI - PubMed
    1. Aschner M, & Syversen T. (2005). Methylmercury: recent advances in the understanding of its neurotoxicity. Therapeutic Drug Monitoring, 27(3), 278–283. doi:10.1097/01.ftd.0000160275.85450.32 - DOI - PMC - PubMed

MeSH terms

LinkOut - more resources