The perils of using predicted values in place of observed covariates: an example of predicted values of body composition and mortality risk
- PMID: 33831946
- PMCID: PMC8326037
- DOI: 10.1093/ajcn/nqab074
The perils of using predicted values in place of observed covariates: an example of predicted values of body composition and mortality risk
Abstract
Background: Several studies have assessed the relation of body composition to health outcomes by using values of fat and lean mass that were not measured but instead were predicted from anthropometric variables such as weight and height. Little research has been done on how substituting predicted values for measured covariates might affect analytic results.
Objectives: We aimed to explore statistical issues causing bias in analytical studies that use predicted rather than measured values of body composition.
Methods: We used data from 8014 adults ≥40 y old included in the 1999-2006 US NHANES. We evaluated the relations of predicted total body fat (TF) and predicted total body lean mass (TLM) with all-cause mortality. We then repeated the evaluation using measured body composition variables from DXA. Quintiles and restricted cubic splines allowed flexible modeling of the HRs in unadjusted and multivariable-adjusted Cox regression models.
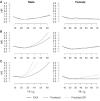
Results: The patterns of associations between body composition and all-cause mortality depended on whether body composition was defined using predicted values or DXA measurements. The largest differences were observed in multivariable-adjusted models which mutually adjusted for both TF and TLM. For instance, compared with analyses based on DXA measurements, analyses using predicted values for males overestimated the HRs for TF in splines and in quintiles [HRs (95% CIs) for fourth and fifth quintiles compared with first quintile, DXA: 1.22 (0.88, 1.70) and 1.46 (0.99, 2.14); predicted: 1.86 (1.29, 2.67) and 3.24 (2.02, 5.21)].
Conclusions: It is important for researchers to be aware of the potential pitfalls and limitations inherent in the substitution of predicted values for measured covariates in order to draw proper conclusions from such studies.
Keywords: Berkson error; all-cause mortality; bias; body composition; epidemiology; prediction equations; research methods.
Published by Oxford University Press on behalf of the American Society for Nutrition 2021.
Figures


Comment in
-
The utility of predicted values in place of directly measured body composition.Am J Clin Nutr. 2021 Aug 2;114(2):418-419. doi: 10.1093/ajcn/nqab127. Am J Clin Nutr. 2021. PMID: 33880498 No abstract available.
References
-
- Lee DH, Keum N, Hu FB, Orav EJ, Rimm EB, Willett WC, Giovannucci EL. Comparison of the association of predicted fat mass, body mass index, and other obesity indicators with type 2 diabetes risk: two large prospective studies in US men and women. Eur J Epidemiol. 2018;33(11):1113–23. - PubMed
Publication types
MeSH terms
LinkOut - more resources
Full Text Sources
Other Literature Sources
Miscellaneous

