

Prostate Cancer Detection Using 3-D Shear Wave Elasticity Imaging
- PMID: 33832823
- PMCID: PMC8169635
- DOI: 10.1016/j.ultrasmedbio.2021.02.006
Prostate Cancer Detection Using 3-D Shear Wave Elasticity Imaging
Abstract
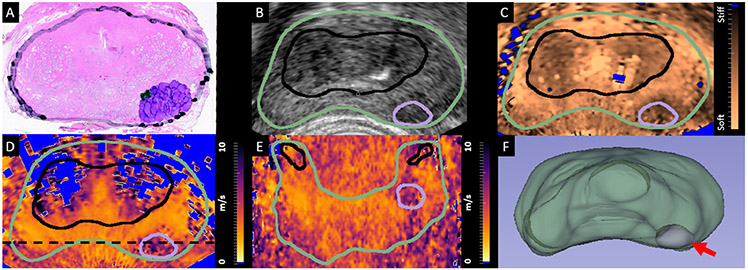
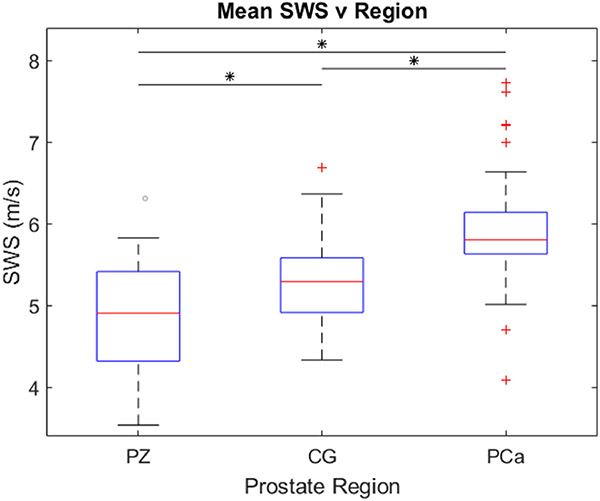
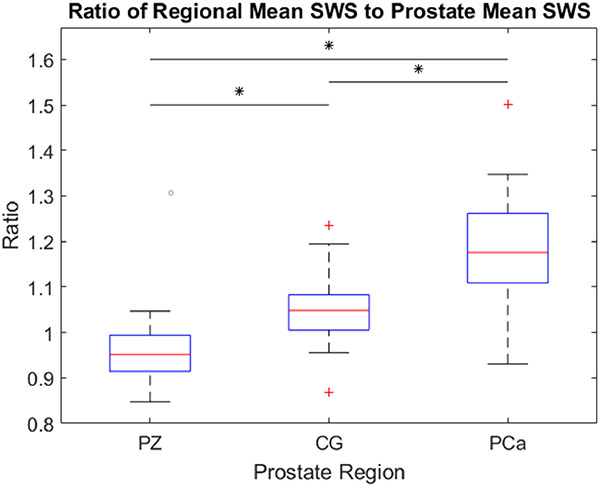
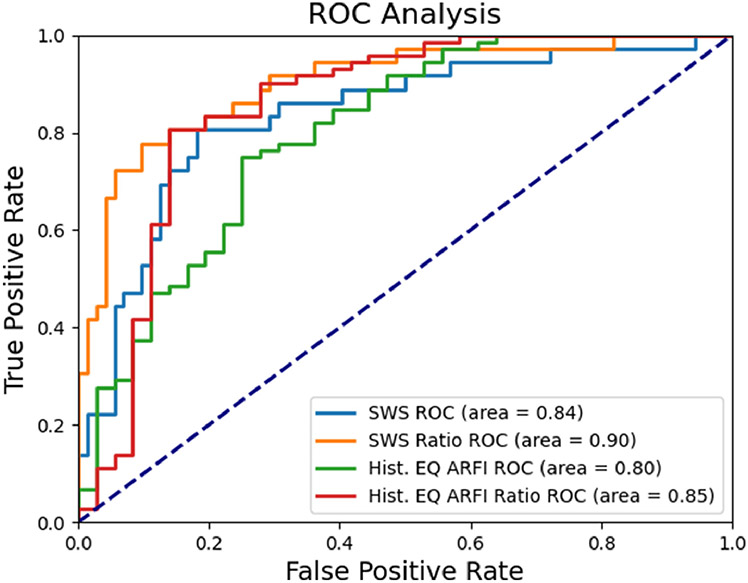
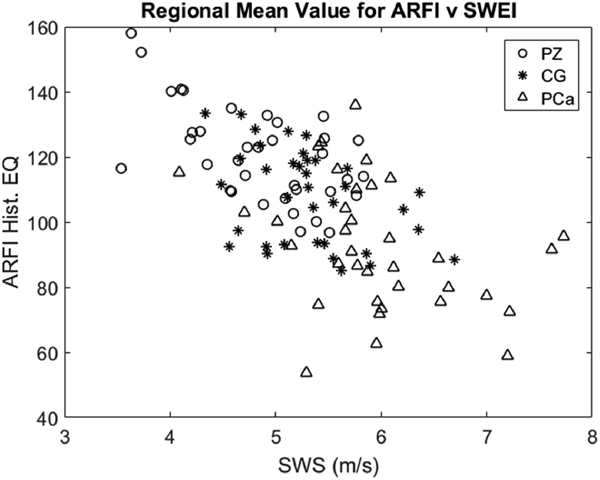
Transrectal ultrasound (TRUS) B-mode imaging provides insufficient sensitivity and specificity for prostate cancer (PCa) targeting when used for biopsy guidance. Shear wave elasticity imaging (SWEI) is an elasticity imaging technique that has been commercially implemented and is sensitive and specific for PCa. We have developed a SWEI system capable of 3-D data acquisition using a dense acoustic radiation force (ARF) push approach that leads to enhanced shear wave signal-to-noise ratio compared with that of the commercially available SWEI systems and facilitates screening of the entire gland before biopsy. Additionally, we imaged and assessed 36 patients undergoing radical prostatectomy using 3-D SWEI and determined a shear wave speed threshold separating PCa from healthy prostate tissue with sensitivities and specificities akin to those for multiparametric magnetic resonance imaging fusion biopsy. The approach measured the mean shear wave speed in each prostate region to be 4.8 m/s (Young's modulus E = 69.1 kPa) in the peripheral zone, 5.3 m/s (E = 84.3 kPa) in the central gland and 6.0 m/s (E = 108.0 kPa) for PCa with statistically significant (p < 0.0001) differences among all regions. Three-dimensional SWEI receiver operating characteristic analyses identified a threshold of 5.6 m/s (E = 94.1 kPa) to separate PCa from healthy tissue with a sensitivity, specificity, positive predictive value (PPV), negative predictive value (NPV) and area under the curve (AUC) of 81%, 82%, 69%, 89% and 0.84, respectively. Additionally, a shear wave speed ratio was assessed to normalize for tissue compression and patient variability, which yielded a threshold of 1.11 to separate PCa from healthy prostate tissue and was accompanied by a substantial increase in specificity, PPV and AUC, where the sensitivity, specificity, PPV, NPV and AUC were 75%, 90%, 79%, 88% and 0.90, respectively. This work illustrates the feasibility of using 3-D SWEI data to detect and localize PCa and demonstrates the benefits of normalizing for applied compression during data acquisition for use in biopsy targeting studies.
Keywords: Acoustic radiation force impulse imaging; Elasticity imaging; Prostate cancer; Shear wave elasticity imaging.
Copyright © 2021 World Federation for Ultrasound in Medicine & Biology. Published by Elsevier Inc. All rights reserved.
Conflict of interest statement
Conflict of interest disclosure K.R.N. and M.L.P. have intellectual property related to radiation force-based imaging technologies that has been licensed to Siemens, Samsung and MicroElastic Ultrasound Systems.
Figures
Similar articles
-
Characterizing stiffness of human prostates using acoustic radiation force.Ultrason Imaging. 2010 Oct;32(4):201-13. doi: 10.1177/016173461003200401. Ultrason Imaging. 2010. PMID: 21213566 Free PMC article.
-
Diagnostic Value of Transrectal Shear Wave Elastography for Prostate Cancer Detection in Peripheral Zone: Comparison with Magnetic Resonance Imaging.J Endourol. 2020 May;34(5):558-566. doi: 10.1089/end.2019.0902. Epub 2020 Apr 21. J Endourol. 2020. PMID: 32164448
-
Multiparametric Ultrasound for Targeting Prostate Cancer: Combining ARFI, SWEI, QUS and B-Mode.Ultrasound Med Biol. 2020 Dec;46(12):3426-3439. doi: 10.1016/j.ultrasmedbio.2020.08.022. Epub 2020 Sep 28. Ultrasound Med Biol. 2020. PMID: 32988673 Free PMC article.
-
Multiparametric MRI in detection and staging of prostate cancer.Dan Med J. 2017 Feb;64(2):B5327. Dan Med J. 2017. PMID: 28157066 Review.
-
Value of shear wave elastography for diagnosis of primary prostate cancer: a systematic review and meta-analysis.Med Ultrason. 2019 Nov 24;21(4):382-388. doi: 10.11152/mu-2051. Med Ultrason. 2019. PMID: 31765445
Cited by
-
Ex Vivo Evaluation of Mechanical Anisotropic Tissues with High-Frequency Ultrasound Shear Wave Elastography.Sensors (Basel). 2022 Jan 27;22(3):978. doi: 10.3390/s22030978. Sensors (Basel). 2022. PMID: 35161728 Free PMC article.
-
Developments in Ultrasound-Based Imaging for Prostate Cancer Detection.Prostate. 2025 Jun;85(9):823-832. doi: 10.1002/pros.24893. Epub 2025 Mar 28. Prostate. 2025. PMID: 40152157 Free PMC article. Review.
-
The Performance of Different Parametric Ultrasounds in Prostate Cancer Diagnosis: Correlation with Radical Prostatectomy Specimens.Cancers (Basel). 2024 Apr 15;16(8):1502. doi: 10.3390/cancers16081502. Cancers (Basel). 2024. PMID: 38672584 Free PMC article. Review.
-
Amplitude-Modulation Frequency Optimization for Enhancing Harmonic Motion Imaging Performance of Breast Tumors in the Clinic.Ultrasound Med Biol. 2025 Jan;51(1):169-179. doi: 10.1016/j.ultrasmedbio.2024.09.021. Epub 2024 Oct 19. Ultrasound Med Biol. 2025. PMID: 39428259
-
Multiparametric Ultrasound Imaging of Prostate Cancer Using Deep Neural Networks.Ultrasound Med Biol. 2024 Nov;50(11):1716-1723. doi: 10.1016/j.ultrasmedbio.2024.07.012. Epub 2024 Aug 22. Ultrasound Med Biol. 2024. PMID: 39174376
References
-
- Ahmed HU, El-Shater Bosaily A, Brown LC, Gabe R, Kaplan R, Parmar MK, Collaco-Moraes Y, Ward K, Hindley RG, Freeman A, Kirkham AP, Oldroyd R, Parker C, Emberton M. Diagnostic accuracy of multi-parametric MRI and TRUS biopsy in prostate cancer (PROMIS): a paired validating confirmatory study. The Lancet, 2017;389:815–822. - PubMed
-
- Barr RG, Memo R, Schaub CR. Shear wave ultrasound elastography of the prostate: Initial results. Ultrasound Quarterly, 2012;28:13–20. - PubMed
-
- Barr RG, Zhang Z. Effects of Precompression on Elasticity Imaging of the Breast. Journal of Ultrasound in Medicine, 2012;31:895–902. - PubMed
-
- Chan DY, Lipman SL, Palmeri ML, Morris DC, Polascik TJ, Rouze NC, Nightingale KR. Prostate Shear Wave Elastography: Multiresolution Reconstruction Dependence on Push Beam Spacing. In: IEEE International Ultrasonics Symposium, IUS. Vol. 2018-January. IEEE Computer Society, 2018.
-
- Correas J, Tissier A, Khairoune A. Ultrasound elastography of the prostate : State of the art. Diagnostic and Interventional Imaging, 2013;94:551–560. - PubMed
Publication types
MeSH terms
Grants and funding
LinkOut - more resources
Full Text Sources
Other Literature Sources
Medical
