. 2021 Jun;31(6):1082-1096.
doi: 10.1101/gr.260851.120. Epub 2021 Apr 8.

Interpretation of allele-specific chromatin accessibility using cell state-aware deep learning

Affiliations

Interpretation of allele-specific chromatin accessibility using cell state-aware deep learning

Zeynep Kalender Atak et al. Genome Res. 2021 Jun.

Abstract

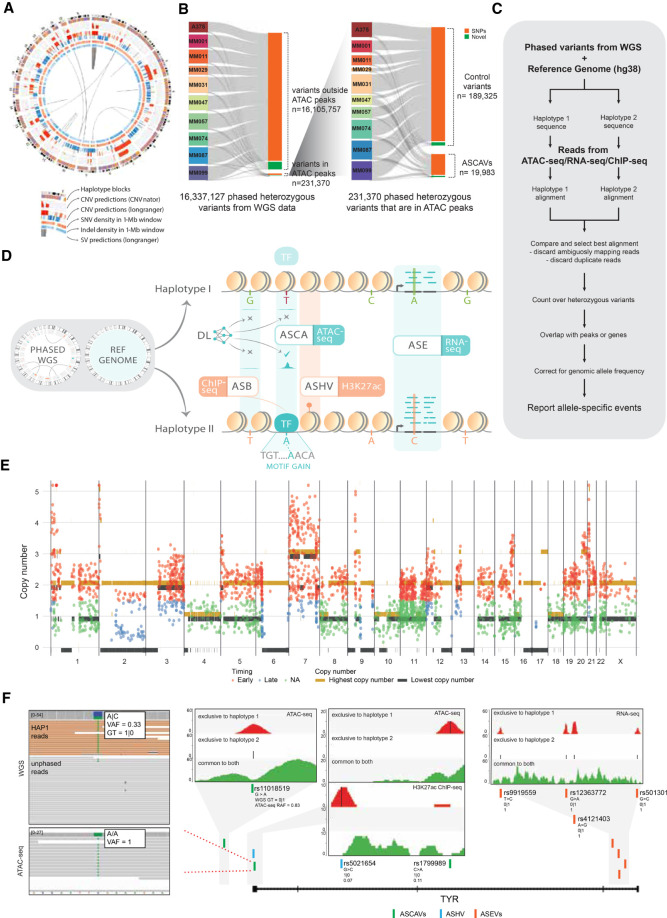
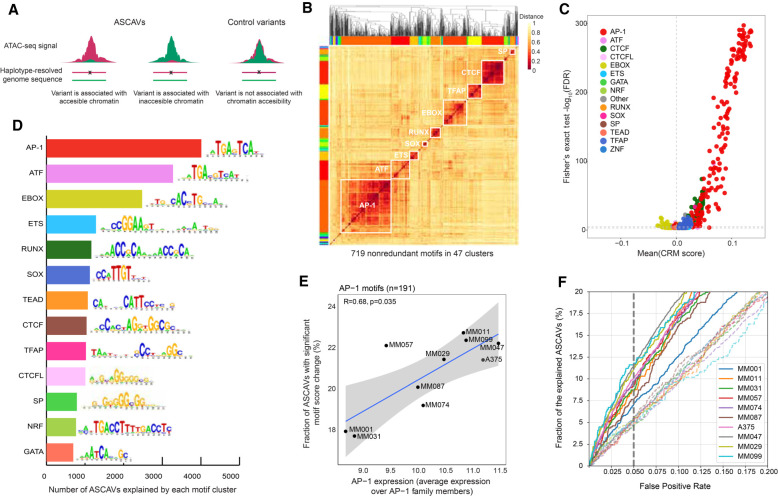
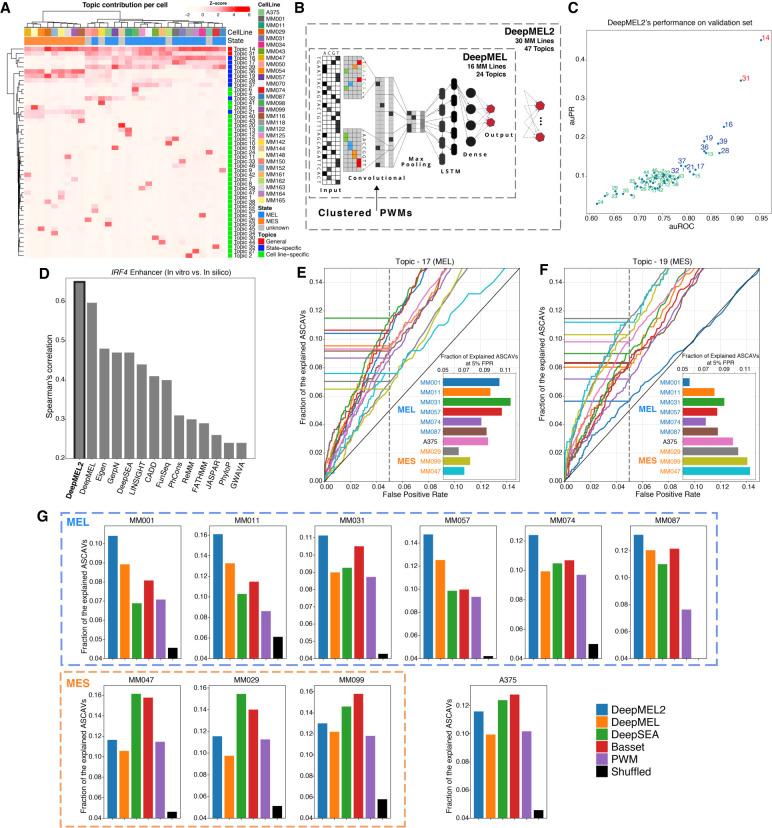
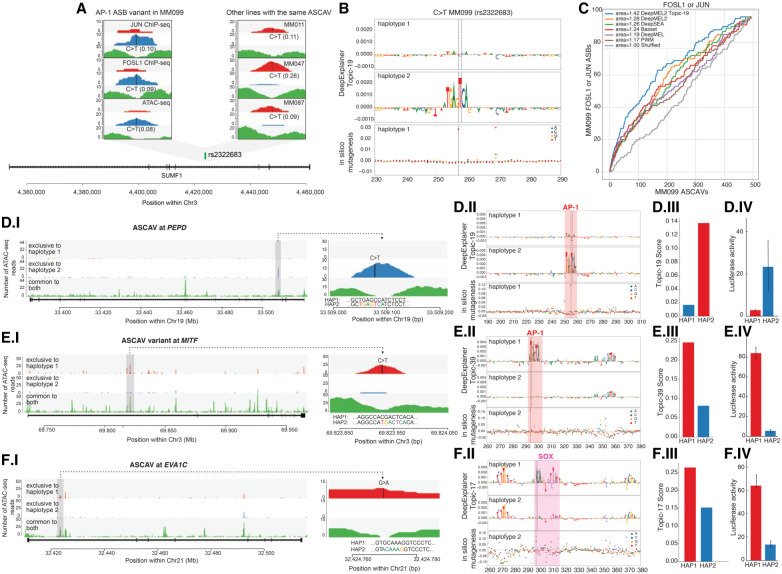
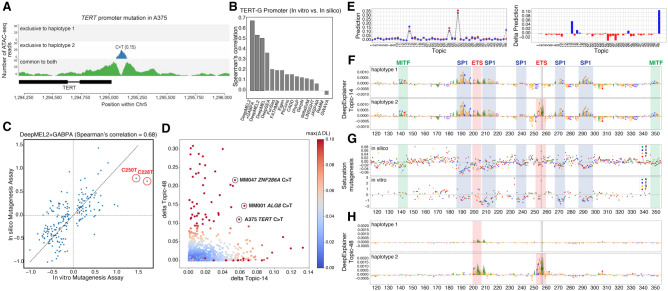
Genomic sequence variation within enhancers and promoters can have a significant impact on the cellular state and phenotype. However, sifting through the millions of candidate variants in a personal genome or a cancer genome, to identify those that impact cis-regulatory function, remains a major challenge. Interpretation of noncoding genome variation benefits from explainable artificial intelligence to predict and interpret the impact of a mutation on gene regulation. Here we generate phased whole genomes with matched chromatin accessibility, histone modifications, and gene expression for 10 melanoma cell lines. We find that training a specialized deep learning model, called DeepMEL2, on melanoma chromatin accessibility data can capture the various regulatory programs of the melanocytic and mesenchymal-like melanoma cell states. This model outperforms motif-based variant scoring, as well as more generic deep learning models. We detect hundreds to thousands of allele-specific chromatin accessibility variants (ASCAVs) in each melanoma genome, of which 15%-20% can be explained by gains or losses of transcription factor binding sites. A considerable fraction of ASCAVs are caused by changes in AP-1 binding, as confirmed by matched ChIP-seq data to identify allele-specific binding of JUN and FOSL1. Finally, by augmenting the DeepMEL2 model with ChIP-seq data for GABPA, the TERT promoter mutation, as well as additional ETS motif gains, can be identified with high confidence. In conclusion, we present a new integrative genomics approach and a deep learning model to identify and interpret functional enhancer mutations with allelic imbalance of chromatin accessibility and gene expression.


Figures

Figure 1.
Figure 1.
Detection of allele-specific chromatin accessibility. (A) Circos plot for sample MM074. Circos plots for the remaining samples are shown in Supplemental Figure S1. (B) Sankey diagram of the number of variants that went through our ASCAV discovery pipeline. (C) Analysis pipeline for identification of allele-specific events from matched phased whole-genome data and functional genomics data (ATAC-seq, RNA-seq, or ChIP-seq). (D) Phased whole-genome sequencing (WGS) is applied to 10 melanoma cell lines and is used together with the reference genome to create personalized diploid genomes. Matched ATAC-seq, RNA-seq, and ChIP-seq data (against H3K27ac mark and transcription factors [TFs]) are used to detect allelic imbalance in chromatin accessibility (ASCA), gene expression (ASE), histone acetylation (ASHV), or allele-specific binding (ASB). By combining a melanoma-specific deep learning model (DeepMEL2) and motif discovery, cis-regulatory variants are predicted. (E) Genome-wide allele-specific copy number is shown for sample MM074. Superposed are the identified ASCAVs in this cell line, of which the mutation copy number is plotted. The color of the ASCAVs indicates whether they can be classified as either early or late. If their copy number context does not allow timing, they are labeled “na.” Allele-specific copy numbers for the remaining samples are shown in Supplemental Figure S4. (F) Concordant allele-specific events are detected around TYR, a gene encoding an enzyme involved in pigmentation. Inset shows the reads from whole-genome and ATAC-seq data for one of the allele-specific SNPs (rs1799989). Whole-genome data indicate a haplotype 1–specific heterozygous SNP (i.e., GT = 1|0) with a variant allele frequency of 0.33, whereas ATAC-seq data indicate the reads are coming from one allele (haplotype 1). There are a further six allele-specific variants in TYR that are either haplotype 1 (i.e., GT = 1|0) or haplotype 2 (i.e., GT = 0|1) specific in the WGS data, yet all the variants manifest a haplotype-specific activity in matched functional genomics data. The inset plots for all these seven variants show ATAC-seq, H3K27ac ChIP-seq, or RNA-seq reads in these loci segregated into haplotypes. Reads mapping exclusively to haplotype 1 are shown at the top (red), whereas the ones mapping exclusively to haplotype 2 are shown in the middle (blue). We can detect exclusive mapping only at the variant locations; hence, the majority of the reads map equally well to both haplotypes and are shown at the bottom (green). Additionally, reference allele fractions (RAFs) are shown for all the variants (corrected RAFs are obtained via BaalChIP for ASCAVs and ASHV).
Figure 2.
Figure 2.
TF motif enrichment on ASCAVs. (A) Selection of ASCAVs and control variants used to assess the association between sequence content and allele-specific accessibility. (B) Heatmap showing the clustering of all 719 ASCAV-enriched motifs into 47 families (color-coded margins). The 13 major families are labeled with their cognate TF on the diagonal. (C) Scatter plot of motifs that are associated with chromatin accessibility. Each dot indicates a motif and is colored based on the motif cluster to which they belong. The x- and y-axes represent the delta cluster-buster motif score and the negative log-scaled FDR corrected P-value, respectively. (D) Bar plot showing the number of ASCAVs explained by each motif cluster. For each family, the consensus motif is shown. (E) Scatter plot of the average expression of AP-1 family members (JUN, JUNB, JUND, FOS, FOSB, FOSL1, FOSL2) and the fraction of ASCAVs that affects an AP-1 binding site. Correlation coefficient (Kendall's tau) and P-value are shown. (F) Fractions of ASCAVs explained at different false-positive rates are shown as curves for each MM line. Dashed lines represent the control for each MM line, where labels of ASCAVs and control variants are shuffled.
Figure 3.
Figure 3.
Cell state–aware DeepMEL2 can interpret ASCAVs. (A) Normalized cisTopic cell-topic heatmap of 30 melanoma cell lines showing general, state-specific, and cell line–specific sets of coaccessible regions. (B) Schematic overview of DeepMEL2 highlighting improvements compared with DeepMEL. (C) Scatter plot of auROC and auPR values shows the performance of DeepMEL2 on each topic. Promoter, state-specific, and cell line–specific topics are represented by red, blue, and green colors, respectively. (D) Performance of DeepMEL2 and other models at predicting variant effects on IRF4 enhancer activity. (E,F) Curves indicate fractions of ASCAVs explained by Topic-17 score (MEL; E) and Topic-19 score (MES; F) at different false-positive rates for each MM line. Bar chart insets show the exact fraction of the explained ASCAVs at 5% false-positive rate. (G) Bar charts showing the fraction of ASCAVs explained at 5% false-positive rate for each MM line using either DeepMEL2, DeepMEL, DeepSEA, Basset, and PWM. The black bar represents the fraction when ASCAVs and control variants are shuffled.
Figure 4.
Figure 4.
Model explanation and experimental validation of three cis-regulatory variants. (A) C > T intronic SNP (rs2322683) in SUMF1 is an ASCAV and AP-1 ASB (JUN and FOSL1 ChIP-seq data sets). (Left) Haplotypes 1 and 2 and unphased reads (color-coded) from this locus in MM099 JUN and FOSL1 ChIP-seq and ATAC-seq reads. (Right) Same locus in three additional MM lines (MM011, MM047, and MM087) in which rs2322683 is also inferred as an ASCAV. WGS genotypes (GT) and BaalChIP allele ratios are shown in parentheses. (B) DeepExplainer plot of the rs2322683 locus (position indicated with dashed lines), where the height of the nucleotides indicates their importance for the final prediction. Scoring using Topic-19 on both haplotypes shows C > T substitution generates an AP-1 binding site. In silico saturation mutagenesis on the reference sequence reveals the effect of each possible variant as a delta Topic-19 prediction score. (C) The curves represent the number of FOSL1 or JUN ASB variants found among the top-n MM099 ASCAVs ranked by the maximum delta prediction score of the different models. (D–F) Each row showcases the following: (I) an ASCAV and its allele-specific accessibility peak, (II) DeepExplainer and in silico mutagenesis results of the two haplotypes, (III) the DeepMEL2 score for both haplotypes, and (IV) the luciferase enhancer-reporter activity for both haplotypes. (D) C > T intronic variant in PEPD is identified as an ASCAV and predicted to generate an AP-1 binding site, with an increase in MES enhancer score. The in silico mutagenesis plot shows that only a single mutation to T at position 269 increases the MES enhancer prediction significantly, and this is exactly the location of the ASCAV. (E) C > T intronic variant in MITF is identified as an ASCAV and predicted to generate an AP-1 binding site. (F) G > A intronic variant in EVA1C is identified as an ASCAV and predicted to generate a SOX10 binding site.
Figure 5.
Figure 5.
Analysis of TERT promoter mutations. (A) TERT promoter hotspot mutation in A375 is detected as an ASCAV as evidenced by ATAC-seq reads segregated into haplotypes (color-coded). In A375, haplotype 2 harbors the mutant allele T (according to WGS data) (see Supplemental Fig. S16), and ATAC-seq evidences exclusive accessibility for this allele. The corrected reference ATAC-seq allele ratio is indicated in parentheses. (B) Bar chart of model variant effect prediction performance on TERT promoter activity assessed by experimental saturation mutagenesis. (C) Scatter plot showing the effect of each variant in the in vitro (x-axis) and in silico (y-axis) mutagenesis of the TERT promoter. The two hotspot gain-of-function mutations are highlighted. (D) Scatter plot of delta Topic-14 score (promoter topic) versus delta Topic-48 score (GABPA topic) of all ASCAVs from 10 MM lines calculated by using the DeepMEL2 + GABPA model. ASCAVs are colored by their maximum delta prediction score. The TERT mutation of A375, as well as two newly predicted GABPA gains in MM047 and MM001 that are discussed in the text, are encircled. (E) The DeepMEL2 prediction score for each topic for both the haplotype 1 (red) and haplotype 2 (blue) of the A375 TERT locus is shown on the left, and the delta prediction scores between two haplotypes are shown on the right. The delta prediction scores for both Topic-14 (promoter topic) and Topic-48 (GABPA topic) are above the 0.05 detection threshold. (F,H) Haplotype-specific DeepExplainer plots of the A375 TERT promoter locus by using Topic-14 (F) and Topic-48 (H), annotated with the corresponding TFs. (G) Comparison of in silico (top; DeepMEL2 delta Topic-14 prediction scores) and in vitro (bottom; fold change in promoter activity) saturation mutagenesis assay. Each variant is color-coded.

References

    1. Alexandrov LB, Kim J, Haradhvala NJ, Huang MN, Ng AWT, Wu Y, Boot A, Covington KR, Gordenin DA, Bergstrom EN, et al. 2020. The repertoire of mutational signatures in human cancer. Nature 578: 94–101. 10.1038/s41586-020-1943-3 - DOI - PMC - PubMed
    1. Alipanahi B, Delong A, Weirauch MT, Frey BJ. 2015. Predicting the sequence specificities of DNA- and RNA-binding proteins by deep learning. Nat Biotechnol 33: 831–838. 10.1038/nbt.3300 - DOI - PubMed
    1. Audano PA, Sulovari A, Graves-Lindsay TA, Cantsilieris S, Sorensen M, Welch AE, Dougherty ML, Nelson BJ, Shah A, Dutcher SK, et al. 2019. Characterizing the major structural variant alleles of the human genome. Cell 176: 663–675.e19. 10.1016/j.cell.2018.12.019 - DOI - PMC - PubMed
    1. Avsec Ž, Kreuzhuber R, Israeli J, Xu N, Cheng J, Shrikumar A, Banerjee A, Kim DS, Beier T, Urban L, et al. 2019. The Kipoi repository accelerates community exchange and reuse of predictive models for genomics. Nat Biotechnol 37: 592–600. 10.1038/s41587-019-0140-0 - DOI - PMC - PubMed
    1. Avsec Ž, Weilert M, Shrikumar A, Krueger S, Alexandari A, Dalal K, Fropf R, McAnany C, Gagneur J, Kundaje A, et al. 2021. Base-resolution models of transcription-factor binding reveal soft motif syntax. Nat Genet 53: 354–366. 10.1038/s41588-021-00782-6 - DOI - PMC - PubMed

Publication types