. 2021 May 13;8(3):ENEURO.0089-21.2021.
doi: 10.1523/ENEURO.0089-21.2021. Print 2021 May-Jun.

Phenotypic Differences between the Alzheimer's Disease-Related hAPP-J20 Model and Heterozygous Zbtb20 Knock-Out Mice

Affiliations

Phenotypic Differences between the Alzheimer's Disease-Related hAPP-J20 Model and Heterozygous Zbtb20 Knock-Out Mice

Daniel R Gulbranson et al. eNeuro. .

Abstract

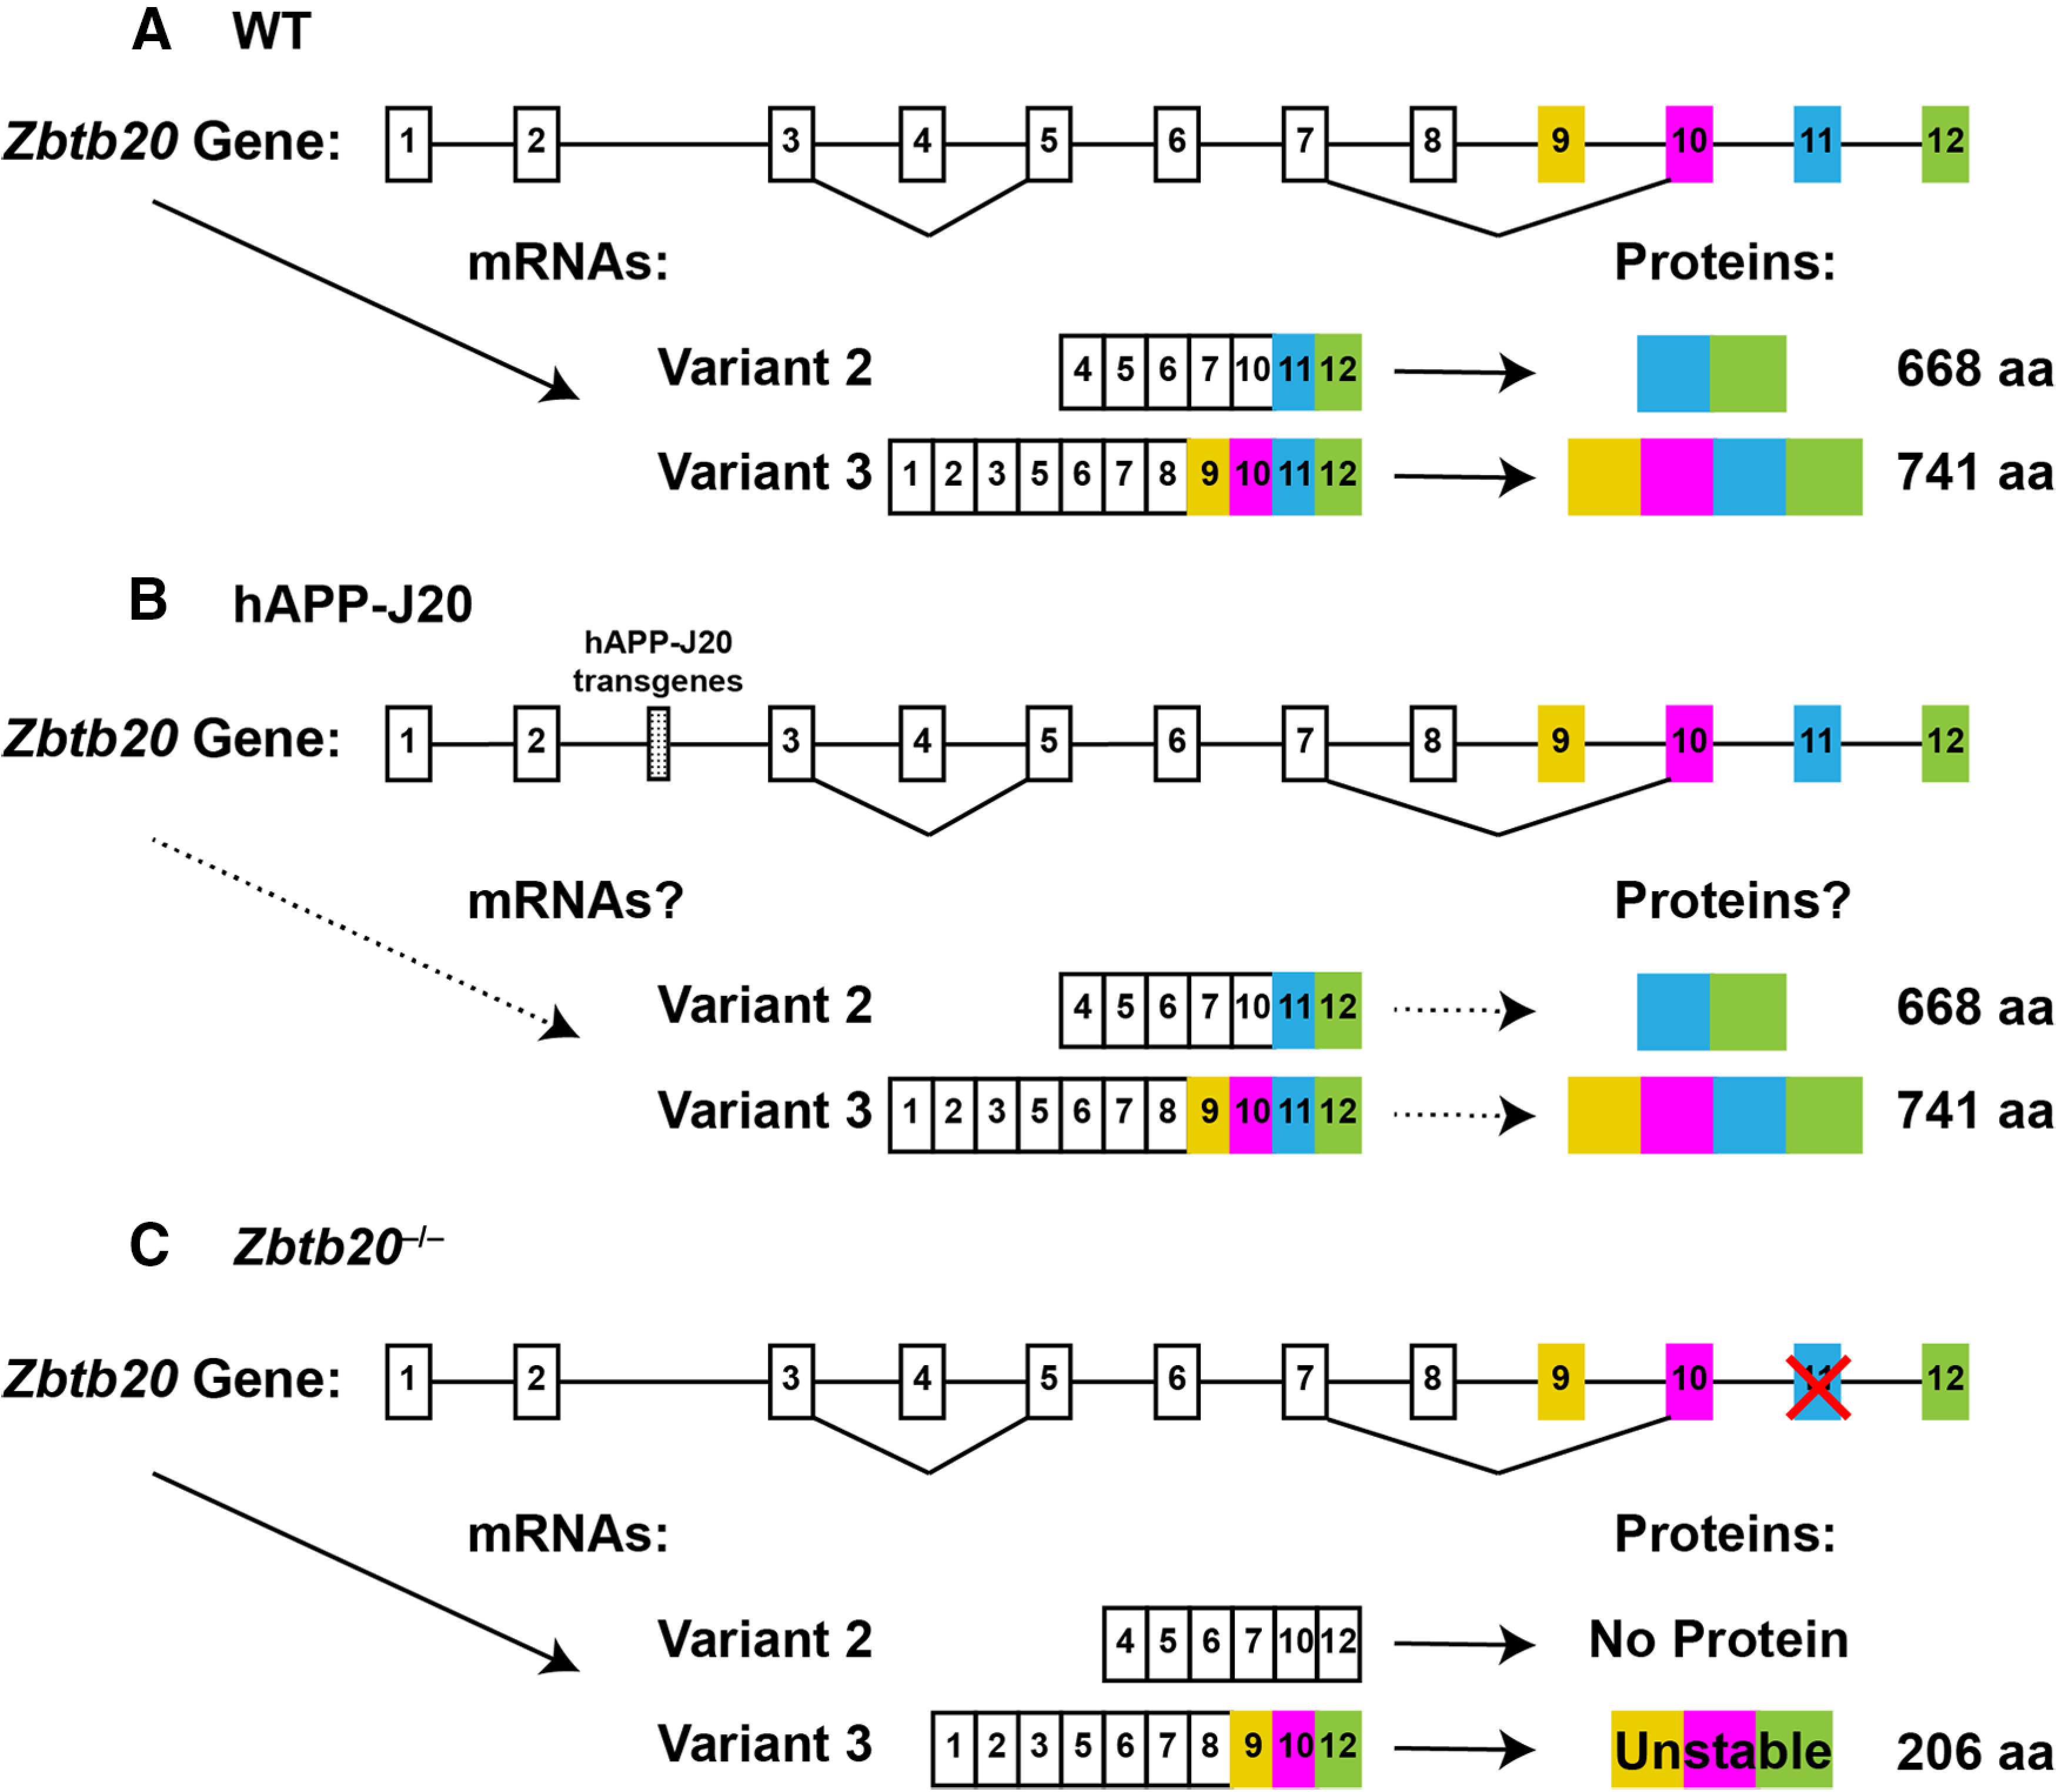
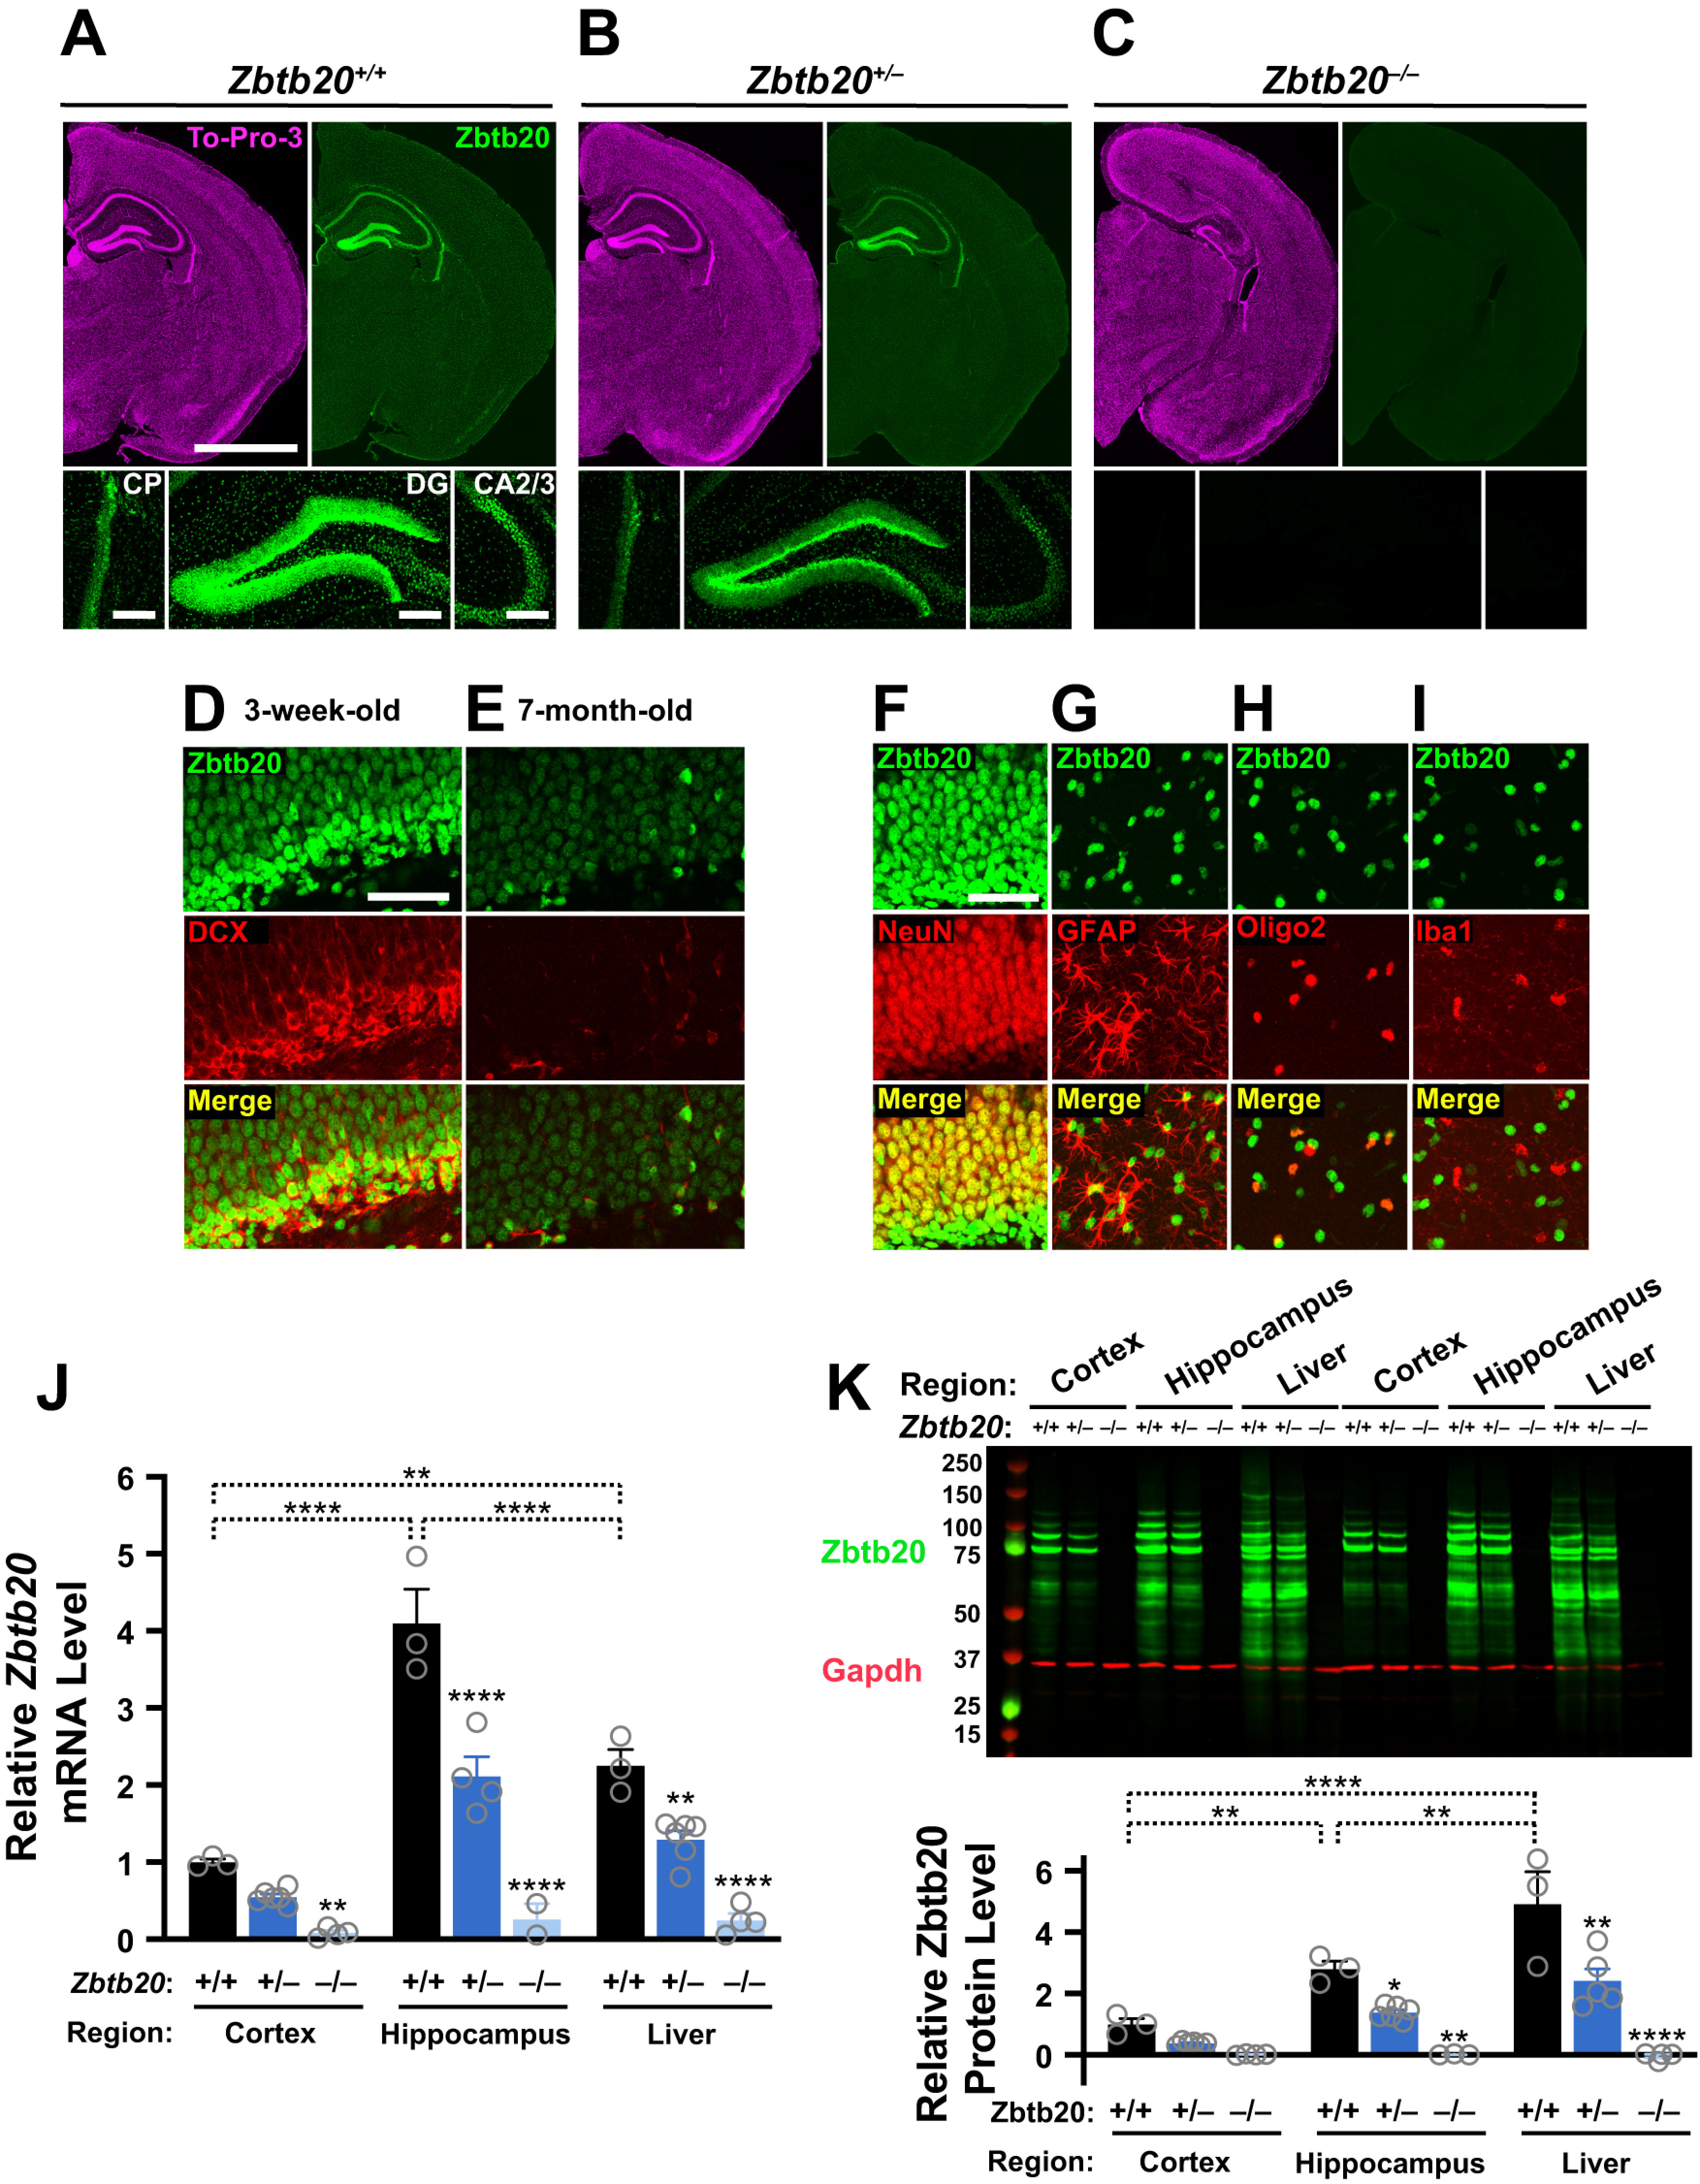
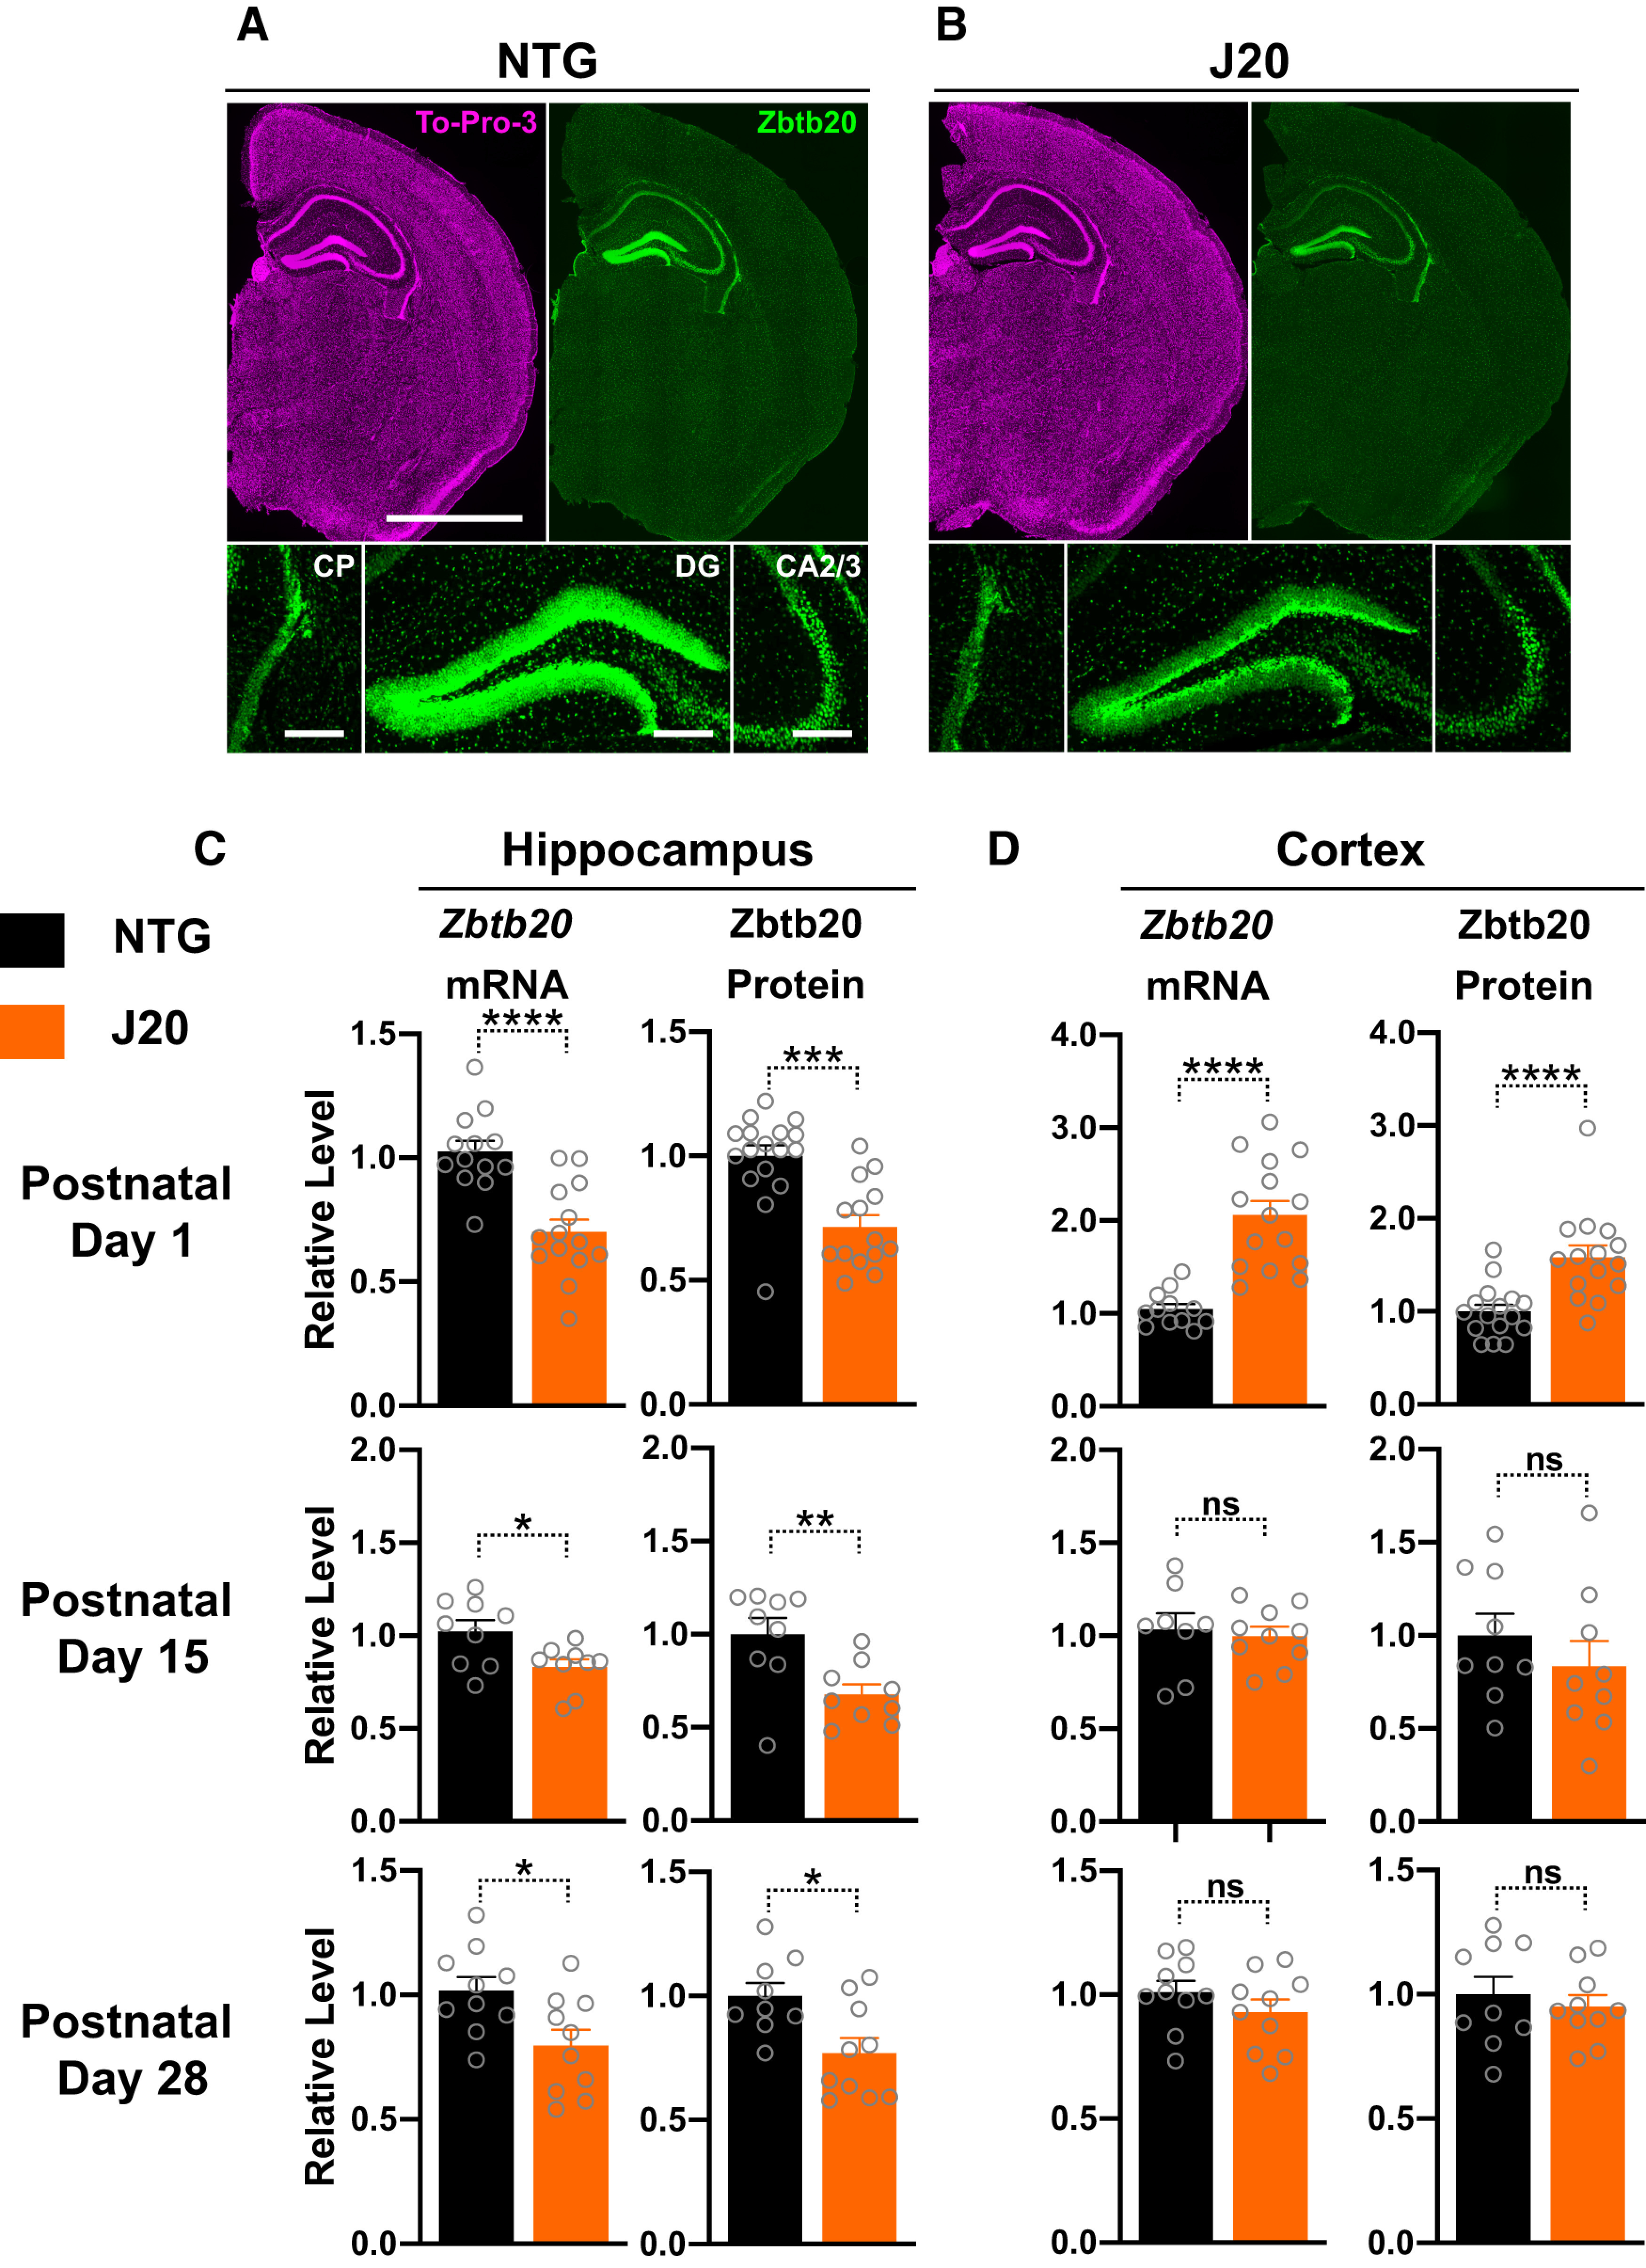
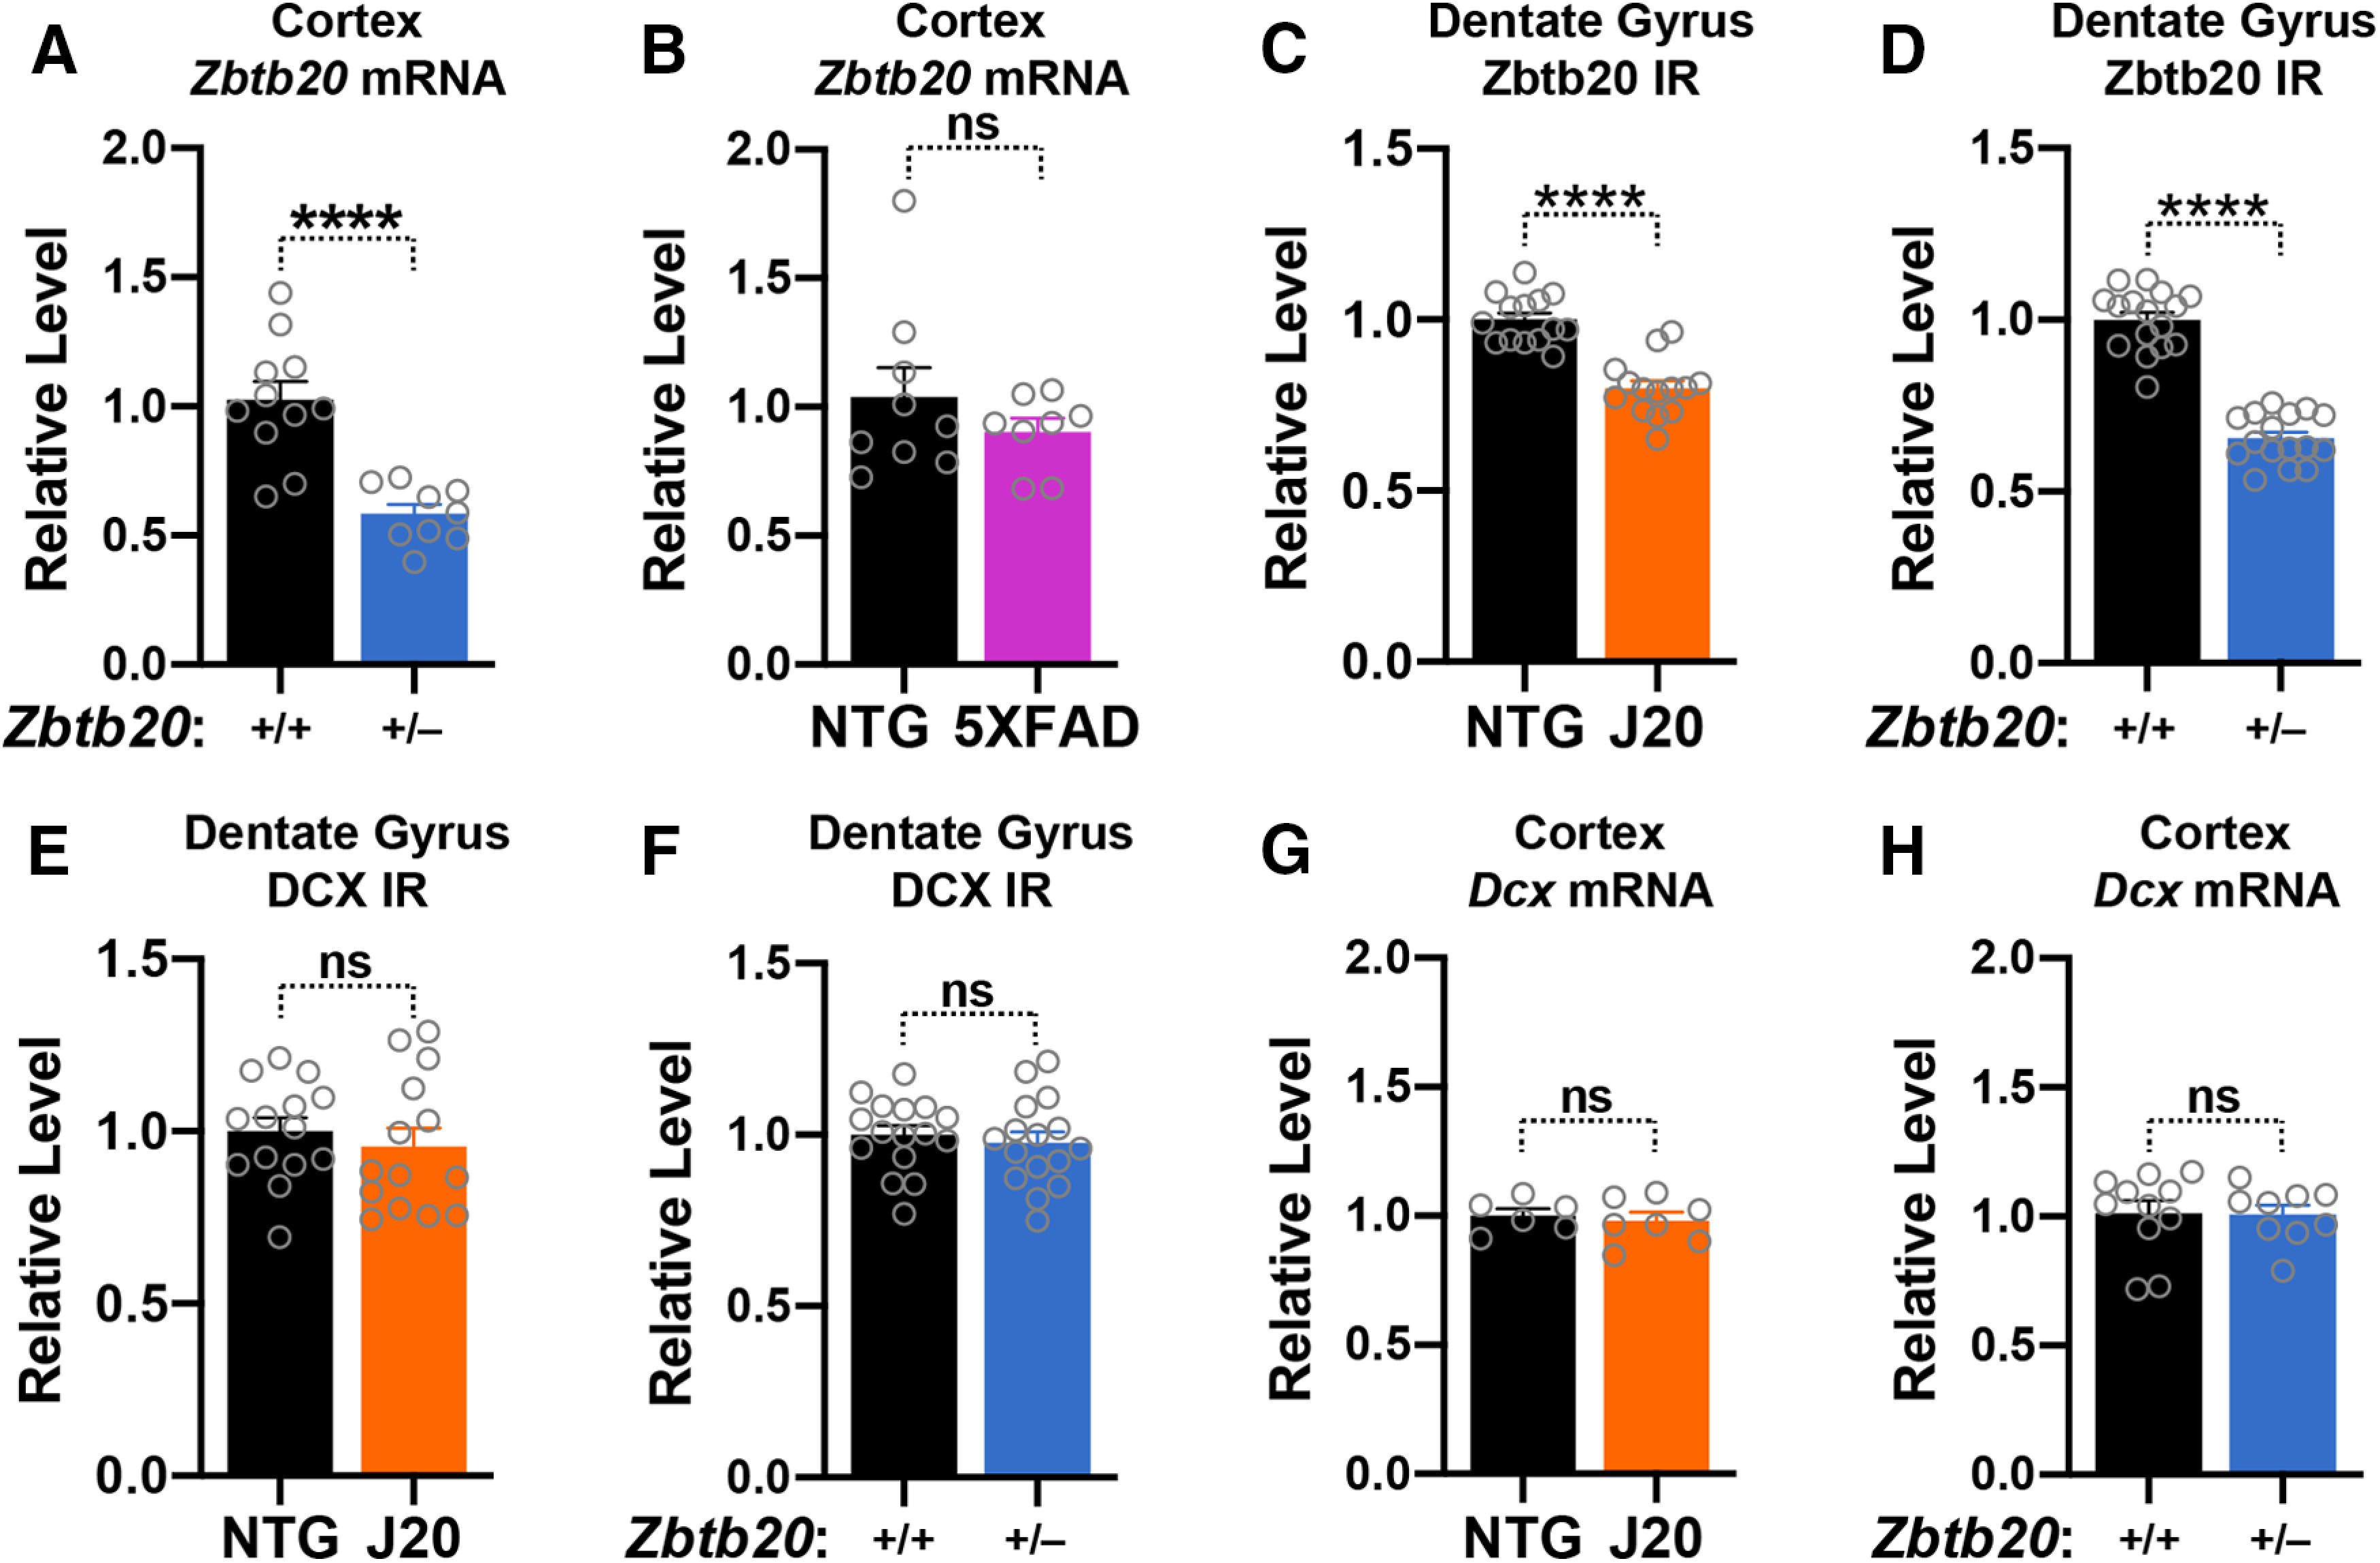
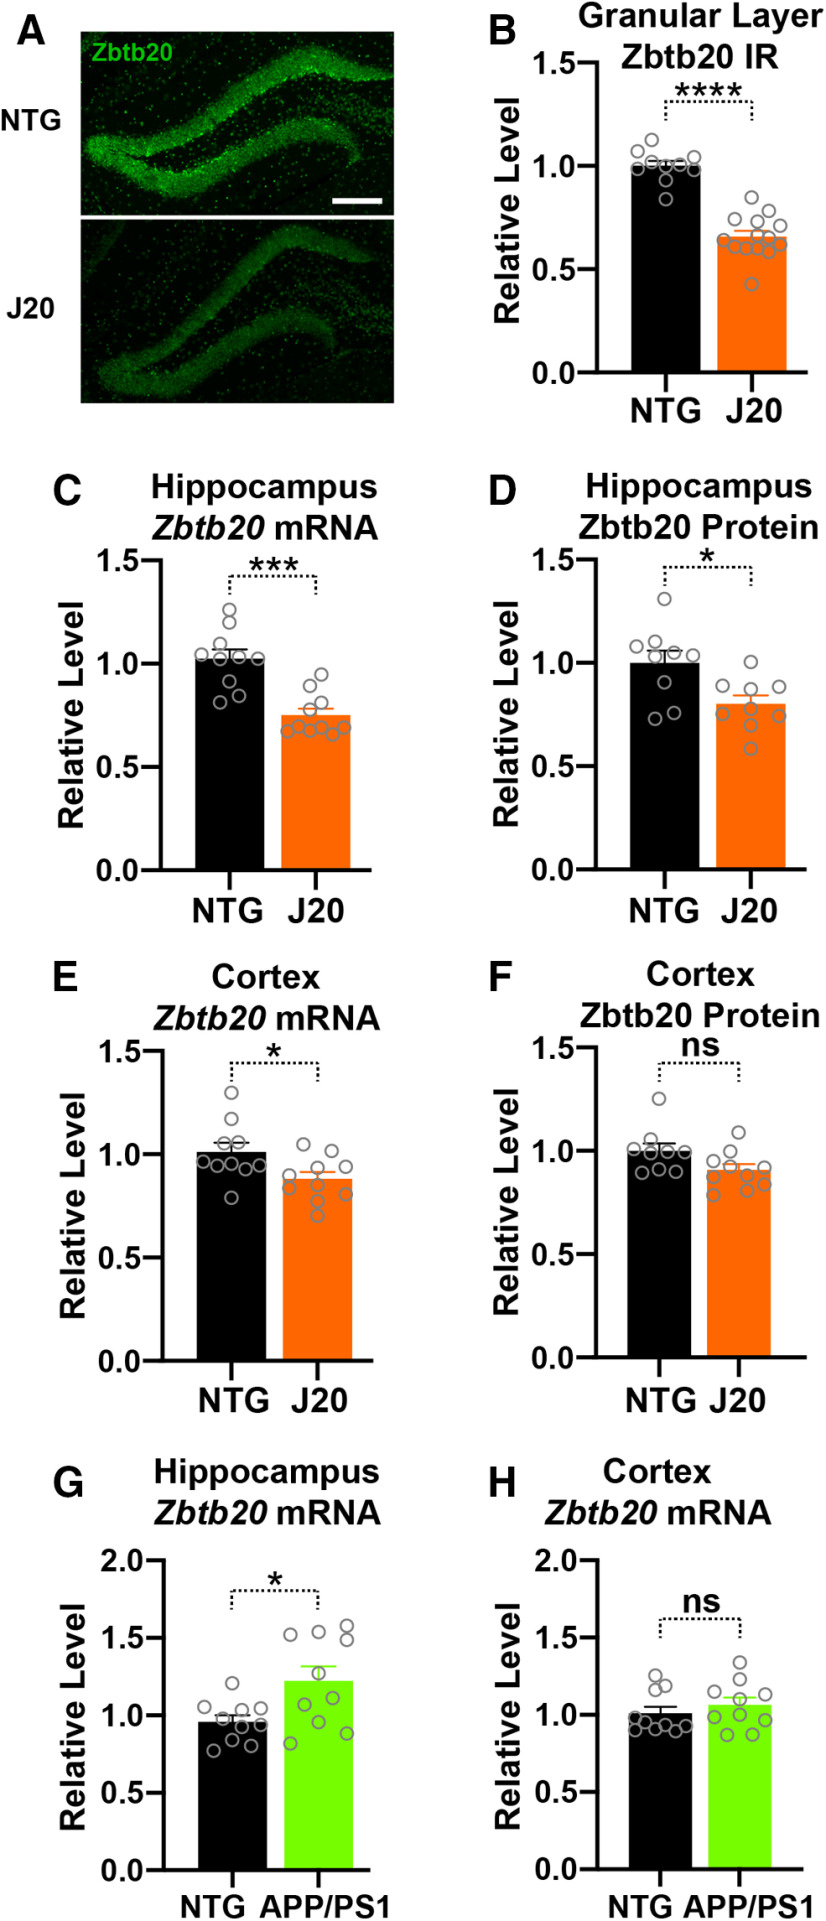
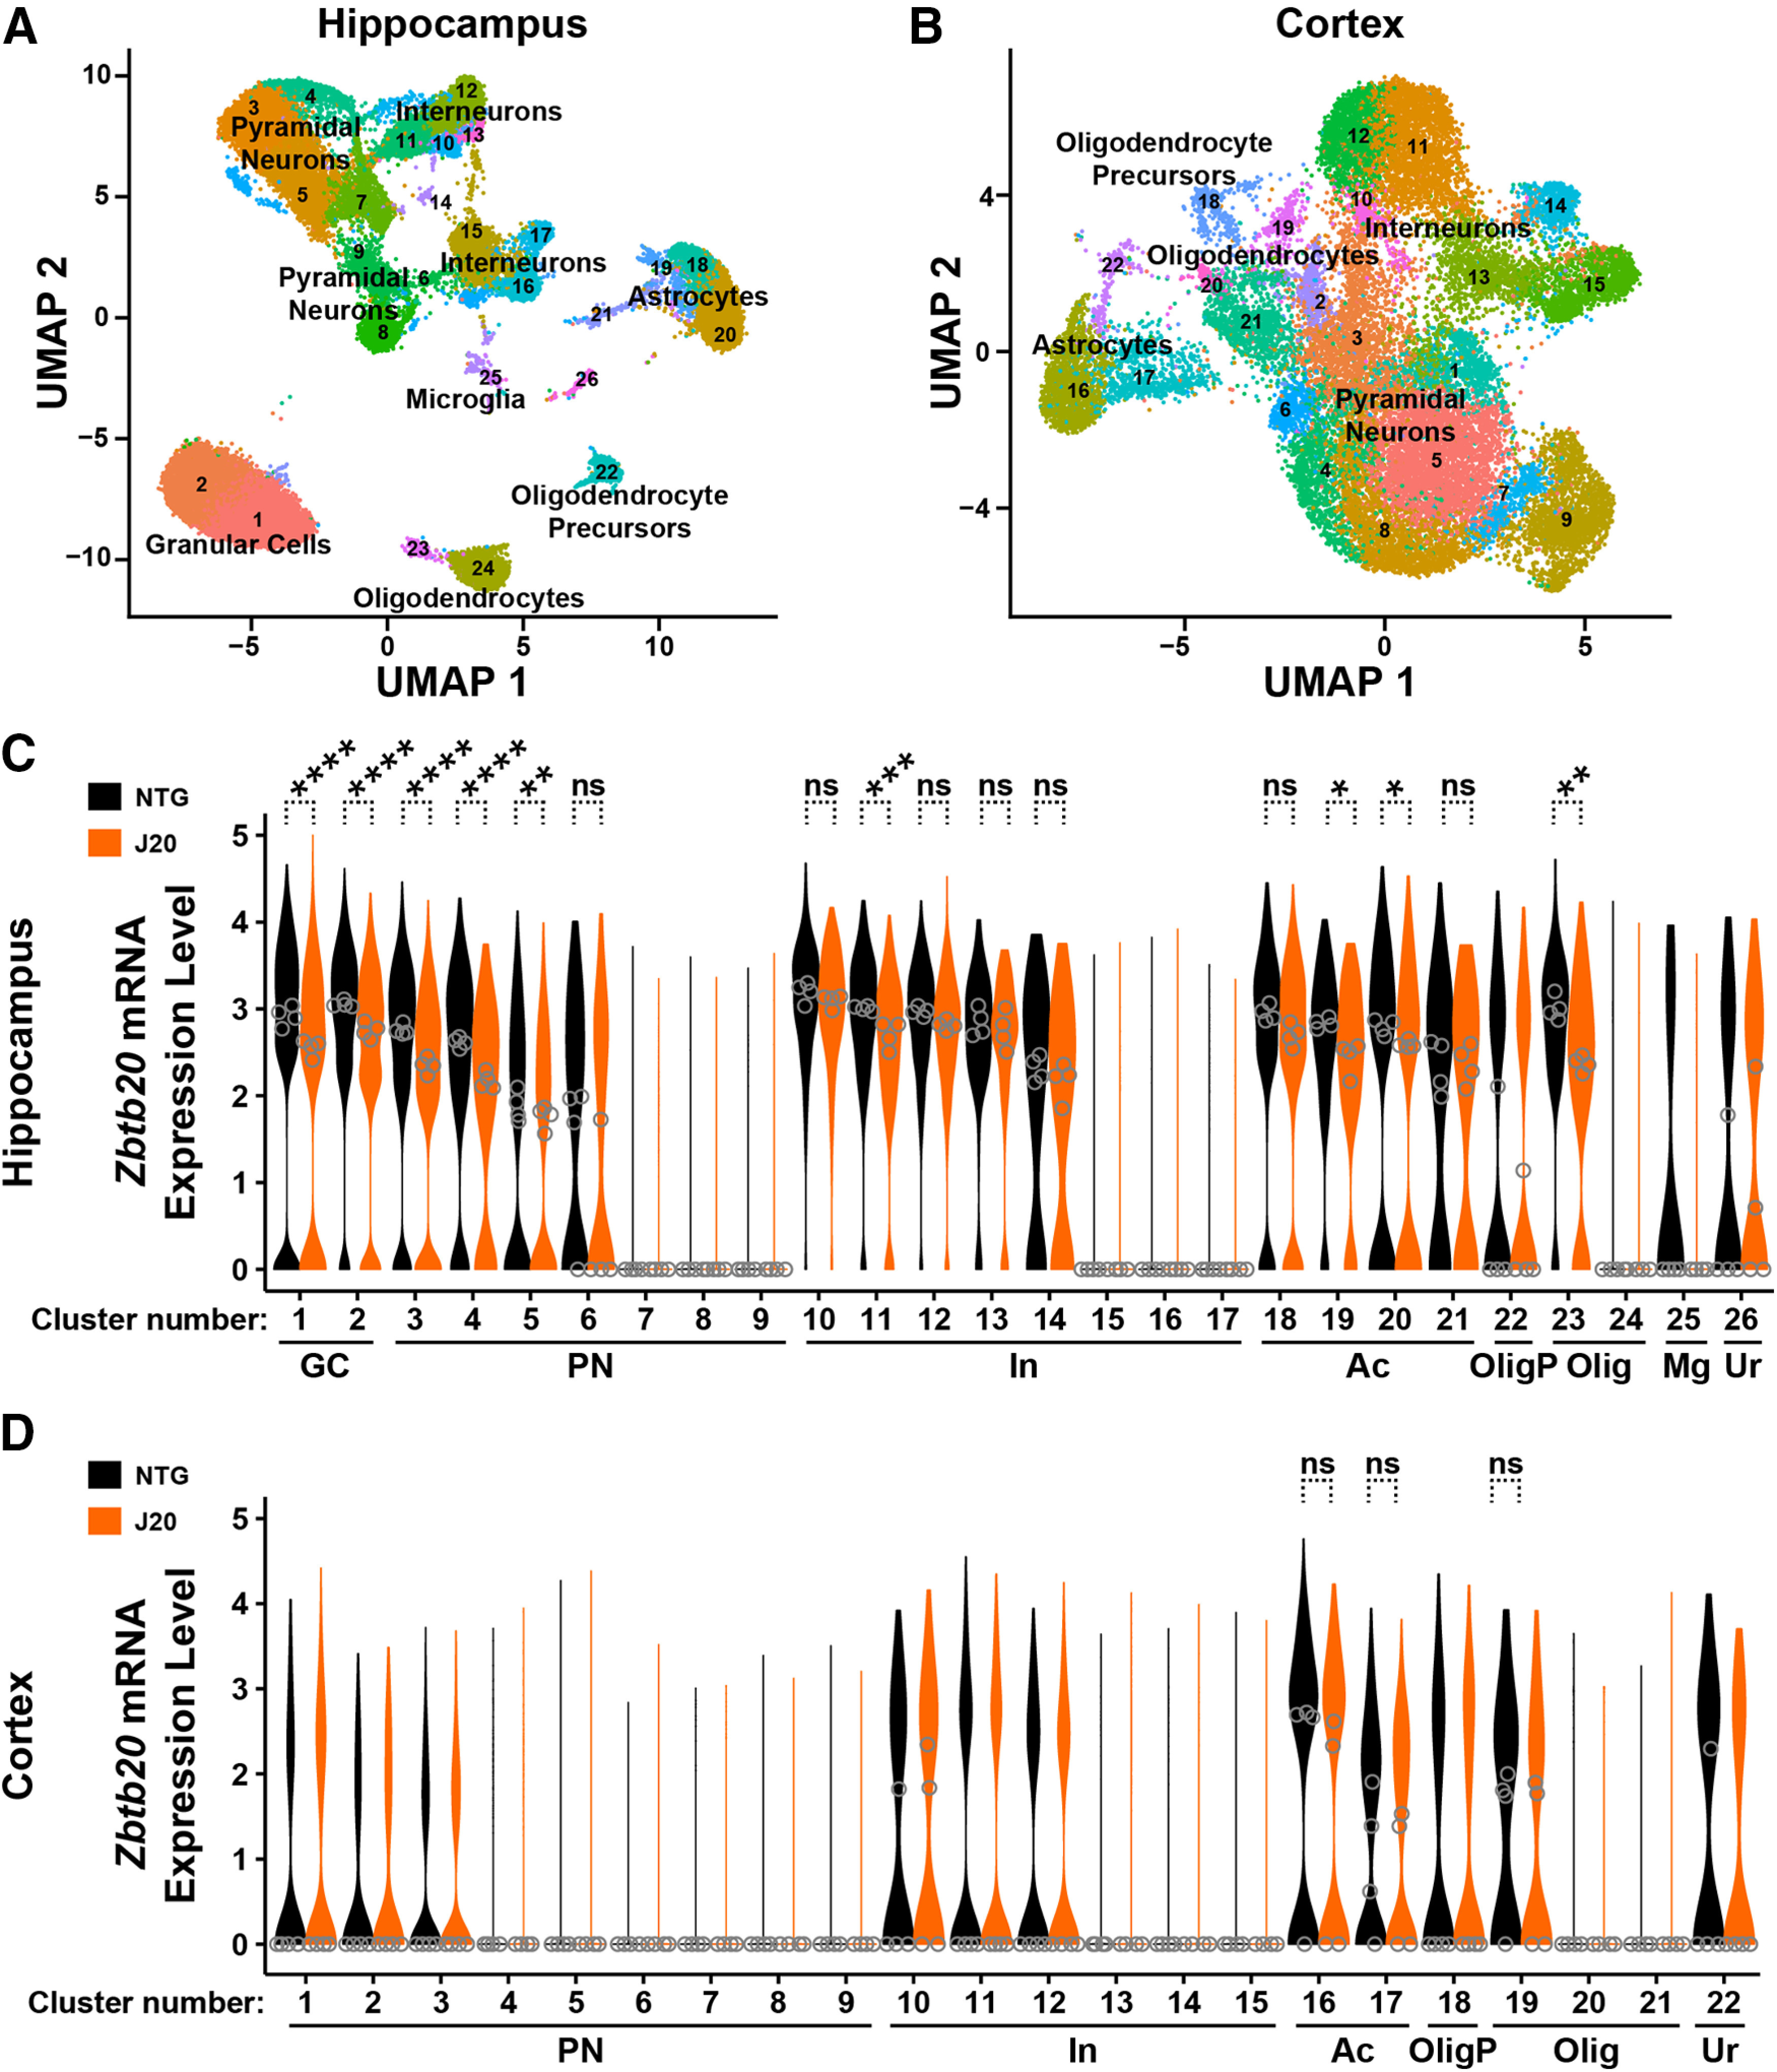
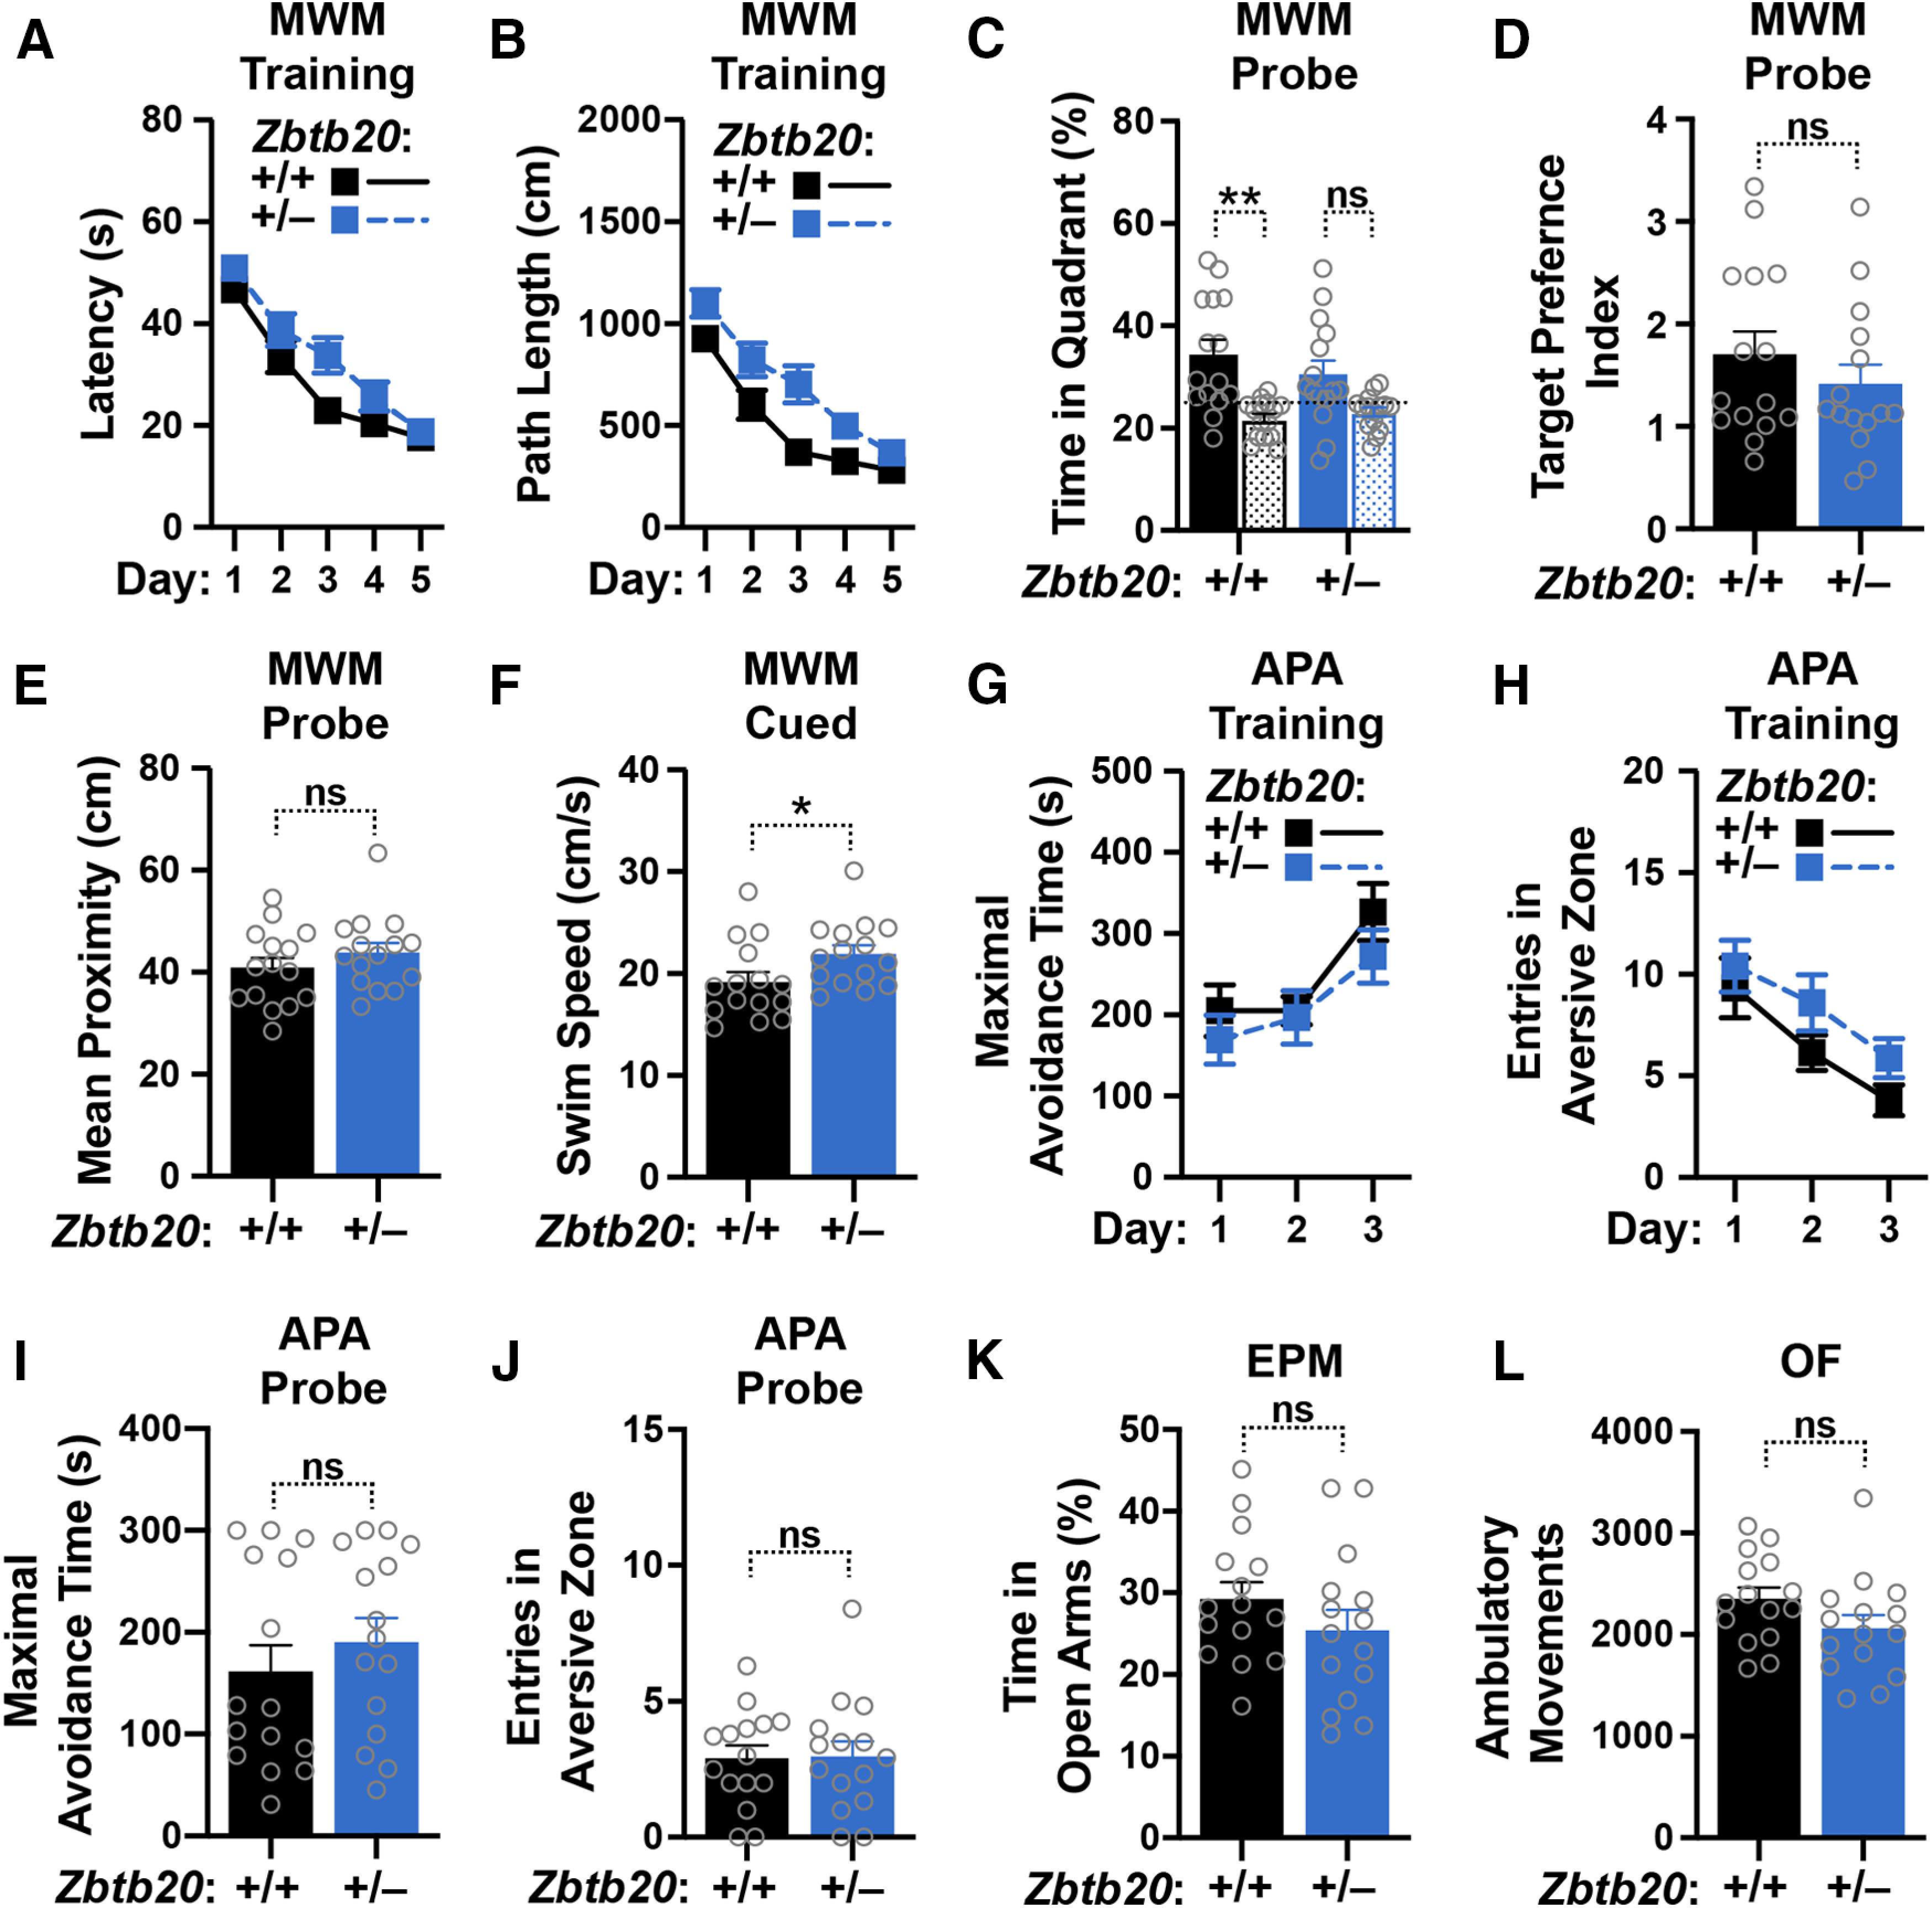
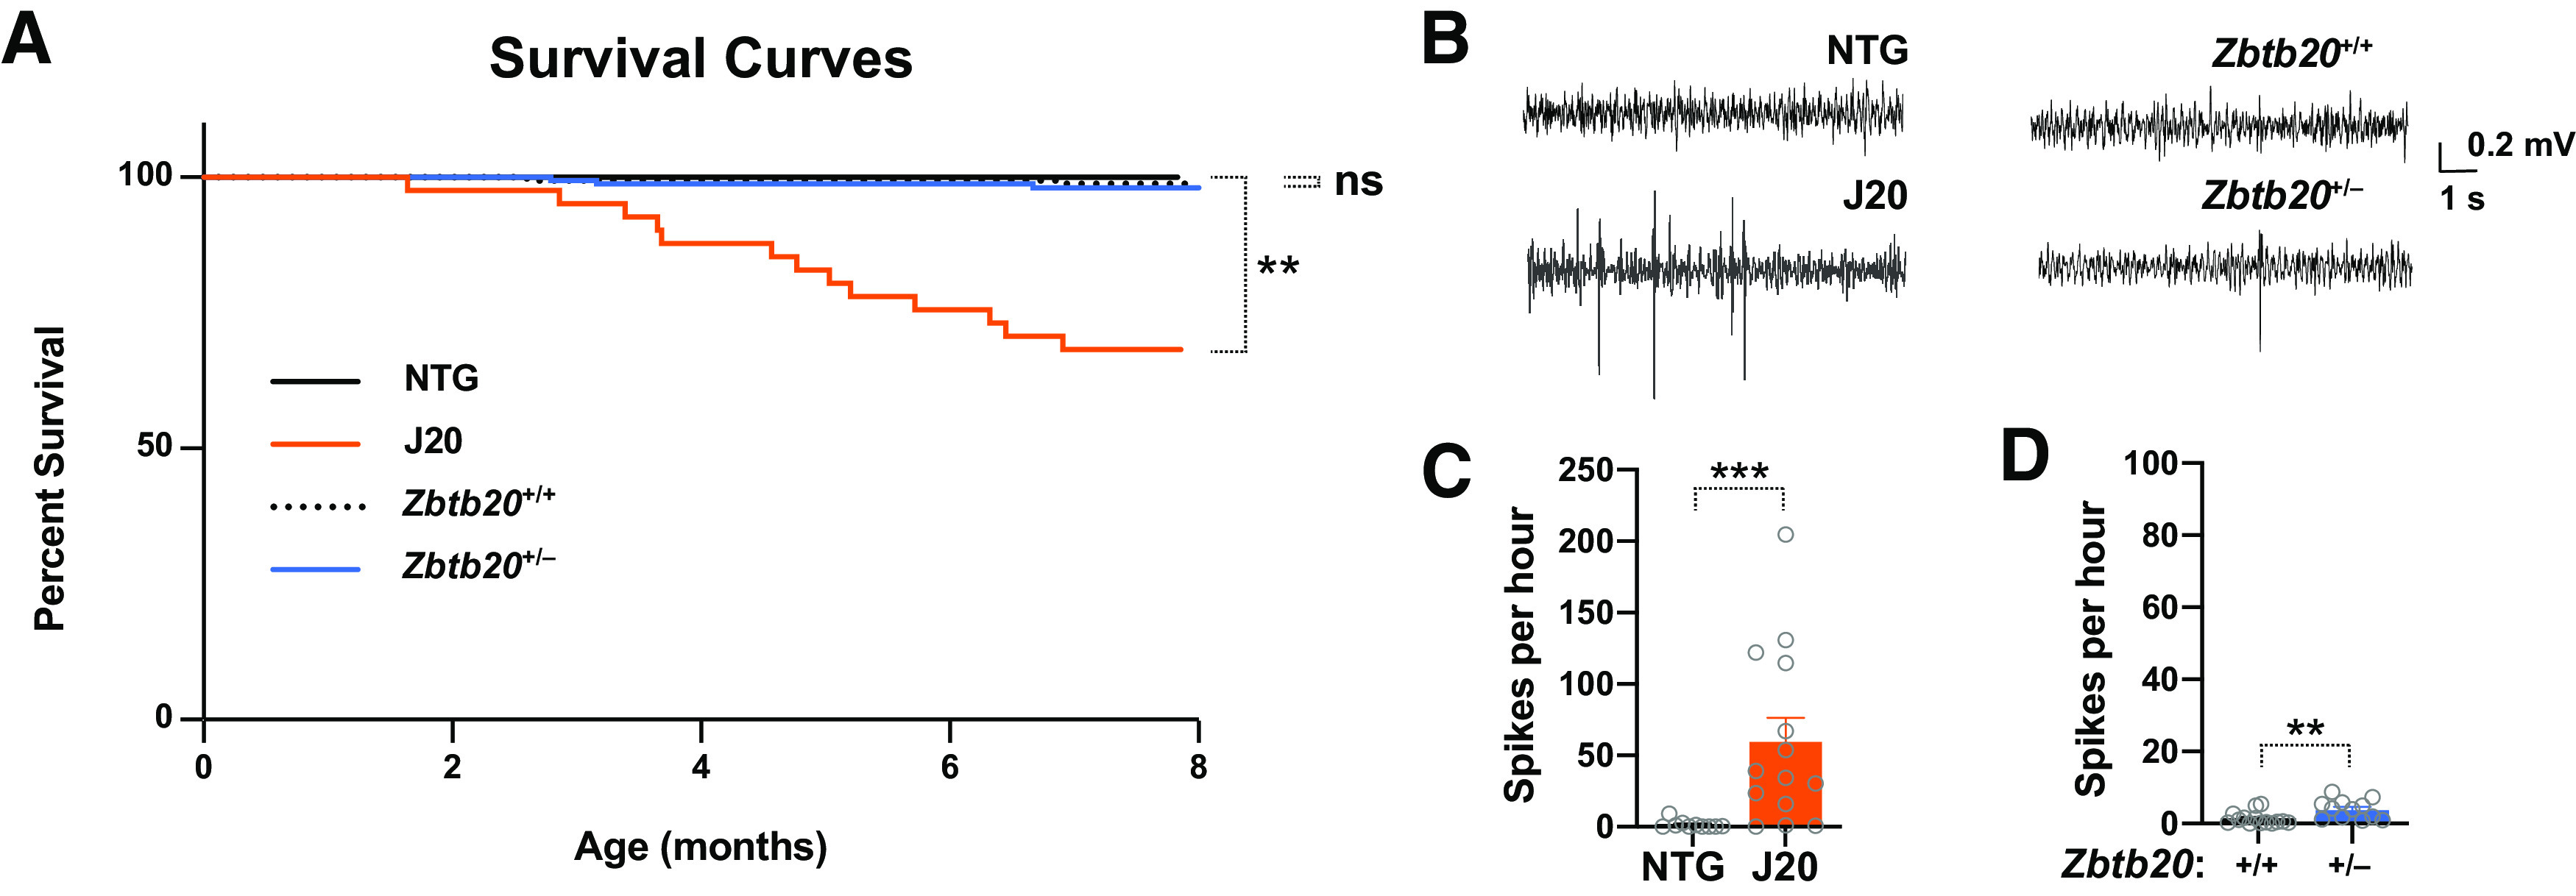
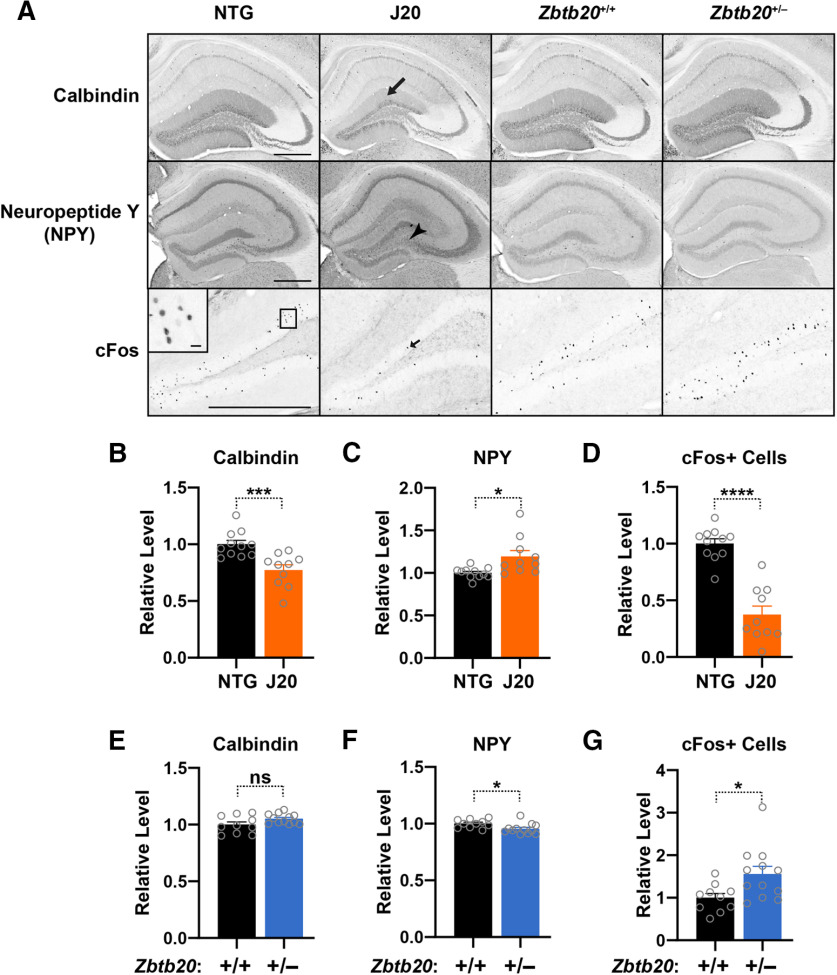
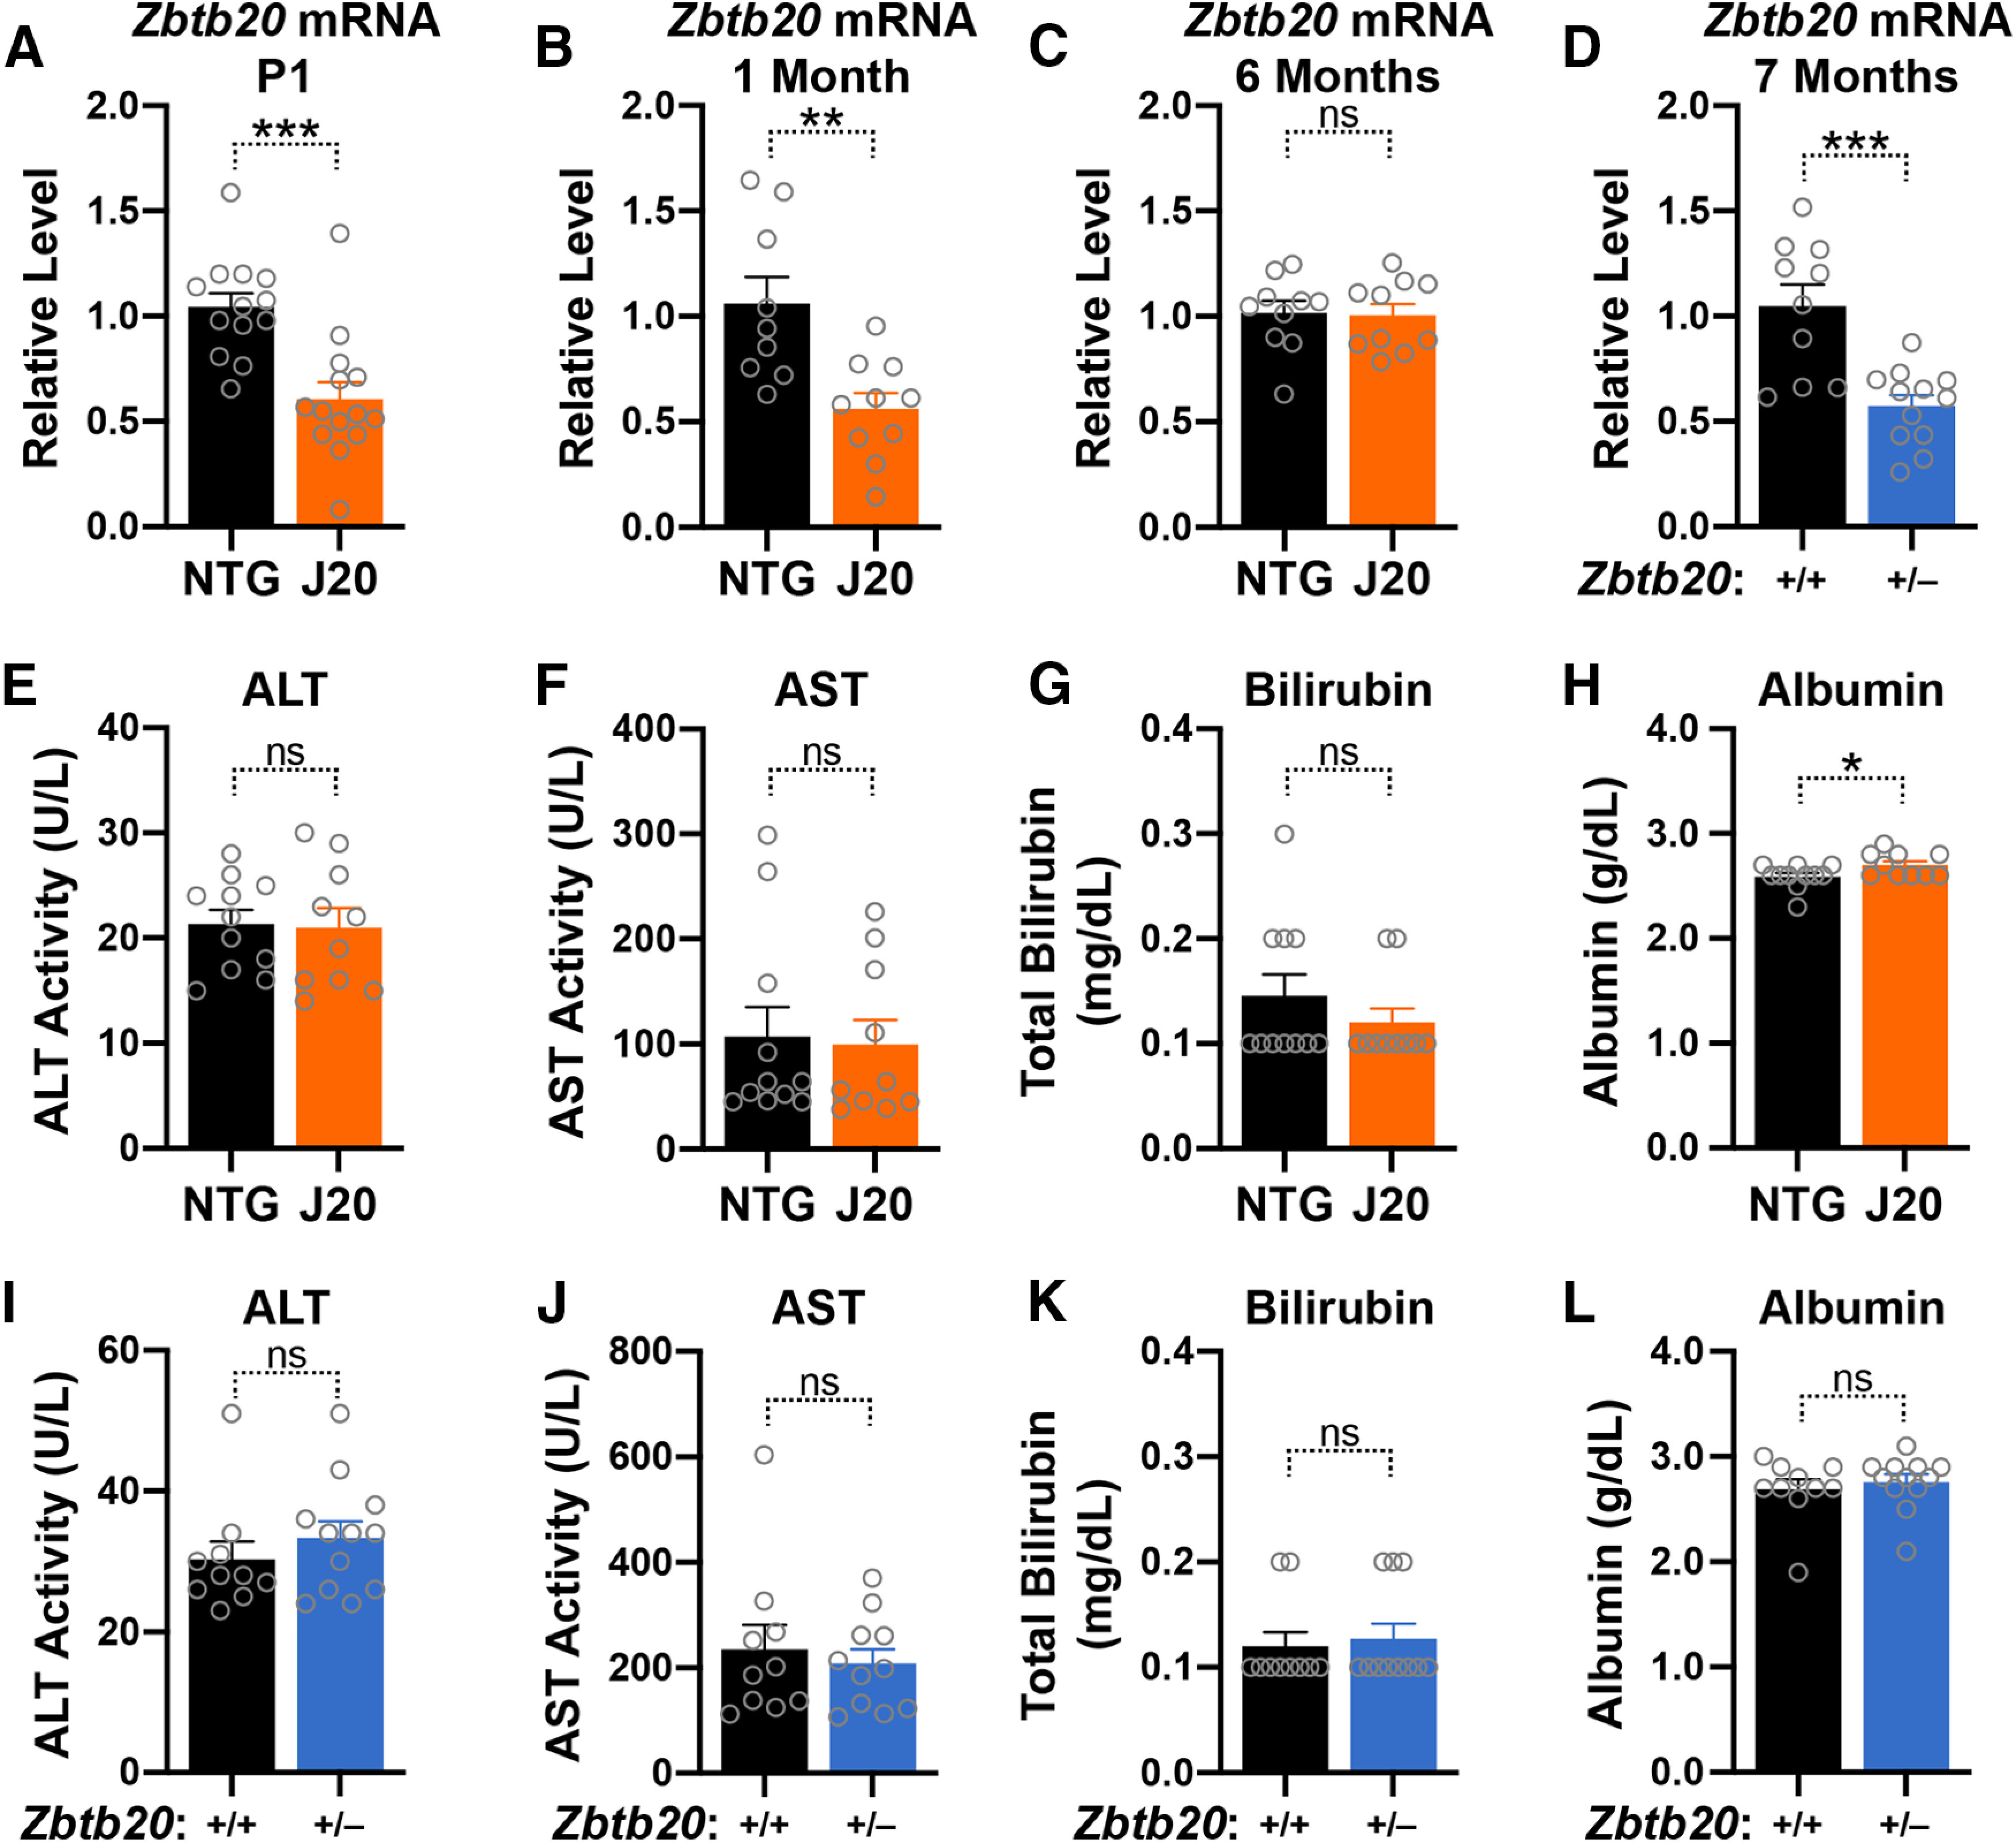
Diverse gene products contribute to the pathogenesis of Alzheimer's disease (AD). Experimental models have helped elucidate their mechanisms and impact on brain functions. Human amyloid precursor protein (hAPP) transgenic mice from line J20 (hAPP-J20 mice) are widely used to simulate key aspects of AD. However, they also carry an insertional mutation in noncoding sequence of one Zbtb20 allele, a gene involved in neural development. We demonstrate that heterozygous hAPP-J20 mice have reduced Zbtb20 expression in some AD-relevant brain regions, but not others, and that Zbtb20 levels are higher in hAPP-J20 mice than heterozygous Zbtb20 knock-out (Zbtb20+/-) mice. Whereas hAPP-J20 mice have premature mortality, severe deficits in learning and memory, other behavioral alterations, and prominent nonconvulsive epileptiform activity, Zbtb20+/- mice do not. Thus, the insertional mutation in hAPP-J20 mice does not ablate the affected Zbtb20 allele and is unlikely to account for the AD-like phenotype of this model.

Keywords: Alzheimer’s disease; Zbtb20; amyloid precursor protein; behavior; epilepsy; mouse model.


Figures

Figure 1.
Figure 1.
Simplified Zbtb20 gene structure in WT, hAPP-J20, and Zbtb20–/– mice. A–C, Diagrammatic structure of the Zbtb20 gene in WT mice (A), hAPP-J20 mice (B), and Zbtb20–/– mice (C). Note that exons and introns are not drawn to scale and that putative translational start codons are present in exons 9 and 11, but not in exons 1–8 or 10. Translatable protein-coding exons are colored. A, The WT Zbtb20 gene (https://www.ncbi.nlm.nih.gov/gene/56490) has been shown to give rise to multiple alternatively spliced transcripts and two major protein products (668 and 741 amino acids (aa) in length, respectively) in cell lines (Mitchelmore et al., 2002). Examples of two confirmed Zbtb20 mRNA variants and the proteins they encode are shown below. In principle, additional transcripts and protein isoforms might be derived from the Zbtb20 gene in brain tissues (https://www.ncbi.nlm.nih.gov/gene/56490 and Wang et al., 2019). Probes and primers used to quantitate potentially protein-coding Zbtb20 mRNAs by RT-qPCR were designed to detect sequences in exons 10 and 11 (Extended Data Fig. 1-1). B, In hAPP-J20 mice, alternatively spliced minigenes (stippled box) that encode human hAPP695, hAPP751, and hAPP770 and are directed by the PDGF β chain promoter integrated into intron 2 of one endogenous Zbtb20 allele. It is uncertain whether and how this insertional event affects the overall production of Zbtb20 mRNAs and proteins in heterozygous hAPP-J20 transgenic mice whose other Zbtb20 allele is intact. C, In Zbtb20–/– mice, exon 11 was deleted, resulting in removal of ∼ 72% of the protein coding sequence (Sutherland et al., 2009).
Figure 2.
Figure 2.
Zbtb20 mRNA and protein expression in Zbtb20+/+, Zbtb20+/–, and Zbtb20–/– mice. A–C, Coronal brain sections from three-week-old mice of the indicated genotypes were stained with TO-PRO-3 to identify nuclei (top-left in each panel), labeled with an antibody (BD Biosciences, catalog #565453) against Zbtb20 (top-right and bottom row in each panel), and imaged by epifluorescence microscopy. Hemibrain sections (scale bar: 2 mm) are shown at the top and magnified views (scale bar: 200 μm) of the choroid plexus (CP; left), dentate gyrus (DG; center), and CA2/3 (right) at the bottom. D,E, Coronal brain sections from three-week-old (D) and seven-month-old (E) WT mice were co-immunostained for Zbtb20 and doublecortin (DCX) and imaged by confocal microscopy. The subgranular zone of the dentate gyrus is shown (scale bar: 50 μm). F–I, Coronal brain sections from three-week-old WT mice were immunostained for Zbtb20 and co-labeled with antibodies against cell type-specific markers for (F) neurons (NeuN), (G) astrocytes (GFAP), (H) oligodendrocytes (Oligo2), or (I) microglia/macrophages (Iba1), and imaged by confocal microscopy. The granular layer (F) and molecular layer (G–I) of the dentate gyrus are shown (scale bar: 50 μm). J,K, Zbtb20 mRNA (J) and Zbtb20 protein (K) levels in cortices, hippocampi and livers from three-week-old mice of the indicated genotypes were determined by RT-qPCR and Western blotting, respectively. J, Relative Zbtb20 mRNA levels were quantified by the 2–ΔΔCT method (Livak and Schmittgen, 2001) using Gapdh mRNA as the internal reference. Mean Zbtb20/Gapdh mRNA ratios in WT cortical samples were defined as 1.0; n = 2–6 mice per group. K, Western blot depicting Zbtb20 signals across tissues and genotypes is shown on top. Samples from replicate groups of mice were loaded on the left and right part of the gel, respectively. Gapdh was used as a loading control. Quantitations of Western blot signals are shown below. Zbtb20 signals were normalized to Gapdh signals and mean Zbtb20/Gapdh ratios in the cortex of WT mice were defined as 1.0; *p <0.05, **p <0.01, ****p <0.0001 versus WT mice or as indicated by brackets (linear mixed model analysis with Holm–Sidak correction). Dots represent individual mice and bars are means ± SEM.
Figure 3.
Figure 3.
Several other antibodies raised against Zbtb20 lack specificity. A–C, Western blots depict representative immunoreactivity patterns detected with the anti-Zbtb20 antibodies listed above the respective blots in lysates of cortex (AC), hippocampus (A), and liver (A) from three-week-old mice of the indicated genotypes. Note that genetic modulation of Zbtb20 expression did not alter the staining obtained with these antibodies.
Figure 4.
Figure 4.
Hippocampal and cortical Zbtb20 expression during postnatal development in hAPP-J20 mice. A,B, Coronal brain sections from three- to four-week-old mice of the indicated genotypes were stained with TO-PRO-3 (top-left) to identify nuclei, labeled with an antibody against Zbtb20 (top-right and bottom rows), and imaged by epifluorescence microscopy as in Figure 2. Hemibrain sections (scale bar: 2 mm) are shown at the top and magnified views (scale bar: 200 μm) of the indicated brain regions at the bottom. C,D, Zbtb20 mRNA and protein levels in the hippocampus (C) and cortex (D) of hAPP-J20 mice and NTG littermate controls at postnatal days 1 (top), 15 (middle), or 28 (bottom) were measured by RT-qPCR (left) and Western blot (right) analysis, respectively, using tissues from opposite hemibrains of the same mice. Relative Zbtb20 mRNA levels were determined as in Figure 2 except that mean Zbtb20/Gapdh mRNA ratios in matching brain regions of NTG mice were defined as 1.0. Relative Zbtb20 protein levels were normalized to β-tubulin levels and mean Zbtb20/β-tubulin ratios in matching brain regions of WT mice were defined as 1.0; n = 8–17 mice per group; *p <0.05, **p <0.01, ***p <0.001, ****p <0.0001 by two-tailed permutation test (C, postnatal day 1, protein), unpaired two-tailed t test with Welch correction (D, postnatal day 1, mRNA), or unpaired two-tailed Student’s t test (C,D, all other graphs). ns, not significant. Dots represent individual mice and bars are means ± SEM.
Figure 5.
Figure 5.
Zbtb20 and doublecortin levels in the cortex and dentate gyrus of Zbtb20+/– mice, 5XFAD mice, hAPP-J20 mice, and controls. A,B, Cortical levels of Zbtb20 mRNA were measured in mice of the indicated genotypes on postnatal day 1 as described in Figure 3. C–F, Coronal brain sections from three- to four-week-old mice of the indicated genotypes were co-immunostained for Zbtb20 and doublecortin (DCX) and imaged by confocal microscopy. Relative Zbtb20 (C,D) and doublecortin (E,F) immunoreactivity (IR; signal intensity) in the granular layer of the dentate gyrus. Mean levels in NTG or WT controls were defined as 1.0. G,H, Cortical levels of doublecortin (Dcx) mRNA were measured in mice of the indicated genotypes on postnatal day 1. Dcx/Gapdh mRNA ratios in NTG or WT mice were defined as 1; n = 6–16 mice per group; ****p <0.0001 by unpaired two-tailed Student’s t test (A, C–H) or unpaired two-tailed t test with Welch correction (B). ns, not significant. Dots represent individual mice and bars are means ± SEM.
Figure 6.
Figure 6.
Hippocampal and cortical Zbtb20 expression in adult hAPP-J20 mice and NTG controls. A, Representative confocal photomicrographs of coronal dentate gyrus sections from four- to five-month-old NTG and hAPP-J20 mice immunostained for Zbtb20 (scale bar: 200 μm). B, Relative Zbtb20 immunoreactivity (IR; signal intensity) in the granular layer of the dentate gyrus in four- to five-month-old NTG and hAPP-J20 mice. Mean signals in NTG mice were defined as 1.0. C–F, Zbtb20 mRNA and protein levels in the hippocampus and cortex of six-month-old NTG and hAPP-J20 mice were determined by RT-qPCR and western blot analysis, respectively, as in Figure 3. G,H, Zbtb20 mRNA levels in the hippocampus and cortex of six- to seven-month-old NTG and APP/PS1 mice determined by RT-qPCR; n = 4–6 male and 5–8 female mice per group; *p <0.05, ***p <0.001, ****p <0.0001 by unpaired two-tailed Student’s t test. ns, not significant. Dots represent individual mice and bars are means ± SEM.
Figure 7.
Figure 7.
Zbtb20 mRNA expression in single nuclei isolated from hippocampus or cortex of hAPP-J20 mice and NTG controls. Cell nuclei were isolated from the hippocampus and cortex of eight-month-old NTG and hAPP-J20 mice and analyzed by single-nucleus RNA sequencing (snRNA-seq). A,B, Uniform manifold approximation and projection (UMAP) plot of hippocampal (A) and cortical (B) snRNA-seq data from both groups of mice. Clustering and marker gene analysis identified 17 neuronal and nine non-neuronal hippocampal clusters and 15 neuronal and seven non-neuronal cortical clusters. Individual dots correspond to nuclei and colors to clusters. The assignment of cell types to a cluster was based on 10–20 curated differentially expressed genes. C,D, Violin plots comparing the distribution of Zbtb20 expression in individual hippocampal (C) and cortical (D) nuclei from NTG and hAPP-J20 mice, grouped by cluster. Normalized expression levels were calculated by dividing Zbtb20 reads by total reads for any given nucleus, multiplying by 10,000, and taking the natural log of the product. Open circles represent the median Zbtb20 expression of all nuclei in a cluster from an individual mouse. Ac; astrocytes; GC, dentate gyrus granule cells; In, interneurons; Mg, microglia; Olig, oligodendrocytes; OligP, oligodendrocyte precursors; PN, pyramidal neurons; Ur, unresolved; n = 4 female mice per group. The significance of genotype effects on Zbtb20 expression was determined in clusters whose medians of Zbtb20 expression were >0 in ≥3 WT mice, using individual mice as the number of biological samples (n); *p <0.05, **p <0.01, ***p <0.001, ****p <0.0001 by pseudo-bulk analysis in muscat (Crowell et al., 2020) with Holm–Sidak correction. ns, not significant.
Figure 8.
Figure 8.
Behavioral performance of Zbtb20+/– mice and WT controls. A–L, Zbtb20+/– mice and WT (Zbtb20+/+) controls were tested in the Morris water maze (MWM), active place avoidance (APA), elevated plus maze (EPM), and open field (OF) paradigms at five to seven months of age. A–F, Learning of the spatial component (platform hidden) of the MWM task as indicated by reductions in the escape latency (A) and path length (B) to reach a hidden platform. C–F, A probe trial (platform removed) was performed 24 h after the last training trial to measure the percent time mice spent in the target (solid) versus non-target (stippled) quadrants (C), calculate the target preference index (ratio of target/non-target percentages; D), and determine the average distance of mice from the original target position during the trial (E). F, Swim speed during the second trial in the visually cued component of the MWM. G–J, Learning of the APA task as indicated by increases in maximal avoidance time (G) and reduced numbers of entries into the aversive zone (H). I,J, A probe trial (aversive stimulus inactivated) was performed 24 h after the last training trial to measure the maximal avoidance time of (I) and number of entries into (J) what was the aversive zone during training. K, Percent time spent in the open arms of the EPM. L, Ambulatory movements (beam breaks) during 15 min in the OF; n = 15 male mice per group. Linear mixed model analysis of learning curves revealed significant effects of training (day) in (A, p <0.0001; B, p <0.0001; G, p <0.001; H, p <0.0001) and of genotype in (B, p <0.01) but not (A, p =0.1; G, p =0.6; H, p =0.4). No interactions were detected between training and genotype (A, p =0.4; B, p =0.3; G, p =0.6; H, p =0.6). *p <0.05, **p <0.01 by paired (C) or unpaired (D–F,I–L) two-tailed Student’s t test. ns, not significant. Dots represent individual mice and bars are means ± SEM.
Figure 9.
Figure 9.
Survival and EEG activity in hAPP-J20 mice, Zbtb20+/– mice, and controls. A, Kaplan–Meier survival curves of the indicated genotypes. The hAPP-J20 and NTG data were described in a previous publication (Johnson et al., 2020). B–D, Intracranial EEG recordings were obtained from resting mice of the indicated genotypes at 9–11 months of age. B, Representative traces depicting multiple epileptiform spikes in an hAPP-J20 mouse (bottom-left), a single spike in a Zbtb20+/– mouse (bottom-right), and normal EEG activity in control mice (top). C,D, Spike frequencies measured in hAPP-J20 (C) and Zbtb20+/– (D) mice and age-matched controls from each of these lines (C,D) while they were resting. Note the different y-axis scales in these panels; n = 12–14 male mice per group; **p <0.01, ***p <0.001 by Mantel–Cox log-rank test (A) or unpaired two-tailed Student’s t test (C,D). ns, not significant. Dots represent individual mice and bars are means ± SEM.
Figure 10.
Figure 10.
Molecular indicators of epileptiform activity. A–G, Coronal brain sections from five- to eight-month-old mice of the indicated genotypes were immunostained for calbindin (A,B,E), NPY (A,C,F), or c-Fos (A,D,G). A, Representative images depicting the levels and distributions of calbindin, NPY, and c-Fos immunoreactivities in the dentate gyrus and hippocampus. As is typical for this model, the hAPP-J20 mouse showed reduced calbindin staining in the molecular layer of the dentate gyrus (top, arrow), increased NPY in mossy fibers (middle, arrowhead), and fewer c-Fos-positive (+) cells in the granular layer (bottom, small arrow). Scale bars: 500 μm (inset, 200 μm). B–G,Quantifications of these indicators of epileptiform activity. Mean levels in WT or NTG controls were defined as 1.0; n = 10–12 female mice per group; *p <0.05, ***p <0.001, ****p <0.0001 by unpaired two-tailed Student’s t test (B,E,G), unpaired two-tailed t test with Welch correction (C,D), or two-tailed permutation test (F). ns, not significant. Dots represent individual mice and bars are means ± SEM.
Figure 11.
Figure 11.
Liver levels of Zbtb20 mRNA and serum levels of liver function indicators in hAPP-J20 mice, Zbtb20+/– mice, and controls. A–D, Zbtb20 mRNA levels were determined in livers from NTG and hAPP-J20 mice at birth (P1; A), one month (B), or six months (C) of age, and in seven-month-old Zbtb20+/+ and Zbtb20+/– mice (D) by RT-qPCR using Gapdh mRNA as the reference. Mean levels in NTG or WT mice were defined as 1.0. (E–L) Serum levels of the following liver function indicators were determined in NTG and hAPP-J20 mice (E–H) and in Zbtb20+/+ and Zbtb20+/– mice (I–L) at five to seven months of age: alanine aminotransferase (ALT) activity (E, I), aspartate transaminase (AST) activity (F,J), total bilirubin (G,K), and albumin (H,L); *p <0.05, **p <0.01, ***p <0.001 by unpaired two-tailed Student’s t test (A–F,J) or two-tailed permutation test (G–I,K,L). ns, not significant. Dots represent individual mice and bars are means ± SEM.

References

    1. Ameen-Ali KE, Simpson JE, Wharton SB, Heath PR, Sharp PS, Brezzo G, Berwick J (2019) The time course of recognition memory impairment and glial pathology in the hAPP-J20 mouse model of Alzheimer’s disease. J Alzheimers Dis 68:609–624. 10.3233/JAD-181238 - DOI - PubMed
    1. Brunnström H, Gustafson L, Passant U, Englund E (2009) Prevalence of dementia subtypes: a 30-year retrospective survey of neuropathological reports. Arch Gerontol Geriatr 49:146–149. 10.1016/j.archger.2008.06.005 - DOI - PubMed
    1. Chang CW, Shao E, Mucke L (2021) Tau: enabler of diverse brain disorders and target of rapidly evolving therapeutic strategies. Science 371:eabb8255. 10.1126/science.abb8255 - DOI - PMC - PubMed
    1. Cheng IH, Scearce-Levie K, Legleiter J, Palop JJ, Gerstein H, Bien-Ly N, Puoliväli J, Lesné S, Ashe KH, Muchowski PJ, Mucke L (2007) Accelerating amyloid-beta fibrillization reduces oligomer levels and functional deficits in Alzheimer disease mouse models. J Biol Chem 282:23818–23828. 10.1074/jbc.M701078200 - DOI - PubMed
    1. Chin J, Palop JJ, Puoliväli J, Massaro C, Bien-Ly N, Gerstein H, Scearce-Levie K, Masliah E, Mucke L (2005) Fyn kinase induces synaptic and cognitive impairments in a transgenic mouse model of Alzheimer’s disease. J Neurosci 25:9694–9703. 10.1523/JNEUROSCI.2980-05.2005 - DOI - PMC - PubMed