. 2021 Apr 13;118(15):e2016432118.
doi: 10.1073/pnas.2016432118.

Cholinergic suppression of hippocampal sharp-wave ripples impairs working memory

Affiliations

Cholinergic suppression of hippocampal sharp-wave ripples impairs working memory

Yiyao Zhang et al. Proc Natl Acad Sci U S A. .

Abstract

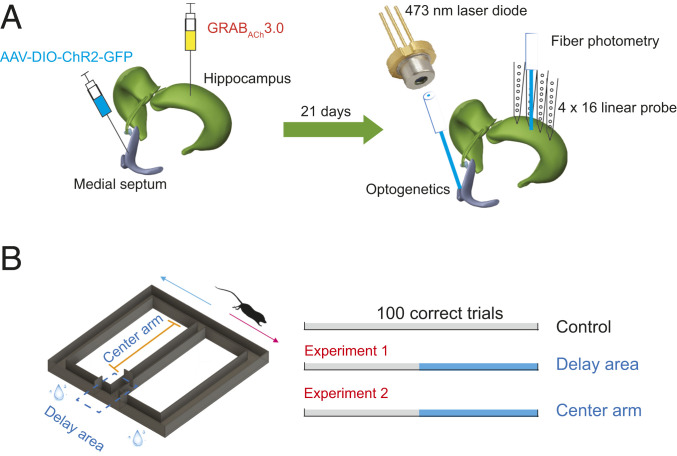
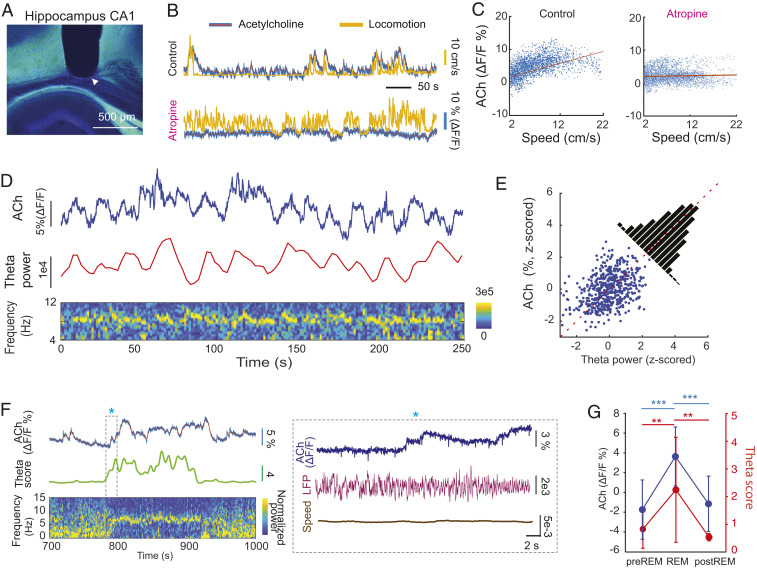
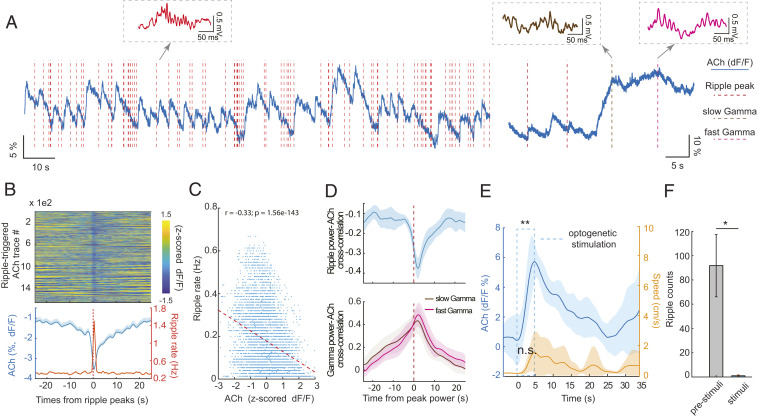
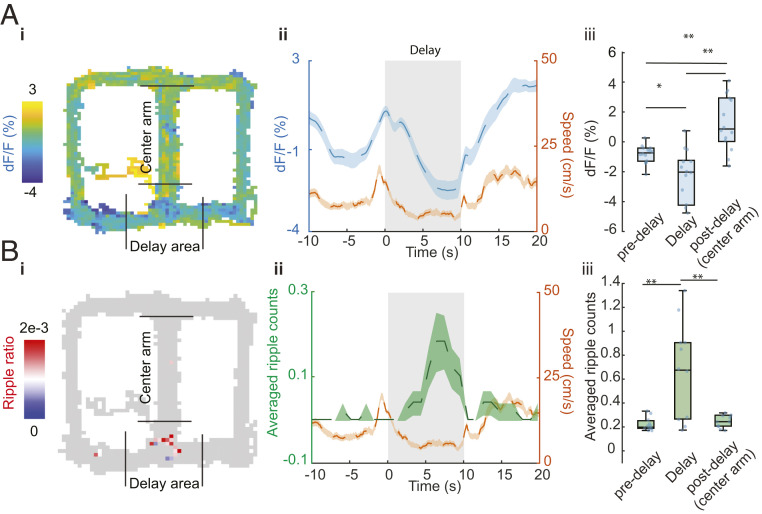
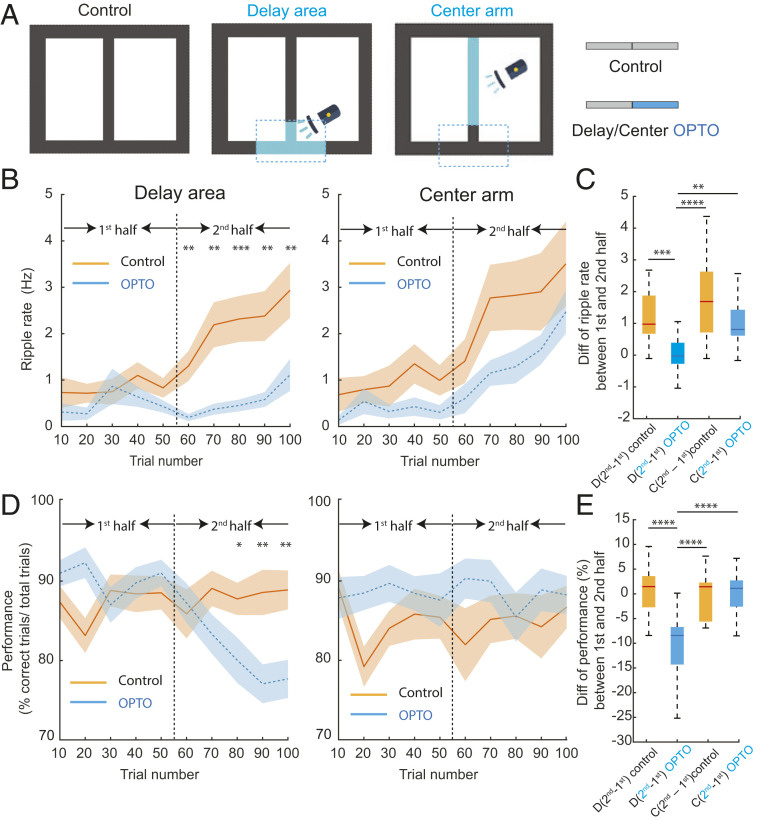
Learning and memory are assumed to be supported by mechanisms that involve cholinergic transmission and hippocampal theta. Using G protein-coupled receptor-activation-based acetylcholine sensor (GRABACh3.0) with a fiber-photometric fluorescence readout in mice, we found that cholinergic signaling in the hippocampus increased in parallel with theta/gamma power during walking and REM sleep, while ACh3.0 signal reached a minimum during hippocampal sharp-wave ripples (SPW-R). Unexpectedly, memory performance was impaired in a hippocampus-dependent spontaneous alternation task by selective optogenetic stimulation of medial septal cholinergic neurons when the stimulation was applied in the delay area but not in the central (choice) arm of the maze. Parallel with the decreased performance, optogenetic stimulation decreased the incidence of SPW-Rs. These findings suggest that septo-hippocampal interactions play a task-phase-dependent dual role in the maintenance of memory performance, including not only theta mechanisms but also SPW-Rs.

Keywords: cholinergic; hippocampus; sharp-wave ripples; theta; working memory.


Conflict of interest statement

The authors declare no competing interest.

Figures

Fig. 1.
Fig. 1.
Experimental design. (A) GRABACh3.0 (ACh3.0) virus was injected in hippocampal CA1 area (ACh fiberphotometry) in ChAT-Cre transgenic and C57/B6 mice, and AAV-DIO-ChR2-GFP was injected in medial septum of ChAT-Cre transgenic mice (optogenetics). After 21 d of virus injection, optical fiber was implanted in the medial septum for optogenetic activation of cholinergic neurons. Optical fiber for photometric measurement and silicon probe for electrophysiological recording were implanted in the hippocampal CA1 region. (B) Mice were trained to learn a hippocampus-dependent figure-eight–maze task. They were rewarded each time they reached the end of side maze arms in the correct task sequence (center-left-center-right-center, and so on). Between choices, they were confined in the start (delay) area for 10 s. Optogenetic stimulation was administered in the delay area or center arm.
Fig. 2.
Fig. 2.
Behavior dependence of cholinergic activation in the hippocampus. (A) Track of optic fiber above the CA1 region of the hippocampus (tip is marked by white arrowhead). The ACh3.0 sensor was expressed in the hippocampal neurons by AAVs to allow detection of ACh dynamics in vivo. (B) An example ACh3.0 fluorescence signal, measured by fiber photometry, and movement recorded during spontaneous activity before (Top) and after intraperitoneal atropine injection (25 mg/kg; Bottom). (C, Left) The correlation between ACh3.0 fluorescence signal and speed of locomotion (Pearson correlation coefficient r = 0.64, P = 0). (C, Right) The correlation between ACh3.0 signal and speed of locomotion after atropine system injection (r = 0.06, P = 0). (D) The relationship between ACh3.0 signal and integrated theta oscillation power during spontaneous behavior. (D, Bottom) Time-resolved power spectrogram of hippocampal LFP. (E) The correlation between ACh3.0 fluorescence signal and theta power (r = 0.361, P = 4.55 × 10⁻¹⁸). (F) The relationship between ACh3.0 signal and theta oscillation score ( Materials and Methods) during REM sleep. The transition between non-REM and REM (asterisk) is shown at a higher time resolution in the Right. (G) ACh3.0 signal (Left y axis) increases during theta-rich REM sleep (theta score; Right y axis) compared to equal lengths of non-REM epochs before and after REM sleep. (n = 18 REM episodes in four mice; one-way ANOVA; theta score: P = 0.0007, ACh: P < 0.0001; Holm–Sadik’s multiple comparison test. Theta score: pre-REM (0.83 ± 0.69), REM (2.25 ± 1.90), and post-REM (0.54 ± 0.13), ACh3.0 fluorescent value: pre-REM (−1.73 ± 3%), REM (3.64 ± 3%), post-REM (1.15 ± 2.79%). **P < 0.01; ***P <0.001.
Fig. 3.
Fig. 3.
SPW-Rs occur when hippocampal cholinergic activation transiently decreases during slow wave sleep (SWS). (A) Example traces of ACh3.0 signal fluctuation (blue line) and SPW-R occurrence (red vertical dashed lines) during non-REM (Left) and non-REM–waking transient (Right). Examples of SPW-R, slow (brown) and fast gamma epochs (purple), extracted from the simultaneously recorded LFP, are shown as insets. (B, Top) Color-coded, normalized change of ACh3.0 signal surrounding SPW-Rs during non-REM sleep (n > 1,600 SPW-Rs from 4 non-REM sessions, single mouse). (B, Bottom) Mean change (± SEM) of ACh3.0 (blue) and ripple rate (orange) centered on the peak power timing of ripple events. (C) The relationship between ACh3.0 signal and ripple rate (n = 10 sessions in four mice). (D, Top) Cross-correlations between ACh3.0 signal and continuous ripple-band–filtered (140 to 250 Hz) LFP power in 0.5 s epochs (from six non-REM sleep sessions in three mice). (D, Bottom) Cross-correlation between ACh3.0 signal and continuous gamma-band–filtered (30 to 80 Hz slow gamma and 80 to 120 Hz fast gamma) LFP power (from six waking sessions in four mice). (E) Time course of optogenetically induced ACh3.0 signal during sleep. Medial septum was optogenetically stimulated by 5 s long pulses during non-REM sleep. ACh3.0 signal increased significantly during stimulation (0.48 ± 1.4% prior to stimulation; 5.95 ± 0. 83% by the end of stimulation; **P = 0.004, two-tail paired test, n = 7 trials). Movement (Right y axis) occurred on some trials, but overall, it did not change significantly during stimulation (P = 0.052, two-tail paired t test). (F) Optogenetic stimulation of cholinergic medial septal neurons suppressed SPW-R occurrence during non-REM sleep (paired t test: *P = 0.04, n = 4 mice). *P < 0.05.
Fig. 4.
Fig. 4.
The relationship between ACh3.0 signal and SPW-Rs during spontaneous alternation behavior. (A) ACh3.0 fluorescence change during figure-eight–maze task. (i: ACh3.0 fluorescence signal on the maze, ii: Running in central and side arms and staying in the delay area show differential ACh signal modulation. n = 50 trials in an example session; mean ± SEM, iii: Group statistic of ACh3.0 signal for predelay area (−0.12 ± 0.64%), delay area (−2.42 ± 3.62%), and postdelay area (2.1 ± 1.9%). n = 14 sessions from four mice, P = 0.0006, one-way ANOVA, post hoc *P < 0.05; **P < 0.01; Holm–Sidak’s multiple comparison test. (B) SPW-Rs distribution during T-maze task. i: Example session of SPW-Rs distribution on the maze, ripple ratio: averaged ripple counts per bin (1 cm2). ii: Peri-delay area averaged ripple counts and locomotion results change during maze task. Speed signal is the same as in A. n = 50 trials. iii: Group statistics of average ripple counts in the predelay area (0.05 ± 0.06), delay area (0.56 ± 0.45), and postdelay area (0.10 ± 0.09). n = 11 sessions from 3 mice, P = 0.0022, one-way ANOVA, post hoc **P < 0.01; Holm–Sidak’s multiple comparison test.
Fig. 5.
Fig. 5.
Cholinergic activation during delay area between choices suppresses SPW-Rs and impairs spatial working memory but not activation during center arm. (A) An illustration of task protocol (100 correct trials total). Control: no stimulation sessions, Delay sti: cholinergic stimulation (OPTO) during the last 50 trials in delay area (Blue) in delay sessions. Center sti: cholinergic stimulation during last 50 trials in the center arm (OPTO). (B) SPW-R rate (ripple rate) during the first half (1 to 50 correct trials) and second half (51 to 100 correct trials in no stimulation (Control) and optogenetic stimulation (OPTO) sessions in the delay area (Left ) or center arm (Right). Averages across all sessions (mean ± SEM). Note the steady increase in SPW-R rate during Control sessions and decreased SPW-R during OPTO stimulation in the delay area and continued increase in session with OPTO stimulation in the central arm. Control versus OPTO: Unpaired t test, *P < 0.05; **P < 0.01; ***P < 0.001. (C) Comparison of SPW-R rate difference between the first and second halves of trials in Control and OPTO stimulation sessions in the delay area (D) or central arm (C). One-way ANOVA: P < 0.0001, post hoc Holm–Sidak’s multiple comparison tests: *P < 0.05; **P < 0.01; ***P < 0.001, ****P < 0.0001. D(second − first)control = 1.39 ± 1.22 Hz, D(second − first)OPTO = −0.0009 ± 0.68 Hz, C(second − first)control = 1.74 ± 1.45 Hz, C(second − first)OPTO = 1.09 ± 0.85 Hz, mean ± SD. (D) Behavioral performance during the first half (1 to 50 correct trials) and second half (51 to 100 correct trials) in no stimulation (Control) and optogenetic stimulation (OPTO) sessions in the delay area (Left) or center arm (Right). Averages across all sessions and mice (mean ± SEM). Note the deterioration of memory performance during OPTO stimulation in the delay area. Control versus OPTO: Unpaired t test, *P < 0.05; **P < 0.01. (E) Comparison of behavioral performance difference between the first and second halves of trials in Control and OPTO stimulation sessions in the delay area (D) or central arm (C). One-way ANOVA: P < 0.0001, post hoc Holm–Sidak’s multiple comparison test: *P < 0.05; **P < 0.01; ***P < 0.001, ****P < 0.0001. D(second − first)control = 0.63 ± 5.23%, D(second − first)OPTO = −10 ± 6.91%, C(second − first)control = −0.10 ± 4.62%, C(second − first)OPTO = 0.16 ± 4.17%, mean ± SD.

Similar articles

Cited by

References

    1. Buzsáki G., Two-stage model of memory trace formation: A role for “noisy” brain states. Neuroscience 31, 551–570 (1989). - PubMed
    1. Hasselmo M. E., Neuromodulation: Acetylcholine and memory consolidation. Trends Cogn. Sci. 3, 351–359 (1999). - PubMed
    1. Atri A., et al. ., Blockade of central cholinergic receptors impairs new learning and increases proactive interference in a word paired-associate memory task. Behav. Neurosci. 118, 223–236 (2004). - PubMed
    1. Coyle J. T., Price D. L., DeLong M. R., Alzheimer’s disease: A disorder of cortical cholinergic innervation. Science 219, 1184–1190 (1983). - PubMed
    1. Sitaram N., Weingartner H., Gillin J. C., Human serial learning: Enhancement with arecholine and choline impairment with scopolamine. Science 201, 274–276 (1978). - PubMed

Publication types

LinkOut - more resources