. 2021 Apr 9;372(6538):eabd0875.
doi: 10.1126/science.abd0875.

QSER1 protects DNA methylation valleys from de novo methylation

Affiliations

QSER1 protects DNA methylation valleys from de novo methylation

Gary Dixon et al. Science. .

Abstract

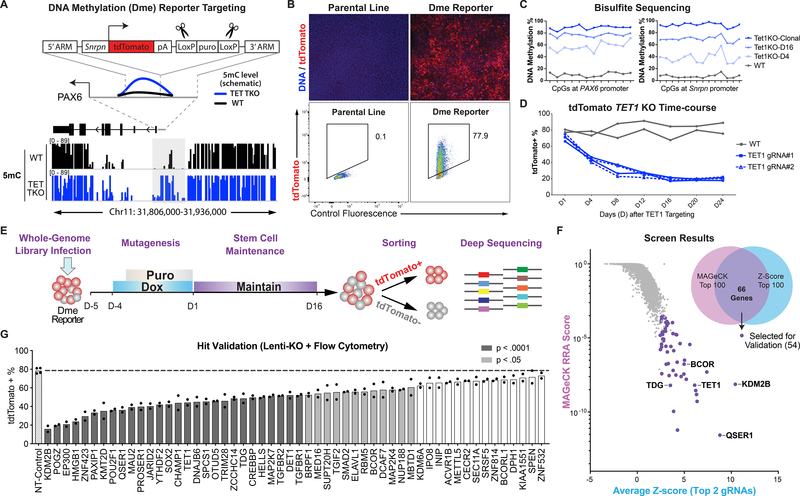
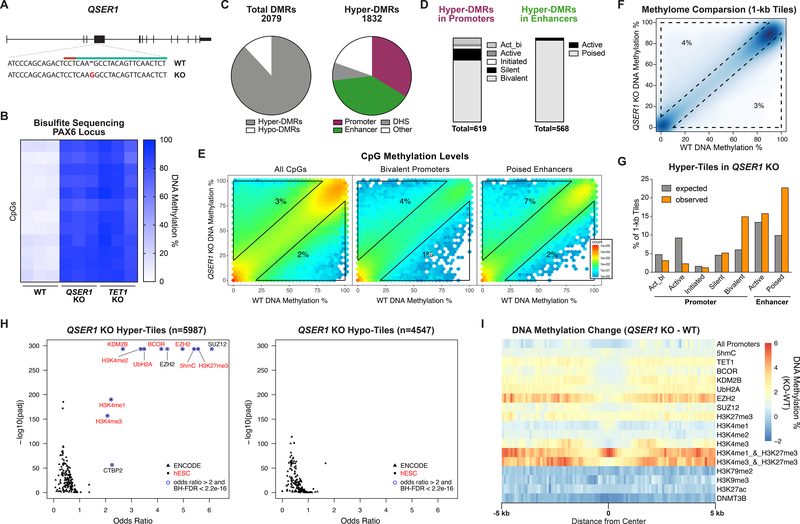
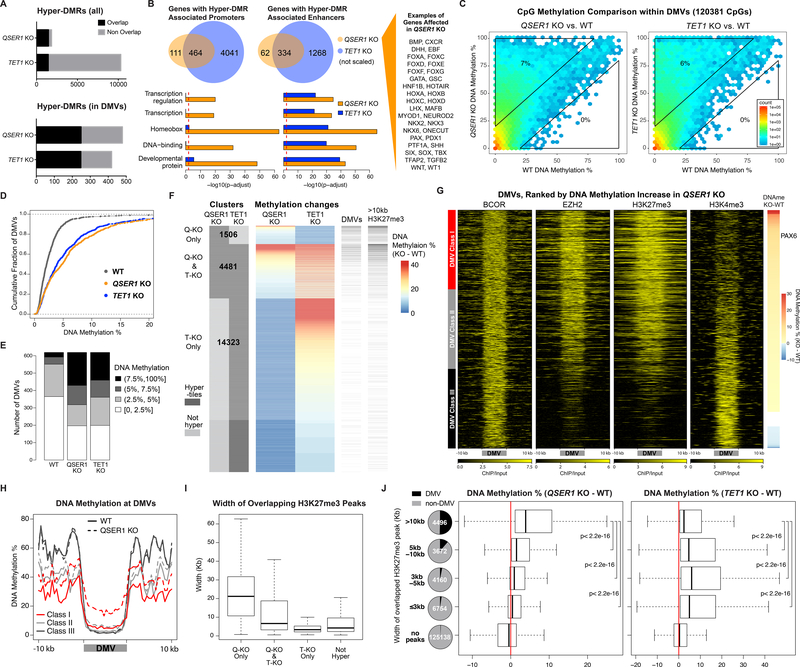
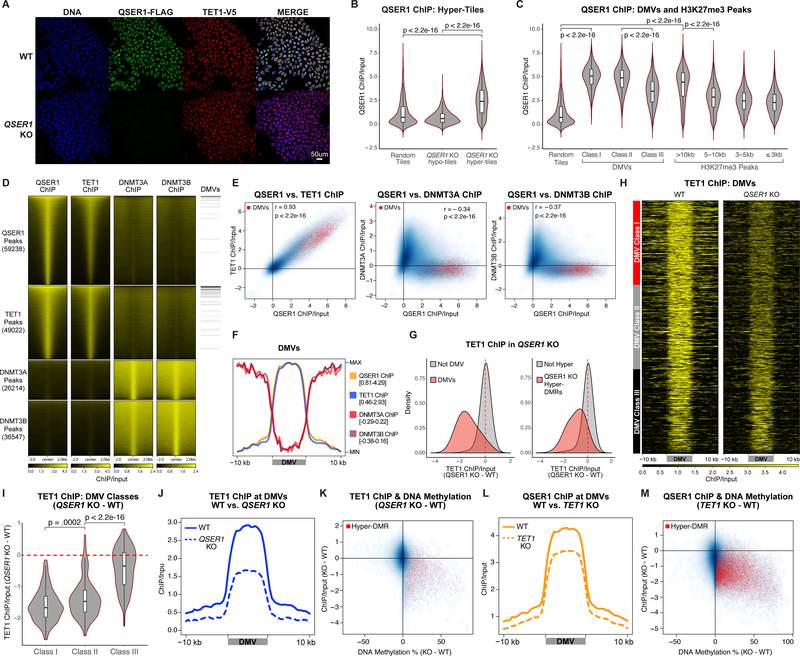
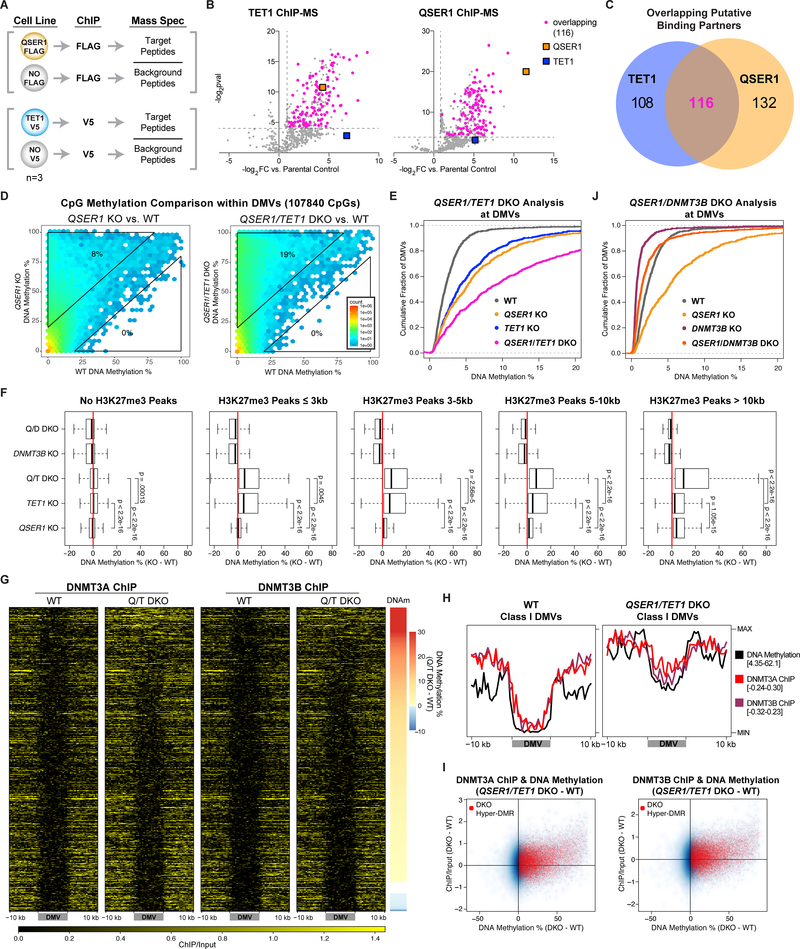
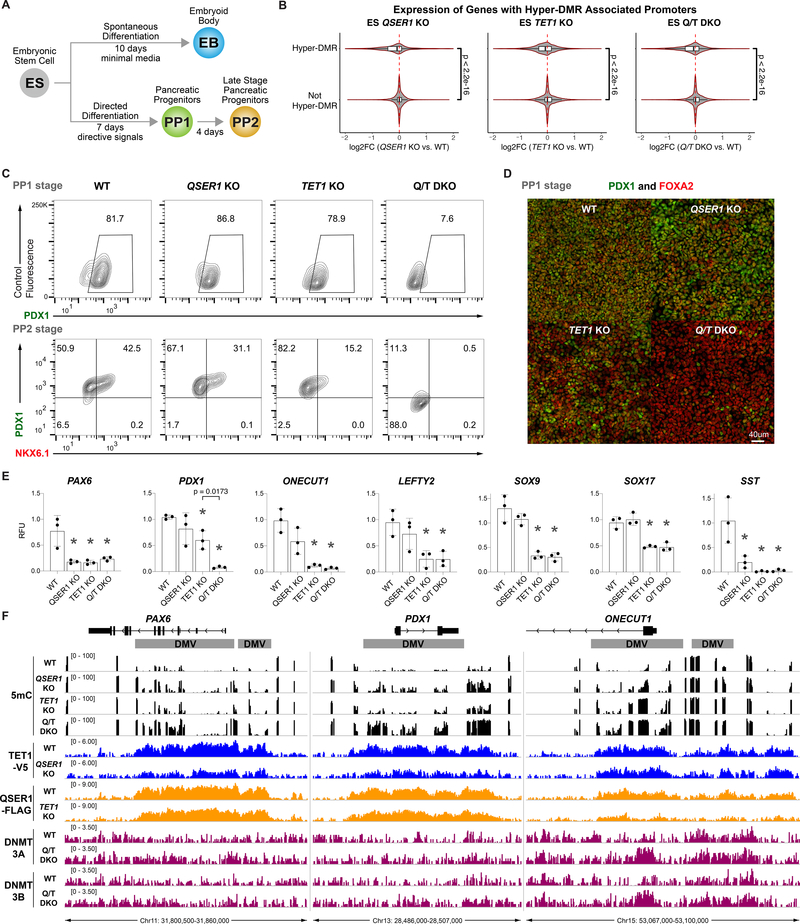
DNA methylation is essential to mammalian development, and dysregulation can cause serious pathological conditions. Key enzymes responsible for deposition and removal of DNA methylation are known, but how they cooperate to regulate the methylation landscape remains a central question. Using a knockin DNA methylation reporter, we performed a genome-wide CRISPR-Cas9 screen in human embryonic stem cells to discover DNA methylation regulators. The top screen hit was an uncharacterized gene, QSER1, which proved to be a key guardian of bivalent promoters and poised enhancers of developmental genes, especially those residing in DNA methylation valleys (or canyons). We further demonstrate genetic and biochemical interactions of QSER1 and TET1, supporting their cooperation to safeguard transcriptional and developmental programs from DNMT3-mediated de novo methylation.


Conflict of interest statement

Competing interests: C.H. is an inventor on patent/patent application (US-8741567-B2) held/submitted by The University of Chicago that covers 5hmC-Seal. 5hmC-Seal has been licensed to Active Motif and Epican by the University of Chicago. C.H. is a shareholder of Epican Genetech, a scientific founder and scientific advisory board member of Accent Therapeutics, Inc. O.E. advises and holds equity in Owkin, Freenome, One Three Biotech and Volastra Therapeutics.

Figures

Fig. 1.
Fig. 1.
A genome-wide CRISPR/Cas screen for regulators of DNA Methylation. (A) Knockin strategy for generating iCas9;PAX6-DmetdTom reporter in reference to DNA methylation at PAX6 locus from Whole Genome Bisulfite Sequencing in WT (black) and TET TKO (blue) hESCs (14). LoxP-flanked puromycin was excised with transient expression of Cre recombinase. (B) Immunofluorescence staining (with anti-RFP antibody) and flow cytometry for tdTomato expression. (C) Bisulfite sequencing of PAX6 promoter and inserted Snrpn promoter. TET1KO-D4 and D16 denote KO using lentivirus expressing TET1_gRNA#1 where cells were collected on day 4 (D4) or day 16 (D16). Day 1 (D1) denotes 5 days after doxycycline treatment. (D) Summary of flow cytometry of lentivirus TET1 KO cells. (E) Screen schematic: doxycycline induction for Cas9 expression and puromycin selection for integration of lentiviruses. (F) Screen results: MAGeCK RRA score vs. average of two highest Z-scores for each gene. Venn diagram indicates overlap between top 100 genes in each ranking method. Genes selected for validation and selected top hits are highlighted. (G) Summary of flow cytometry of 54 lines expressing gRNAs targeting genes for validation compared to non-targeting control line (n=2). P values = one-way ANOVA followed by Dunnet multiple comparisons test.
Fig. 2.
Fig. 2.
QSER1 protects bivalent promoters and poised enhancers against hypermethylation. (A) Schematic illustrating QSER1 targeting, 20-nt CRISPR sequence (green), PAM sequence (red), and mutation introduced (red letter). (B) Heatmap of DNA methylation levels at PAX6 promoter (n=3; chr11:31,840,696–31,840,802) from amplicon bisulfite sequencing. (C) Left: relative quantities of hyper- and hypo-DMRs. Right: relative quantities of hyper-DMRs that overlap with indicated genomic features. (D) Bar plots showing relative quantities of hyper-DMRs that overlap with each promoter or enhancer type. (E) Hexagon plots showing methylation levels for all CpGs (n=2986165), CpGs within bivalent promoters (n=283258), and CpGs within poised enhancers (n=103153) in QSER1 KO vs. WT. (F) 1-kb tile plot showing methylation levels for QSER1 KO vs. WT. (G) Bar plot showing percent of all tiles (expected) or hyper-tiles (observed in QSER1 KO) overlapped with each genomic region. (H) Enrichment of QSER1 KO hyper- or hypo-tiles in transcription factor binding sites and histone modifications. Data from aggregate of ENCODE ChIP-seq (49) and ChIP-seq in hESCs are indicated by triangles and circles, respectively, and listed in Table S6. (I) DNA methylation difference (QSER1 KO vs. WT) around promoters, peaks of designated ChIP-seq, and 5hmC-Seal. Window extends 5 kb from region center (binned 100 bp).
Fig. 3.
Fig. 3.
QSER1 and TET1 protect DNA methylation valleys. (A) Total and overlapping hyper-DMRs between QSER1 KO and TET1 KO. (B) Venn diagrams representing genes with hyper-DMR associated Promoters (left) or enhancers (right). Bar plots represent pathway enrichment analysis. Red line represents FDR cutoff 0.01. (C) Hexagon plots showing CpG methylation inside DMVs (KO vs. WT). (D) Cumulative fraction of DMVs according to average methylation of each DMV. (E) Bar plot showing DMVs in designated range of average methylation. (F) DNA methylation change at QSER1 KO and TET1 KO hyper-tiles. Number of hyper-tiles in each category is indicated. DMVs and broad H3K27me3 peak overlap are indicated. (G) Heatmaps of ChIP-seq signals (log2 ratio vs. input) at DMVs ranked by methylation increase in QSER1 KO. (H) Meta-signal plots of DNA methylation at DMV Classes and 10kb flanking regions for WT and QSER1 KO. (I-J) Box plots showing average width of H3K27me3 peaks that overlap with designated hyper-tiles and methylation difference (KO-WT) for tiles that overlap with designated H3K27me3 peaks. In box plots here and later, edges refer to the upper/lower quartiles and whiskers represent 1.5 interquartile range beyond edges; Mann-Whitney U-test was conducted. Pie charts show percentage of tiles that overlap with DMVs.
Fig. 4.
Fig. 4.
Genomic occupancy of QSER1, TET1 and DNMT3A/3B. (A) QSER1–3XFLAG and TET1-V5 Immunofluorescence staining. (B-C) Violin plots quantifying QSER1 ChIP-seq signal at 1-kb tiles that overlap with the regions specified and random tiles (n=5,000). In all box plots inside violin plots here and later, edges refer to the upper/lower quartiles and whiskers represent 1.5 interquartile range beyond edges; Mann-Whitney U-test was conducted. (D) Heatmaps representing ChIP-seq signals at corresponding peaks. Peaks overlapping with DMVs are indicated. (E) 1-kb plots showing ChIP-seq signals correlation. Tiles overlapping with DMVs are red. (F) Meta-signal plot of ChIP-seq signals at DMVs. Min and Max values are indicated. (G) Density plots showing TET1 binding difference (QSER1 KO – WT) at DMV (left) or QSER1 KO hyper-DMR (right) overlapping tiles compared to control. (H) Heatmaps of TET1 binding at DMVs in WT and QSER1 KO ranked by methylation increase in QSER1 KO. (I) Differential TET1 binding (QSER1 KO – WT) at the three classes of DMVs. (J, L) Meta-signal plots of ChIP-seq signals at DMVs. (K, M) 1-kb plots comparing ChIP-seq signal change vs. methylation change (KO – WT). Tiles that overlap with KO hyper-DMRs are highlighted in red.
Fig. 5.
Fig. 5.
QSER1 and TET1 cooperate to inhibit DNMT3A/3B binding. (A) Schematic of ChIP-MS experiments. (B) Volcano plots showing identified and overlapping proteins in QSER1–3XFLAG and TET1-V5 IPs for ChIP-MS. Dotted lines represent the fold change and p value cutoffs for significantly enriched proteins. (C) Venn diagram showing the overlap of significantly enriched proteins in both IPs for ChIP-MS. (D) Hexagon plots showing methylation levels of CpGs inside DMVs for each KO or DKO compared to WT. (E, J) Cumulative fraction of DMVs plotted according to average methylation of each DMV. (F) Methylation difference (KO-WT) of 1-kb tiles that overlap with designated H3K27me3 peaks for specified genotypes. (G) Heatmaps of DNMT3A/3B ChIP-seq signals at DMVs in WT and QSER1/TET1 DKO ranked by methylation increase in DKO. (H) Meta-signal plots of ChIP-seq signals for DNMT3A/3B and DNA methylation levels at Class I DMVs in WT and QSER1/TET1 DKO. (I) 1-kb plots comparing ChIP-seq signal change vs. methylation change (QSER1/TET1 DKO – WT). Tiles that overlap with QSER1/TET1 DKO hyper-DMRs are highlighted in red.
Fig. 6.
Fig. 6.
QSER1 and TET1 safeguard transcriptional and developmental programs. (A) Schematic showing strategy of differentiation of hESCs. (B) Violin plots showing log2 fold change of expression (KO vs. WT) in ES stage for genes with or without hyper-DMR associated promoters for specified genotypes. (C) Representative flow cytometry plots for PDX1 and NKX6.1 expression at PP1 and PP2 stages. Two clonal lines each from WT, QSER1 KO, TET1 KO, and three QSER1/TET1 DKO clonal lines were used in 2–3 independent differentiation experiments each. (D) Representative immunofluorescence staining of PDX1 and FOXA2 at PP1 for specified genotypes. (E) Quantitative real-time PCR results, shown in relative fluorescence units (RFU) relative to one WT replicate, for selected DEGs at PP1 (genes overlapping with DMVs are ONECUT1, PAX6, PDX1, SOX9, SOX17). Data are mean +/− SD (n=3). Star denotes p < .05 by one-way ANOVA followed by Dunnet multiple comparisons test vs. WT control. (F) DNA methylation (black), TET1 ChIP-seq (blue), QSER1 ChIP-seq (orange), and DNMT3A/3B ChIP-seq (magenta) for designated genotypes at selected genes. Hg19 coordinates are shown along with DMV regions (grey).

Comment in

References

    1. Goll MG, Bestor TH, Eukaryotic cytosine methyltransferases. Annu Rev Biochem 74, 481–514 (2005). - PubMed
    1. Smith ZD, Meissner A, DNA methylation: roles in mammalian development. Nat Rev Genet 14, 204–220 (2013). - PubMed
    1. Schmitz RJ, Lewis ZA, Goll MG, DNA Methylation: Shared and Divergent Features across Eukaryotes. Trends Genet 35, 818–827 (2019). - PMC - PubMed
    1. Greenberg MVC, Bourc’his D, The diverse roles of DNA methylation in mammalian development and disease. Nat Rev Mol Cell Biol 20, 590–607 (2019). - PubMed
    1. Luo C, Hajkova P, Ecker JR, Dynamic DNA methylation: In the right place at the right time. Science 361, 1336–1340 (2018). - PMC - PubMed

Publication types

MeSH terms