. 2021 Apr 8;12(1):2111.
doi: 10.1038/s41467-021-22217-w.

Smc5/6 functions with Sgs1-Top3-Rmi1 to complete chromosome replication at natural pause sites

Affiliations

Smc5/6 functions with Sgs1-Top3-Rmi1 to complete chromosome replication at natural pause sites

Sumedha Agashe et al. Nat Commun. .

Abstract

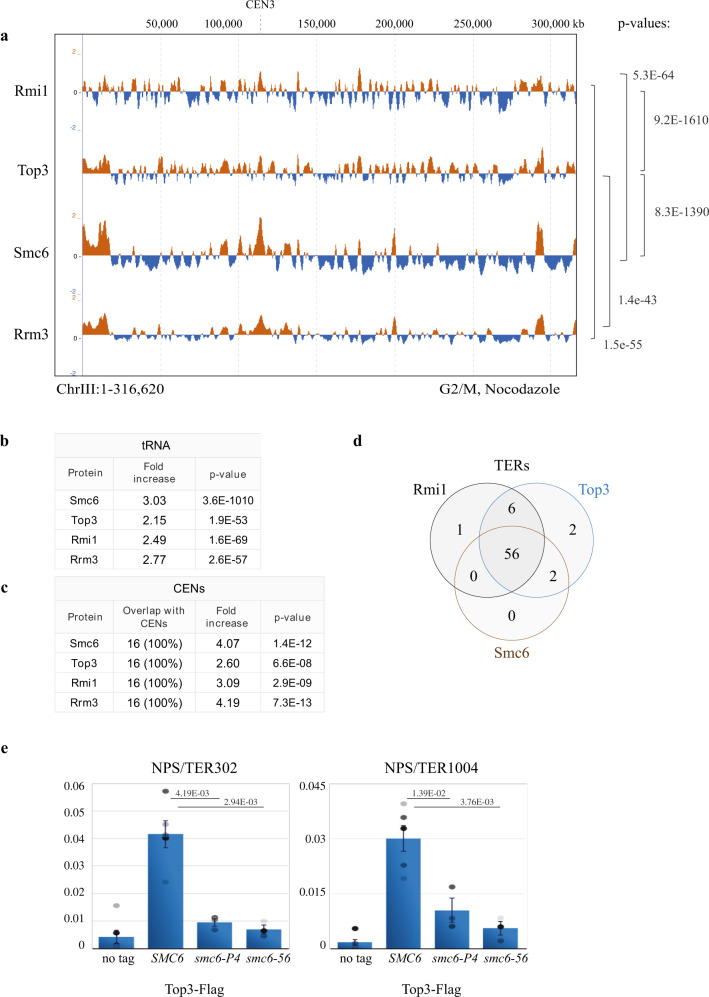
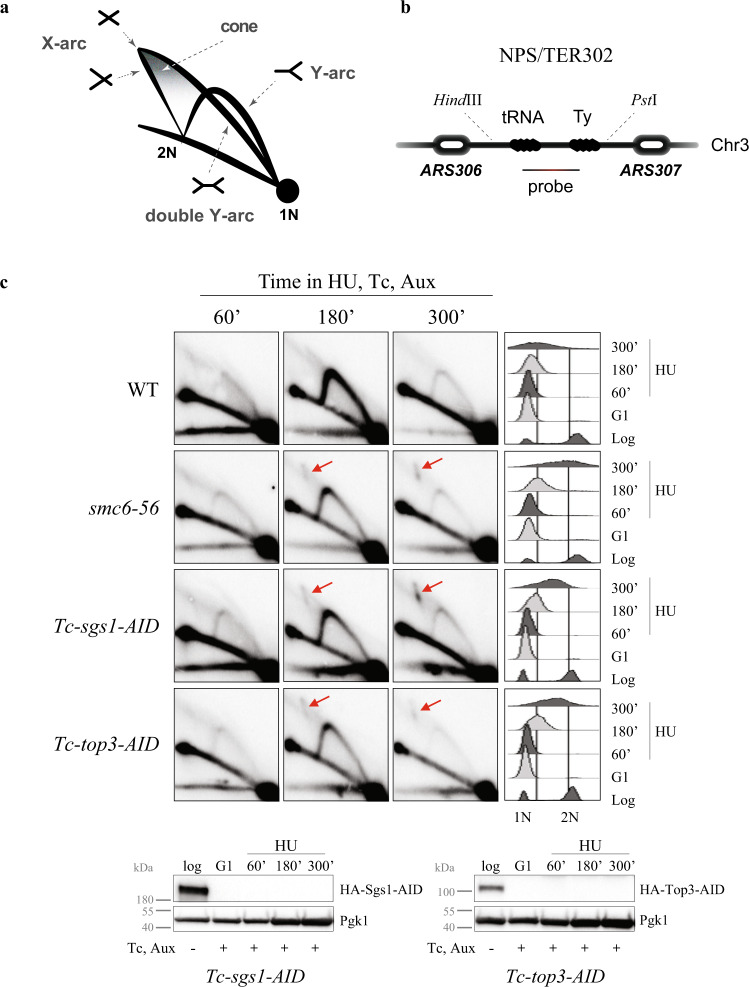
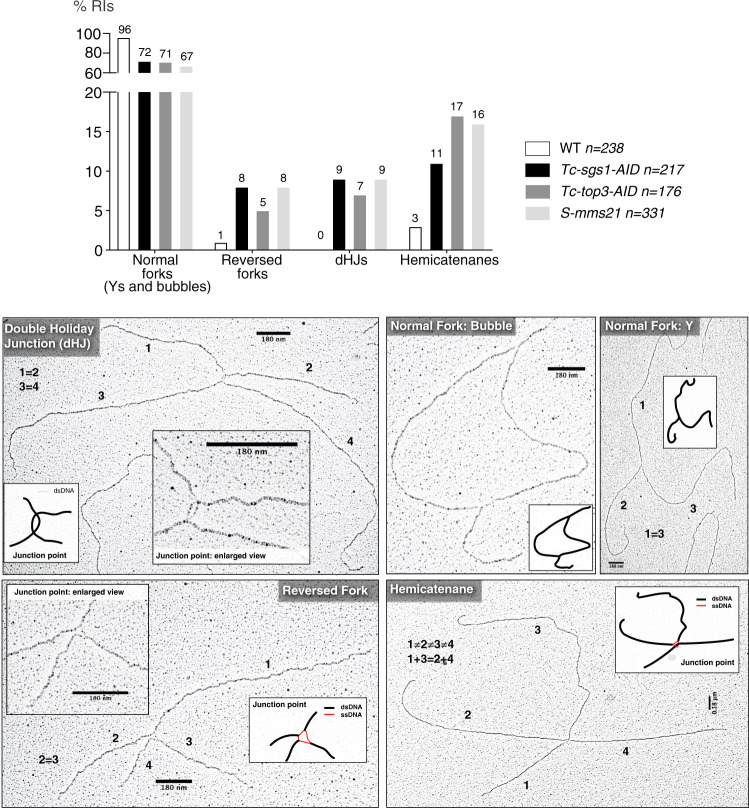
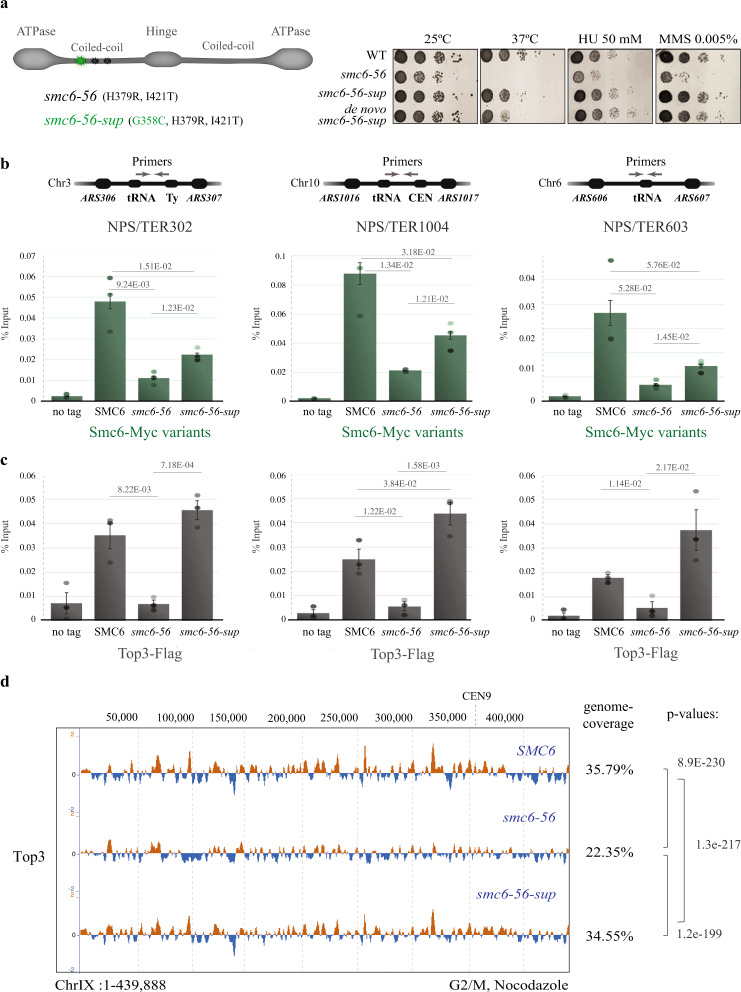
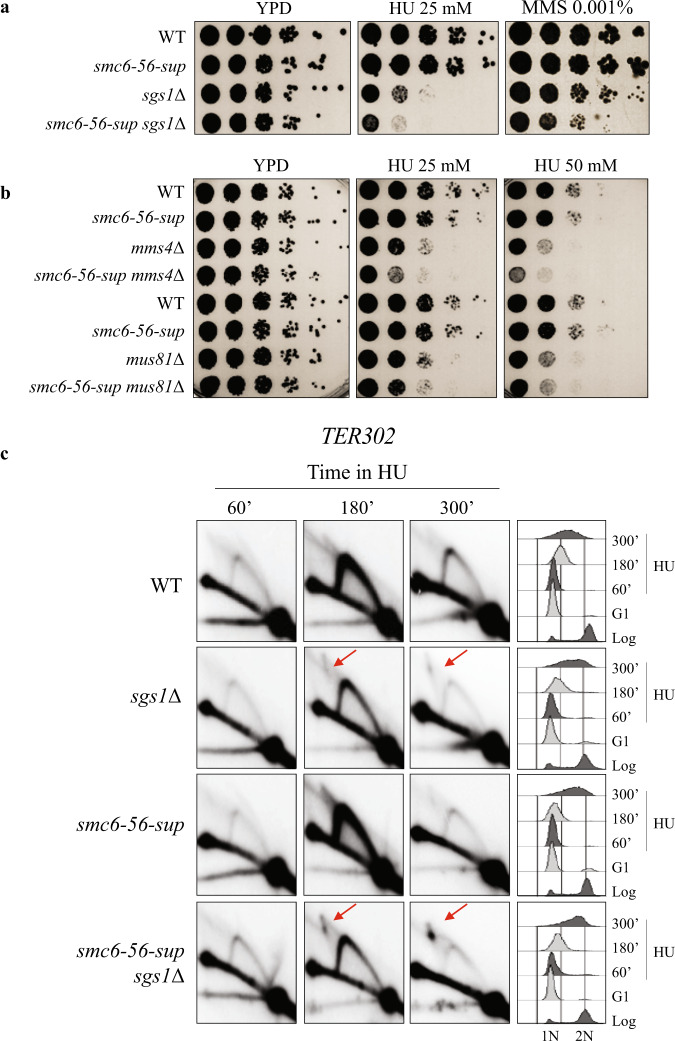
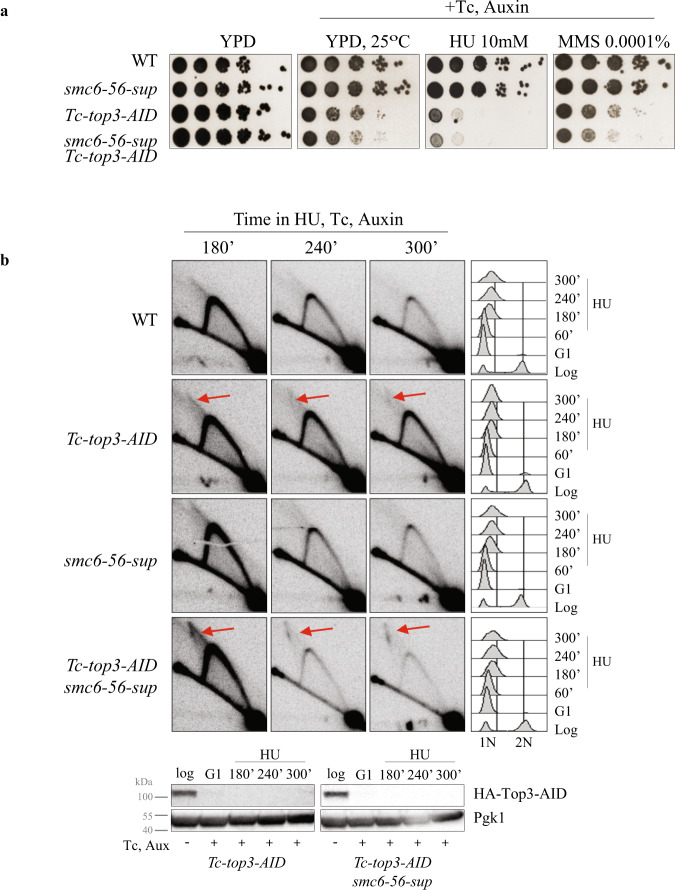
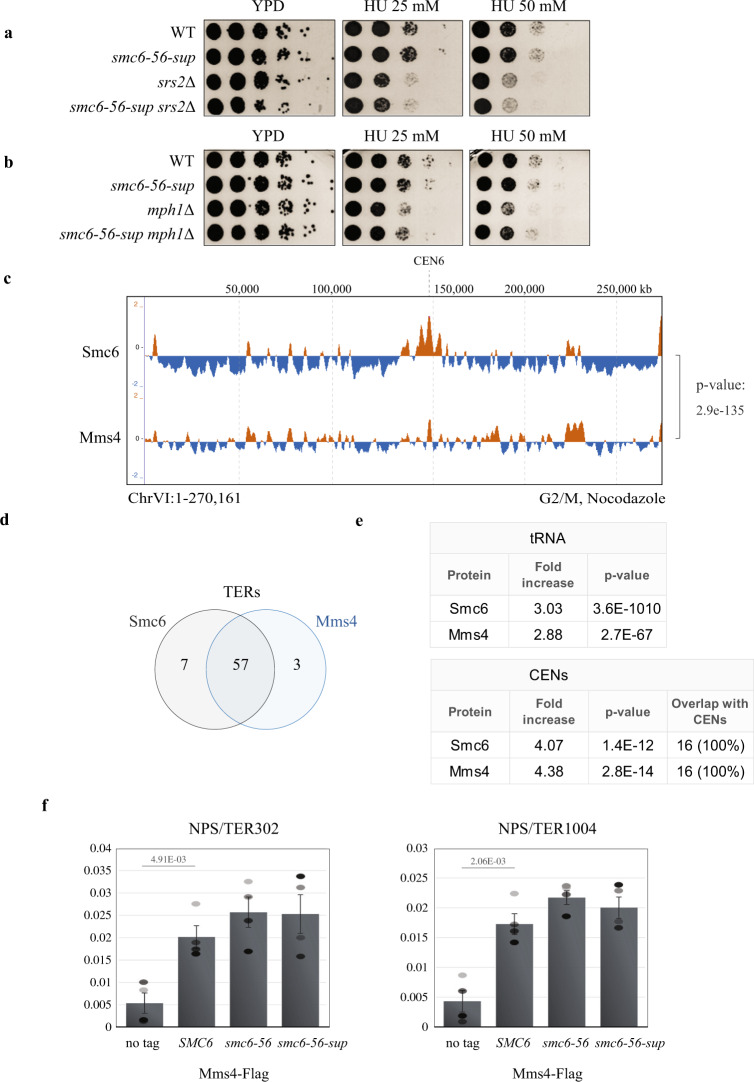
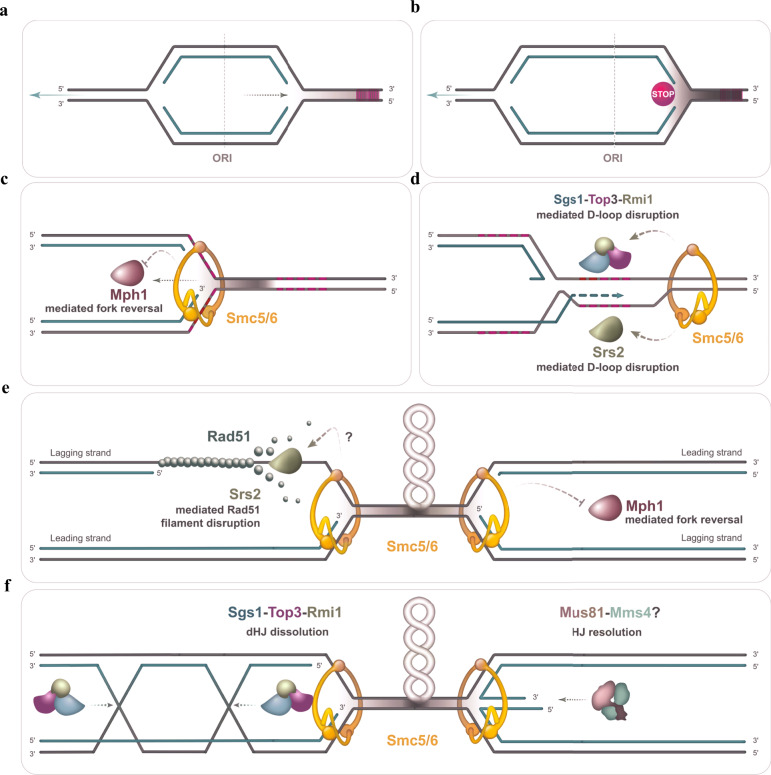
Smc5/6 is essential for genome structural integrity by yet unknown mechanisms. Here we find that Smc5/6 co-localizes with the DNA crossed-strand processing complex Sgs1-Top3-Rmi1 (STR) at genomic regions known as natural pausing sites (NPSs) where it facilitates Top3 retention. Individual depletions of STR subunits and Smc5/6 cause similar accumulation of joint molecules (JMs) composed of reversed forks, double Holliday Junctions and hemicatenanes, indicative of Smc5/6 regulating Sgs1 and Top3 DNA processing activities. We isolate an intra-allelic suppressor of smc6-56 proficient in Top3 retention but affected in pathways that act complementarily with Sgs1 and Top3 to resolve JMs arising at replication termination. Upon replication stress, the smc6-56 suppressor requires STR and Mus81-Mms4 functions for recovery, but not Srs2 and Mph1 helicases that prevent maturation of recombination intermediates. Thus, Smc5/6 functions jointly with Top3 and STR to mediate replication completion and influences the function of other DNA crossed-strand processing enzymes at NPSs.


Conflict of interest statement

The authors declare no competing interests.

Figures

Fig. 1
Fig. 1. STR clusters are enriched at NPSs and co-localize with Smc5/6.
a ChIP-on-chip profile of Rmi1-Flag, Top3-Flag, Smc6-Flag and Rrm3-Flag from G2/M-synchronized cells. Chr III is shown as example. The indicated p-values (one-tailed Fisher’s exact test) relate to the genome-wide overlap between the considered protein clusters. Evaluation of the significance of overlap between the binding clusters of different proteins was performed by confrontation against a null hypothesis model generated with a Montecarlo-like simulation where the “score” for both the randomized positions and the actual data was calculated as the total number of overlapping bases among the whole clusters. The significance of correlation was scored using a one-tailed Fisher’s exact test described in detail in the Supplemental Statistical Analysis document in ref. . b Analysis of overlap between specific types of elements found at NPSs and clusters of the indicated proteins shows that similar to Smc5/6 and Rrm3, Top3 and Rmi1 are enriched at tRNAs genes. The table reports the fold increase of each protein at tRNA genes, calculated versus the ones expected for random binding, and the p-values (one-tailed Fisher’s exact test) of significance (see legend of panel a). c As in b, but for centromeres (CENs). d Smc5/6, Top3 and Rmi1 are enriched at NPSs that serve as termination sites (TERs) in G2/M. Values of overlap and non-overlap between the protein clusters are shown. e ChIP-qPCR profile of Top3-Flag from G2/M-synchronized WT and smc6-56, smc6-P4 cells at different TER regions. The plotted mean value is derived from three biological replicates for smc6-56 and smc6-P4 and six biological replicates for no tag and Top3-Flag. Data are presented as mean value ± SEM. The indicated p-values were calculated by unpaired two-sided t-test. See also Supplementary Figs. 1 and 2. Source data are provided as a Source Data file.
Fig. 2
Fig. 2. STR and Smc5/6 prevent joint molecule accumulation at stalled replication forks and termination regions.
a Schematic representation of replication intermediates arising at termination regions as observed by 2D gel electrophoresis. The migration pattern of different replication intermediates referred to in the text is illustrated. b Schematic representation of the NPS302/TER302 region analysed by 2D gel electrophoresis. c Visualization of replication intermediates by 2D gel electrophoresis from cells of the indicated genotype synchronously released from G1 in media containing 200 mM HU, as well as Auxin (Aux) and Tetracycline (Tc). FACS profiles indicated on the right show cell cycle progression. Sgs1 and Top3 tagged with HA were depleted with Auxin and Tetracycline as indicated by Western blots. Pgk1 was used as loading control. Joint molecules accumulating on the X-arc are indicated by red arrows. The experiment was performed reproducibly twice. See also Supplementary Figs. 3 and 4. Source data are provided as a Source Data file.
Fig. 3
Fig. 3. STR and Smc5/6 jointly prevent accumulation of hemicatenanes, reversed forks and double Holliday Junctions.
Electron microscopy analysis of replication intermediates and four-way junctions-intermediates in WT and sgs1, top3, smc5/6 mutants. The plot indicates the percentage of various types of DNA replication intermediates (forks and bubbles) and Joint Molecules (JMs) divided in reversed forks, double Holliday Junctions (dHJs) and hemicatenanes. The number (n) of DNA molecules analysed for each genotype is indicated. The intermediates are derived from two biological replicates, with similar results. Typical examples of the visualized categories of JMs are shown with the entire DNA structure and enlarged views of the junction point, with schematic representation of ssDNA regions in red and dsDNA regions in black. The length of the four branches composing the JMs and their relationship in terms of length is shown. Scale bars of 180 nm corresponding to 500 base pairs are indicated. Source data are provided as a Source Data file.
Fig. 4
Fig. 4. Intra-allelic smc6 suppressor unveils tight links between Smc5/6 and Top3.
a Schematic representation of the smc6-56 suppressor screen. Representation of the point mutations in smc6-56-sup and validation of the suppressor by creating the suppressor mutation de novo in smc6-56. b ChIP-qPCR analysis of Myc-tagged Smc6 and variants versus no tag in G2/M phase at three indicated NPSs. c ChIP-qPCR analysis of Top3-Flag in WT, smc6-56 and smc6-56-sup versus no tag in G2/M phase at three indicated NPSs. For ChIP-qPCR (b and c), the % Input is derived from three biological replicates and data are presented as mean value ± SEM. p-values were calculated by an unpaired two-tail t-test. d ChIP-on-chip profile of Top3-Flag from G2/M-synchronized WT, smc6-56 and smc6-56-sup mutant cells performed in two biological replicates. Chr IX is shown as example. The indicated p-values (one-tailed Fisher’s exact test) relate to the genome-wide overlap between the considered protein clusters (see legend of Fig. 1a for details). Genome coverage percentage of Top3 is indicated. See also Supplementary Fig. 5. Source data are provided as a Source Data file.
Fig. 5
Fig. 5. Smc6-56-sup protein is defective in pathways complementary with Sgs1 and Mus81.
a, b Additivity between smc6-56-sup and sgs1Δ, mus81Δ, mms4Δ in regard to HU sensitivity. The experiments were repeated independently twice with similar results. c Visualization of replication intermediates at TER302 by 2D gel electrophoresis from cells of the indicated genotype synchronously released from G1 in media containing 200 mM HU. The experiment was repeated independently twice with similar results. Flow cytometry profiles are indicated on the right. Joint molecules accumulating on the X-arc are indicated by red arrows. See also Supplementary Fig. 6. Source data are provided as a Source Data file.
Fig. 6
Fig. 6. Smc6-56-sup is defective in pathways that act complementarily with Top3 to prevent JM accumulation.
a Additivity between smc6-56-sup and Top3 depletion induced by tetracycline (Tc) and auxin addition to Tc-top3-AID. b 2D gel of replication intermediates arising at TER302 in cells released synchronously from G1 in media containing 200 mM HU, tetracycline (Tc) and auxin. The experiment was repeated independently twice with similar results. Flow cytometry profiles are indicated on the right. Joint molecules accumulating on the X-arc are indicated by red arrows. Source data are provided as a Source Data file.
Fig. 7
Fig. 7. Genetic relationship between Smc6-56-sup and DNA processing factors, and Mms4–Mus81 enrichment at NPSs.
a, b No additivity between smc6-56-sup and srs2Δ, mph1Δ in regard to HU sensitivity. The experiments were repeated independently twice with similar results. c ChIP-on-chip profile of HA-Mms4 and Smc6-Flag from G2/M-synchronized cells. Chr VI is shown as example. The indicated p-values (one-tailed Fisher’s exact test) relate to the genome-wide overlap between the considered protein clusters. d Mms4 is enriched at NPSs that serve as termination sites (TERs) in G2/M. Values of overlap and non-overlap between Mms4 and Smc6 are shown. e fold increase of Mms4 at tRNA genes and centromeres (CENs) calculated versus the ones expected for random binding, and the p-values (one-tailed Fisher’s exact test) of the significance (see legend of Fig. 1a for details). f ChIP-qPCR analysis of Mms4-Flag in WT, smc6-56 and smc6-56-sup versus no tag in G2/M phase at two indicated NPSs. The plotted values are derived from three biological replicates, the data are presented as mean value ± SEM. p-values were calculated by an unpaired two-tail t-test. See also Supplementary Fig. 7. Source data are provided as a Source Data file.
Fig. 8
Fig. 8. Schematic representation of Smc5/6 roles in coordinating STR and other DNA crossed strand processing enzymes upon pausing of replication forks at natural pause sites.
The upper panel shows replication forks progressing normally (a) and one fork pausing as it begins traversing elements at a NPS shown in dashed red lines (b). Upon fork stalling, Smc5/6 is shown to inhibit the fork regression activity of Mph1 (c) and to promote Srs2 and Sgs1–Top3–Rmi1-mediated disruption of displacement loops (D-loops) (d). In panel d, the D-loops are shown to form by toxic strand invasion, presumably generated upon fork reversal, into repetitive regions (shown as dashed red lines) present in the non-replicated DNA ahead of the stalled fork. As replication forks converge, Smc5/6 may act to manage associated topological stress and prevent formation of recombination intermediates and reversed forks by regulating Srs2 and Mph1, respectively (e). At converging forks, in the context of matured recombination structures (f), Smc5/6 is shown to facilitate STR complex in processing double Holliday Junctions (dHJs) and Mus81–Mms4 in resolving reversed forks, resembling single Holliday Junctions.

References

    1. Jeppsson K, Kanno T, Shirahige K, Sjogren C. The maintenance of chromosome structure: positioning and functioning of SMC complexes. Nat. Rev. Mol. Cell Biol. 2014;15:601–614. doi: 10.1038/nrm3857. - DOI - PubMed
    1. Baxter J, Aragon L. Physical linkages between sister chromatids and their removal during yeast chromosome segregation. Cold Spring Harb. Symposia Quant. Biol. 2010;75:389–394. doi: 10.1101/sqb.2010.75.015. - DOI - PubMed
    1. West, S. C. et al. Resolution of recombination intermediates: mechanisms and regulation. Cold Spring Harbor Symposia Quant. Biol.80, 103–109 (2015). - PubMed
    1. Song, W., Dominska, M., Greenwell, P. W. & Petes, T. D. Genome-wide high-resolution mapping of chromosome fragile sites in Saccharomyces cerevisiae. Proc. Natl Acad. Sci. USA111, E2210–E2218 (2014). - PMC - PubMed
    1. Cheng E, et al. Genome rearrangements caused by depletion of essential DNA replication proteins in Saccharomyces cerevisiae. Genetics. 2012;192:147–160. doi: 10.1534/genetics.112.141051. - DOI - PMC - PubMed

Publication types

MeSH terms