. 2021 Apr 8;12(1):2102.
doi: 10.1038/s41467-021-22041-2.

Aberrant TGF-β1 signaling activation by MAF underlies pathological lens growth in high myopia

Affiliations

Aberrant TGF-β1 signaling activation by MAF underlies pathological lens growth in high myopia

Xiangjia Zhu et al. Nat Commun. .

Erratum in

Abstract

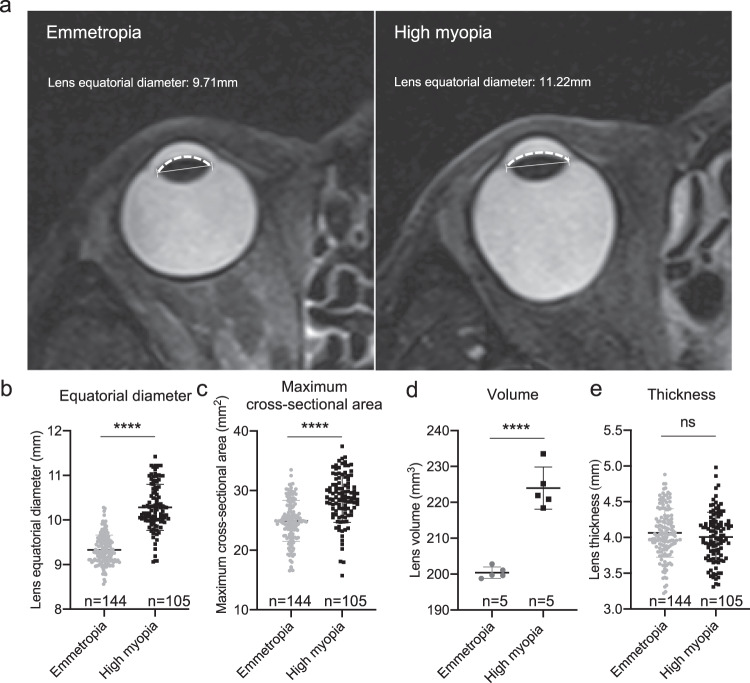
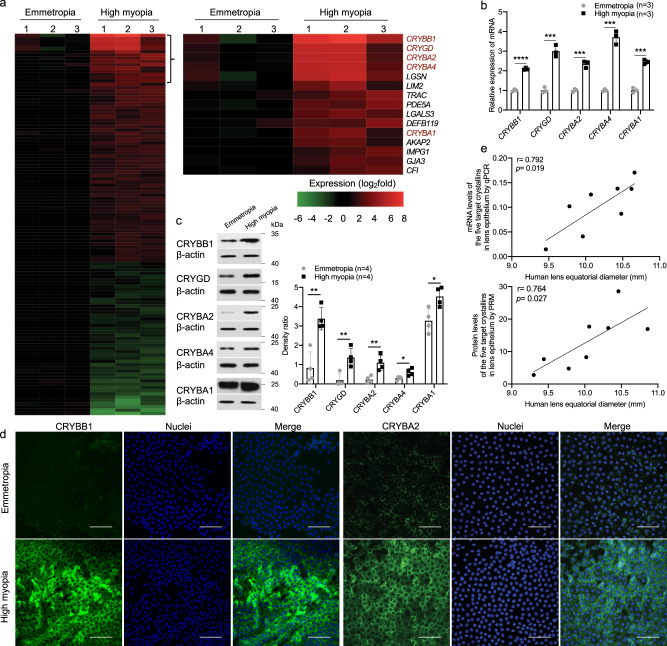
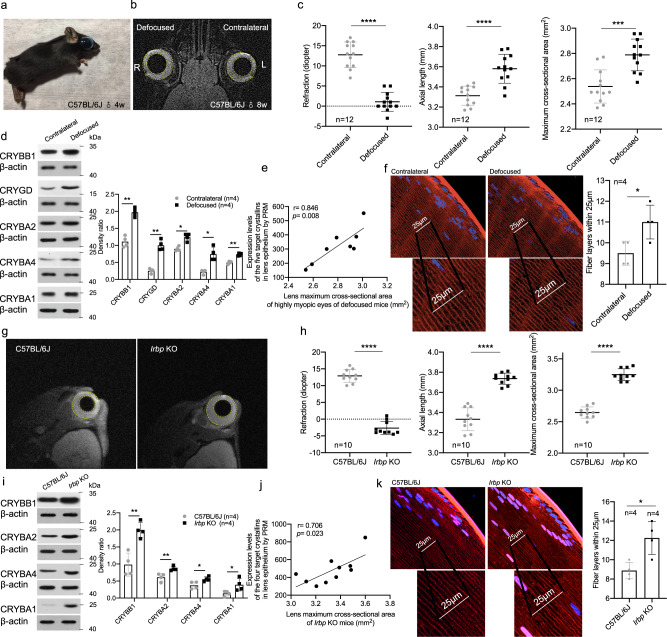
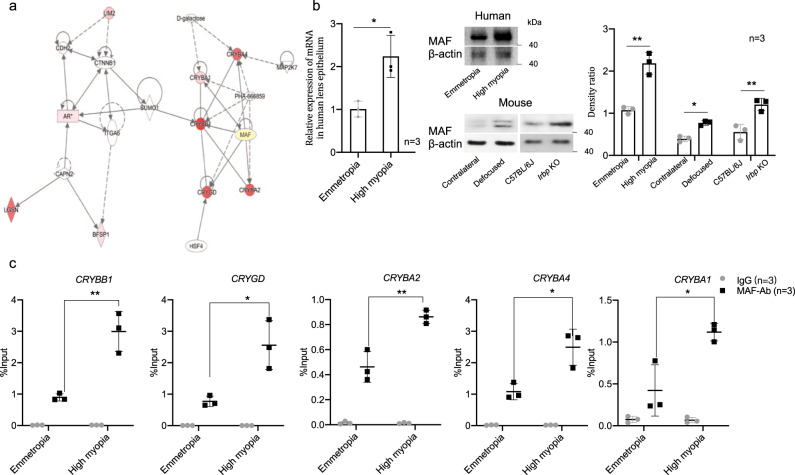
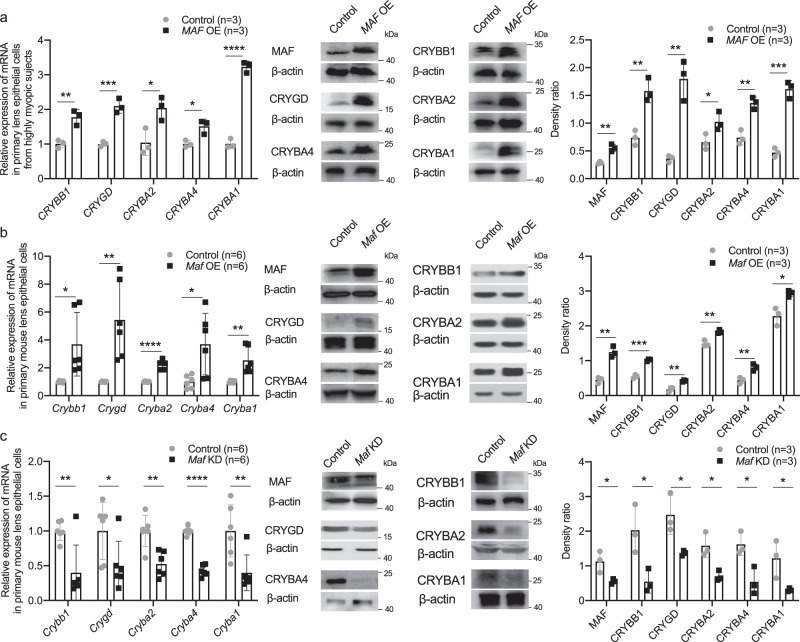
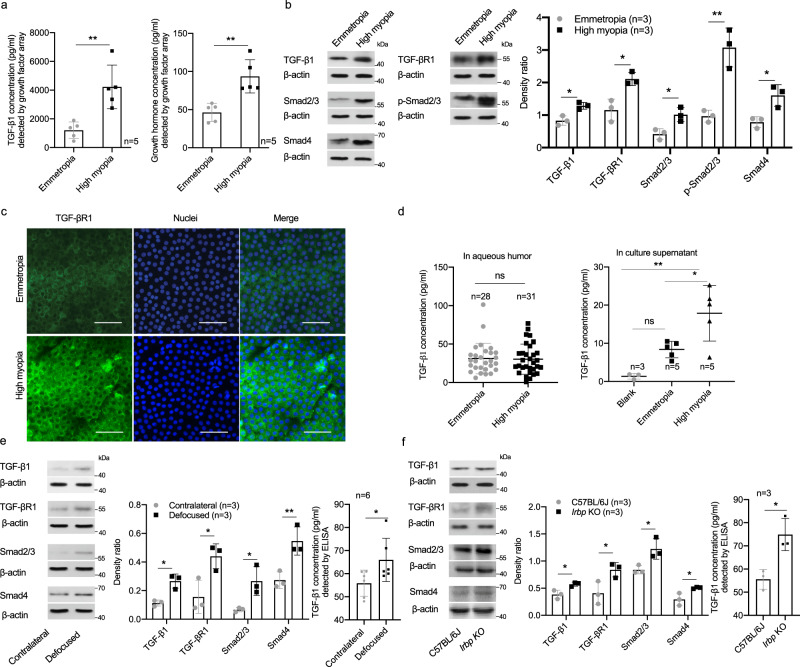
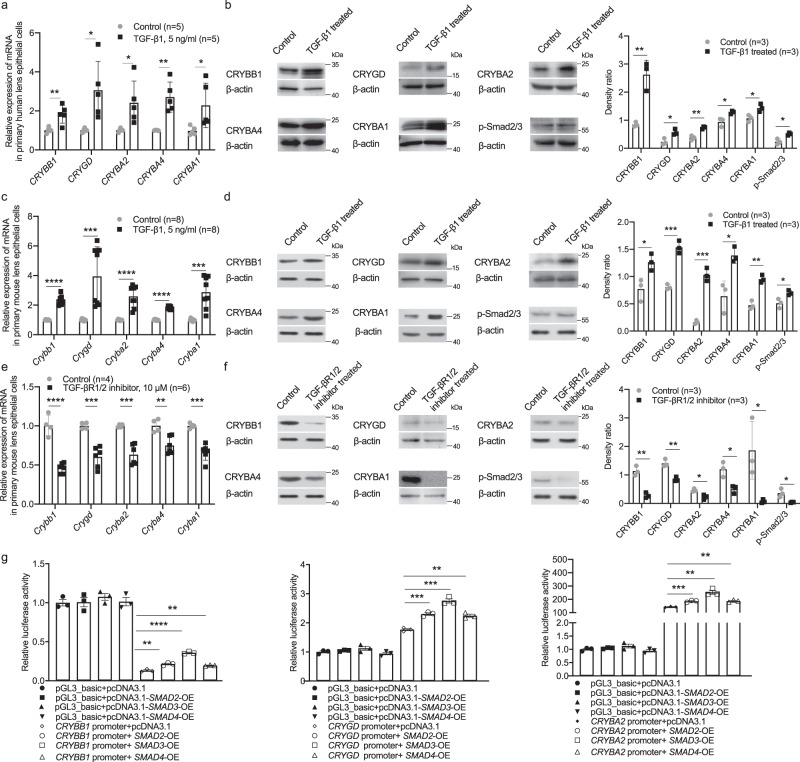
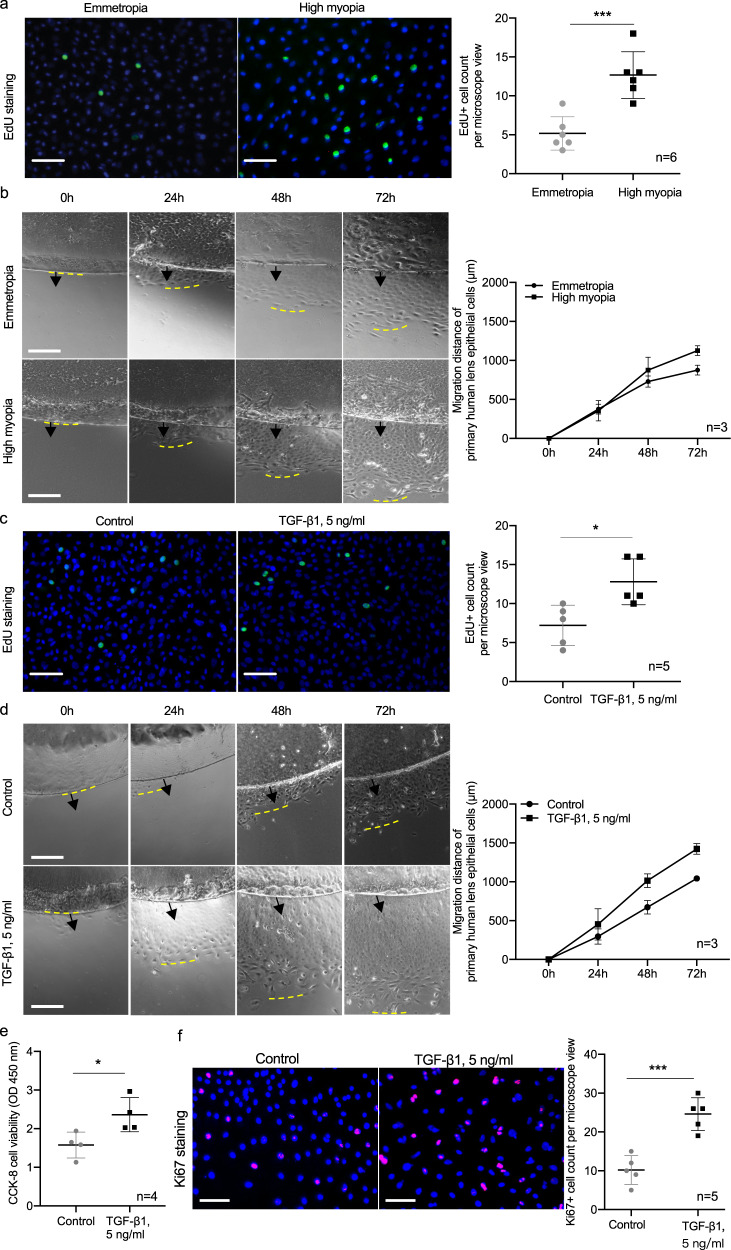
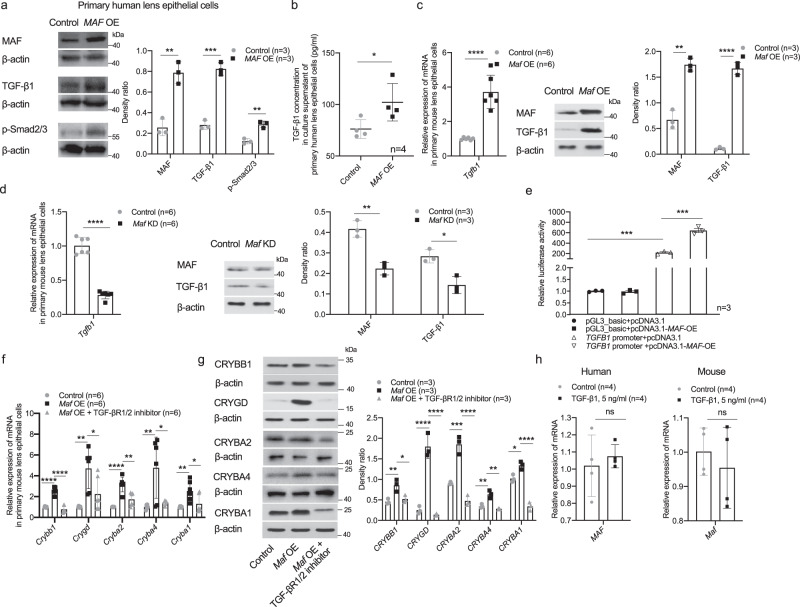
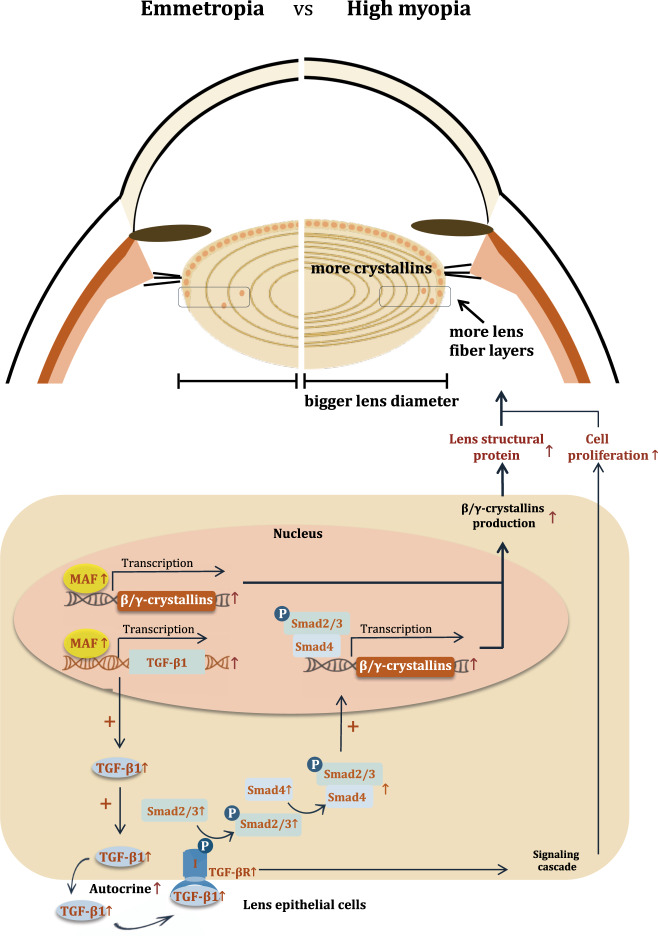
High myopia is a leading cause of blindness worldwide. Myopia progression may lead to pathological changes of lens and affect the outcome of lens surgery, but the underlying mechanism remains unclear. Here, we find an increased lens size in highly myopic eyes associated with up-regulation of β/γ-crystallin expressions. Similar findings are replicated in two independent mouse models of high myopia. Mechanistic studies show that the transcription factor MAF plays an essential role in up-regulating β/γ-crystallins in high myopia, by direct activation of the crystallin gene promoters and by activation of TGF-β1-Smad signaling. Our results establish lens morphological and molecular changes as a characteristic feature of high myopia, and point to the dysregulation of the MAF-TGF-β1-crystallin axis as an underlying mechanism, providing an insight for therapeutic interventions.


Conflict of interest statement

The authors declare no competing interests.

Figures

Fig. 1
Fig. 1. Pathological lens growth was identified in human with high myopia.
a Representative magnetic resonance imaging of an emmetropic control eye and a highly myopic eye. The capped lines represent the equatorial diameter of lens. The dotted curves represent the anterior surface of lens showing an obviously flatter lens in highly myopic eyes. b Lens equatorial diameter (n = 144 in emmetropic group vs. 105 in highly myopic group, p = 1.39e−45). c Maximum cross-sectional area of lens (n = 144 in emmetropic group vs. 105 in highly myopic group, p = 7.35e−14). d Lens volume (n = 5 in emmetropic group vs. 5 in highly myopic group, p = 2.42e−5). e Lens thickness (n = 144 in emmetropic group vs. 105 in highly myopic group, p = 0.208). Results are expressed as mean ± SD. Level of significance was detected using two-sided Student’s t test (be). ****p < 0.0001 and ns represents no significant difference. Source data are provided as a Source Data file.
Fig. 2
Fig. 2. Significant up-regulation of β/γ-crystallins was found in human with high myopia.
a Heat map from gene expression microarray analysis of up-regulated and down-regulated genes in lens epithelium of emmetropic control and highly myopic eyes showing 117 differentially expressed genes (n = 3 vs. 3, fold change ≥ 2, all p < 0.05, CRYBB1 p = 0.009, CRYGD p = 0.032, CRYBA2 p = 0.024, CRYBA4 p = 0.022, CRYBA1 p = 0.032). Right, the top 15 up-regulated genes. b qPCR analyses of mRNA expression of the five β/γ-crystallin genes (n = 3, CRYBB1 p = 2.11e−5, CRYGD p = 0.0005, CRYBA2 p = 0.0003, CRYBA4 p = 0.0002, CRYBA1 p = 0.0001). c Examination of protein expression by Western blotting of the five β/γ-crystallin genes (n = 4, CRYBB1 p = 0.002, CRYGD p = 0.007, CRYBA2 p = 0.007, CRYBA4 p = 0.021, CRYBA1 p = 0.019). Right, the band density was normalized to loading control as a ratio for statistical analysis. d Immunofluorescence images of CRYBB1 and CRYBA2 staining in the human lens epithelium (n = 7). Scale bar: 50 μm. e Correlation between the increased mRNA and protein levels of the five target β/γ-crystallins in lens epithelium and the lens equatorial diameter in highly myopic eyes (examined by qPCR and PRM). n=biological replicates. In (a) and (d), one specimen from an individual was used as one sample; in (b, c, and e), pooled samples were used, of which in (e), lens epithelial samples were pooled in order of lens equatorial diameter (three pieces of lens epithelial samples pooled as one and totally 48 pieces used here) and the average lens equatorial diameter of each three pooled samples were used in the scatterplot. Results are presented as mean ± SD. Level of significance was detected using two-sided Student’s t test (ac). Associations between variables were evaluated by Pearson correlation analysis (e), two-sided test was used). ****p < 0.0001, ***p < 0.001, **p < 0.01, and *p < 0.05. Source data are provided as a Source Data file.
Fig. 3
Fig. 3. Increased lens size and β/γ-crystallin expression in two mouse models of high myopia.
a A representative photo of a mouse wearing −25D lens to induce high myopia in the right eye. b Representative MRI image (coronal image) of an 8-week old mouse with defocus-induced high myopia in the right eye. Dotted yellow lines indicate the contour of the eyeball and the lens. c The refraction, axial length and maximum cross-sectional area of mouse lens (n = 12, p = 1.36e−7, p = 3.23e−5, and p = 0.0006, respectively). d Western blotting of protein expression of crystallin genes in lens epithelium of defocus-induced highly myopic eyes (n = 4, CRYBB1 p = 0.005, CRYGD p = 0.002, CRYBA2 p = 0.030, CRYBA4 p = 0.028, CRYBA1 p = 0.009). Right, the band density was normalized to loading control as a ratio for statistical analysis. e Correlation between the increased protein levels of five target crystallins in lens epithelium and the maximum cross-sectional area of lens from highly myopic eyes of defocused mice (examined by PRM). f Wheat germ agglutinin (WGA) staining of lens fiber layers located within a length of 25 μm approximately 50 μm beneath the lens surface at the equator (n = 4, p = 0.014). g Representative MRI images (sagittal images) of 8-week wild type mice and 8-week interphotoreceptor retinoid-binding protein (Irbp) knockout (KO) mice. Dotted yellow lines indicate the contour of the eyeball and the lens. h The refraction, axial length and maximum cross-sectional area of mouse lens (n = 10, p = 5.64e−13, p = 7.73e−9, and p = 1.86e−11). i Western blotting of protein expression of crystallin genes in lens epithelium of Irbp KO mice and C57BL/6J mice (n = 4, CRYBB1 p = 0.003, CRYBA2 p = 0.008, CRYBA4 p = 0.030, CRYBA1 p = 0.044). Right, the band density was normalized to loading control as a ratio for statistical analysis. j Correlation between the increased protein levels of four target crystallins in lens epithelium and the maximum cross-sectional area of lens from Irbp KO mice (examined by PRM). k WGA staining of secondary lens fiber layers located within a length of 25 μm approximately 50 μm beneath the lens surface at the equator (n = 4 in each group, p = 0.012). n=biological replicates. In (d, e, i, and j), pooled samples were used, of which in (e and j), lens epithelial samples were pooled in order of maximum cross-sectional area (five pieces of lens epithelial samples pooled as one and totally 40 defocus-induced highly myopic mice and 50 Irbp KO mice used here) and the average lens maximum cross-sectional area of each five pooled samples were used in the scatterplot. Results are expressed as mean ± SD. Level of significance was detected using two-sided paired t test (c, d, and f), and two-sided Student’s t test (h, i, and k). Association between variables was evaluated by Pearson correlation analysis (e and j, two-sided test was used). ****p < 0.0001, ***p < 0.001, **p < 0.01, and *p < 0.05. Source data are provided as a Source Data file.
Fig. 4
Fig. 4. Elevated MAF with higher recruitment to β/γ-crystallin gene promoters in high myopia.
a The self-defined network established by Ingenuity Pathway Analysis. b Examination of mRNA level of MAF in human lens epithelium by qPCR analyses (n = 3, p = 0.015) and protein levels of MAF in lens epithelium of human and mouse highly myopic eyes by Western blotting (n = 3, p = 0.002, p = 0.023, and p = 0.008, respectively). Right, the band density was normalized to loading control as a ratio for statistical analysis. c ChIP-qPCR analyses of the recruitment of MAF to CRYBB1, CRYGD, CRYBA2, CRYBA4, and CRYBA1 promoters in lens epithelium from emmetropic and highly myopic patients (n = 3, p = 0.005, p = 0.018, p = 0.007, p = 0.018, and p = 0.020, respectively). IgG was used as a negative control and the data presented were mean values relative to input (input%). n=biological replicates. In (b and c), pooled samples were used. Results are expressed as mean ± SD. Level of significance was detected by two-sided Student’s t test (emmetropia vs. high myopia and C57BL/6J vs. Irbp KO in (b and c)) and two-sided paired t test (contralateral vs. defocused in (b)). **p < 0.01, and *p < 0.05. Source data are provided as a Source Data file.
Fig. 5
Fig. 5. MAF directly up-regulated β/γ-crystallin expression in high myopia conditions.
a Changes of β/γ-crystallin gene expression detected by qPCR (n = 3, CRYBB1 p = 0.006, CRYGD p = 9.86e-4, CRYBA2 p = 0.026, CRYBA4 p = 0.017, CRYBA1 p = 4.93e−5) and Western blotting (n = 3, MAF p = 0.002, CRYBB1 p = 0.004, CRYGD p = 0.002, CRYBA2 p = 0.044, CRYBA4 p = 0.003, CRYBA1 p = 0.0003) in primary human LECs collected from highly myopic eyes after treatment of MAF overexpression (MAF OE). Right, the band density in Western blotting was normalized to loading control as a ratio for statistical analysis. b Changes of crystallin gene expression in primary mouse LECs detected by qPCR (n = 6, Crybb1 p = 0.016, Crygd p = 0.003, Cryba2 p = 2.45e−6, Cryba4 p = 0.015, Cryba1 p = 0.003) and Western blotting (n = 3, MAF p = 0.002, CRYBB1 p = 0.0002, CRYGD p = 0.005, CRYBA2 p = 0.004, CRYBA4 p = 0.007, CRYBA1 p = 0.015) after treatment of Maf overexpression. Right, the band density was normalized to loading control as a ratio for statistical analysis. c Changes of crystallin gene expression in primary mouse LECs detected by qPCR (n = 6, Crybb1 p = 0.006, Crygd p = 0.048, Cryba2 p = 0.002, Cryba4 p = 5.87e−8, Cryba1 p = 0.009) and Western blotting (n = 3, MAF p = 0.035, CRYBB1 p = 0.029, CRYGD p = 0.028, CRYBA2 p = 0.016, CRYBA4 p = 0.022, CRYBA1 p = 0.044) after treatment of Maf knockdown (KD). Right, the band density was normalized to loading control as a ratio for statistical analysis. n=biological replicates. Results are expressed as mean ± SD. Level of significance was detected using two-sided Student’s t test (ac). ****p < 0.0001, ***p < 0.001, **p < 0.01, and *p < 0.05. Source data are provided as a Source Data file.
Fig. 6
Fig. 6. Aberrant activation of TGF-β1-Smads signaling in lens of high myopia.
a Detection of TGF-β1 and growth hormone levels in human lens epithelium by growth factor array (n = 5, both p = 0.003). b Examination of protein expression by Western blotting of TGF-β1, TGF-βR1, and downstream Smad2/3, p-Smad2/3, and Smad4 (n = 3, p = 0.012, p = 0.013, p = 0.019, p = 0.004, and p = 0.019, respectively). Right, the band density in Western blotting was normalized to loading control as a ratio for statistical analysis. c Immunofluorescence images of TGF-βR1 staining in human lens epithelium (n = 5). Scale bar: 50 μm. d Measurement of human TGF-β1 concentration with ELISA in aqueous humor (n = 28 in the control group vs. n = 31 in the highly myopic group, p = 0.876) and primary lens epithelial cell culture supernatant (3, 5, and 5 different cultures in the blank, emmetropic control, and highly myopic group, respectively, one piece of lens epithelium in one culture for this assay, bland vs. emmetropia p = 0.164, emmetropia vs. high myopia p = 0.027, blank vs. high myopia p = 0.002). Blank refers to DMEM without culture of lens epithelium. e Western blotting of protein expression of TGF-β1, TGF-βR1, Smad2/3, and Smad4 (n = 3, p = 0.012, p = 0.041, p = 0.048 and p = 0.008, respectively) and ELISA test of TGF-β1 level in mouse lens epithelium of defocus-induced highly myopic eye and the contralateral eye (n = 6, p = 0.016). Middle, the band density in Western blotting was normalized to loading control as a ratio for statistical analysis. f Western blotting of protein expression of TGF-β1, TGF-βR1, Smad2/3, and Smad4 (n = 3, p = 0.021, p = 0.040, p = 0.032, and p = 0.033, respectively) and ELISA test of TGF-β1 level in lens epithelium of Irbp KO mice and wild type C57BL/6J (n = 3, p = 0.015). Middle, the band density in Western blotting was normalized to loading control as a ratio for statistical analysis. n = biological replicates. In (a, b, e, and f), pooled samples were used. Results are expressed as mean ± SD. Level of significance was detected using two-sided Student’s t test (Figs. a, b, and f) and two-sided paired t test (Fig. e). In (d), TGF-β1 concentration in aqueous humor was analyzed using two-sided Student’s t test, while the concentration in culture supernatant was analyzed using one-way ANOVA with Turkey’s multiple comparisons test for further comparison between two groups. **p < 0.01, *p < 0.05 and ns represents no significant difference. Source data are provided as a Source Data file.
Fig. 7
Fig. 7. Up-regulation of β/γ-crystallins by TGF-β1.
a, b Changes of β/γ-crystallin gene expression detected by qPCR (n = 5, CRYBB1 p = 0.005, CRYGD p = 0.015, CRYBA2 p = 0.022, CRYBA4 p = 0.001, CRYBA1 p = 0.036) and Western blotting (n = 3, CRYBB1 p = 0.004, CRYGD p = 0.021, CRYBA2 p = 0.003, CRYBA4 p = 0.022, CRYBA1 p = 0.027) and changes of p-Smad2/3 level detected by Western blotting (n = 3, p = 0.013) in primary human LECs from emmetropic eyes after TGF-β1 treatment (5 ng/ml for 24 h). Right, the band density in Western blotting was normalized to loading control as a ratio for statistical analysis. c, d Changes of β/γ-crystallin gene expression detected by qPCR (n = 8, Crybb1 p = 4.65e−8, Crygd p = 0.0009, Cryba2 p = 2.53e-5, Cryba4 p = 3.58e-11, Cryba1 p = 0.0002) and Western blotting (n = 3, CRYBB1 p = 0.029, CRYGD p = 0.0005, CRYBA2 p = 0.0003, CRYBA4 p = 0.015, CRYBA1 p = 0.001) and changes of p-Smad2/3 level detected by Western blotting (n = 3, p = 0.027) in primary cultured mouse LECs with TGF-β1 treatment (5 ng/ml for 24 h). Right, the band density in Western blotting was normalized to loading control as a ratio for statistical analysis. e, f Changes of β/γ-crystallin gene expression detected by qPCR (n = 4 in control and 6 in the treated group, Crybb1 p = 2.05e-5, Crygd p = 0.0004, Cryba2 p = 0.0005, Cryba4 p = 0.004, Cryba1 p = 0.0003) and Western blotting (n = 3, CRYBB1 p = 0.002, CRYGD p = 0.003, CRYBA2 p = 0.015, CRYBA4 p = 0.016, CRYBA1 p = 0.038) and changes of p-Smad2/3 level detected by Western blotting (n = 3, p = 0.021) in primary cultured mouse LECs with TGF-βR1/2 inhibitor treatment (LY2109761, 10 μM for 24 h). Right, the band density in Western blotting was normalized to loading control as a ratio for statistical analysis. g Elevated transcriptional activity of crystallin genes with co-transfection of SMADs plasmid (n = 3; CRYBB1 promoter: SMAD2 p = 0.004, SMAD3 p = 6.36e-5, SMAD4 p = 0.004; CRYGD promoter: SMAD2 p = 0.0007, SMAD3 p = 0.0003, SMAD4 p = 0.002; CRYBA2 promoter: SMAD2 p = 0.0008, SMAD3 p = 0.002, SMAD4 p = 0.001). n=biological replicates. Results are expressed as mean ± SD. Level of significance was detected by two-sided Student’s t test (ag). ****p < 0.0001, ***p < 0.001, **p < 0.01 and *p < 0.05. Source data are provided as a Source Data file.
Fig. 8
Fig. 8. Promoted proliferation of lens epithelial cells by TGF-β1.
a EdU incorporation assay of primary human LECs from emmetropic and highly myopic eyes (n = 6, p = 0.0006). Scale bar: 100 μm. b Primary culture of human LECs showing the migration of LECs from the rim of epithelium (n = 3, p = 0.041). Scale bar: 500 μm. Black arrows show the original lens epithelium rim and the yellow dashed lines refer to the place where proliferating LECs outreached. c EdU incorporation assay of primary human LECs from emmetropic eyes after TGF-β1 treatment (5 ng/ml for 24 h, n = 5, p = 0.013). Scale bar: 100 μm. d Primary culture of human LECs from emmetropic eyes showing the migration of LECs from the edge of epithelium after TGF-β1 treatment (5 ng/ml for 24 h, n = 3, p = 0.002). Scale bar: 500 μm. Black arrows show the original lens epithelium rim and the yellow dashed lines refer to the place where proliferating LECs outreached. e CCK-8 cell viability assay of primary human LECs with and without TGF-β1 treatment (5 ng/ml for 24 h, n = 4, p = 0.030). f Ki67 staining of primary human LECs with and without TGF-β1 treatment (5 ng/ml for 24 h, n = 5, p = 0.0004). Scale bar: 100 μm. n = biological replicates. Results are expressed as mean ± SD. Level of significance was detected by two-sided Student’s t test (a, c, e, and f) and repeated measures ANOVA (b and d), multiple comparison was not conducted). ***p < 0.001 and *p < 0.05. Source data are provided as a Source Data file.
Fig. 9
Fig. 9. Activation of TGF-β1-Smad signaling by MAF up-regulated β/γ-crystallin expression.
a Elevated expression of TGF-β1 and p-Smad2/3 in primary human LECs with MAF overexpression (n = 3, MAF p = 0.002, TGF-β1 p = 0.0002, p-Smad2/3 p = 0.002). Right, the band density in Western blotting was normalized to loading control as a ratio for statistical analysis. b Elevated secretion of TGF-β1 into cell culture media of primary human LECs with MAF overexpression (n = 4, p = 0.043). c, d Changes of Tgfb1 expression in primary mouse LECs in accordance with Maf changes as detected by qPCR (both n = 6, p = 4.36e−5 and p = 1.16e−7) and Western blotting (n = 3, Maf OE: MAF p = 0.001, TGF-β1 p = 2.30e-5; Maf KD: MAF p = 0.003, TGF-β1 p = 0.010). Right, the band density in Western blotting was normalized to loading control as a ratio for statistical analysis. e Elevated transcriptional activity of TGFB1 gene with co-transfection of MAF plasmid (p = 0.0007). f, g Changes of β/γ-crystallin gene expression detected by qPCR (n = 6, Crybb1: control vs. Maf OE and Maf OE vs. Maf OE + TGF-βR1/2 inhibitor p = 3.30e−7 and p = 6.23e−8; Crygd: p = 0.001 and p = 0.027, Cryba2: p = 1.7e−5 and p = 0.001; Cryba4: p = 0.005 and p = 0.011; Cryba1: p = 0.007 and p = 0.028) and Western blotting (n = 3, CRYBB1: p = 0.008 and p = 0.019, CRYGD: p = 9.2e−5 and p = 6.2e−5, CRYBA2: p = 0.0005 and p = 6.4e−5, CRYBA4: p = 0.003 and p = 0.001, CRYBA1: p = 0.015 and p = 3.5e−5) with Maf overexpression ± TGF-βR1/2 inhibitor treatment (10 μM for 24 h) in primary mouse LECs. Right, the band density in Western blotting was normalized to loading control as a ratio for statistical analysis. h No significant change of MAF detected by qPCR (both n = 4, p = 0.586 and p = 0.511) in primary human or mouse LECs after TGF-β1 treatment (5 ng/ml, 24 h). n = biological replicates. Results are expressed as mean ± SD. Level of significance was detected using two-sided Student’s t test (ae, and h) and one-way ANOVA plus Tukey’s multiple comparisons test (f and g). ****p < 0.0001, ***p < 0.001, **p < 0.01, *p < 0.05 and ns represents no significant difference. Source data are provided as a Source Data file.
Fig. 10
Fig. 10. Schematic illustration of the MAF-TGF-β1-crystallin axis that underlies the pathological growth of lens in high myopia.
Elevated MAF in lens of highly myopic eyes could promote β/γ-crystallin expressions by direct binding to their promoters and by boosting autocrine secretion of TGF-β1 and subsequent Smad signaling pathway, together contributing to larger equatorial diameter of lens in highly myopic eyes.

References

    1. Dolgin E. The myopia boom. Nature. 2015;519:276–278. doi: 10.1038/519276a. - DOI - PubMed
    1. Holden BA, et al. Global prevalence of myopia and high myopia and temporal trends from 2000 through 2050. Ophthalmology. 2016;123:1036–1042. doi: 10.1016/j.ophtha.2016.01.006. - DOI - PubMed
    1. Alio JL, Schimchak P, Negri HP, Montes-Mico R. Crystalline lens optical dysfunction through aging. Ophthalmology. 2005;112:2022–2029. doi: 10.1016/j.ophtha.2005.04.034. - DOI - PubMed
    1. Pan CW, et al. Differential associations of myopia with major age-related eye diseases: the Singapore Indian Eye Study. Ophthalmology. 2013;120:284–291. doi: 10.1016/j.ophtha.2012.07.065. - DOI - PubMed
    1. Zhu X, Li D, Du Y, He W, Lu Y. DNA hypermethylation-mediated downregulation of antioxidant genes contributes to the early onset of cataracts in highly myopic eyes. Redox Biol. 2018;19:179–189. doi: 10.1016/j.redox.2018.08.012. - DOI - PMC - PubMed

Publication types