. 2021 Apr 8;12(1):2106.
doi: 10.1038/s41467-021-22241-w.

The anatomy of past abrupt warmings recorded in Greenland ice

Affiliations

The anatomy of past abrupt warmings recorded in Greenland ice

E Capron et al. Nat Commun. .

Abstract

Data availability and temporal resolution make it challenging to unravel the anatomy (duration and temporal phasing) of the Last Glacial abrupt climate changes. Here, we address these limitations by investigating the anatomy of abrupt changes using sub-decadal-scale records from Greenland ice cores. We highlight the absence of a systematic pattern in the anatomy of abrupt changes as recorded in different ice parameters. This diversity in the sequence of changes seen in ice-core data is also observed in climate parameters derived from numerical simulations which exhibit self-sustained abrupt variability arising from internal atmosphere-ice-ocean interactions. Our analysis of two ice cores shows that the diversity of abrupt warming transitions represents variability inherent to the climate system and not archive-specific noise. Our results hint that during these abrupt events, it may not be possible to infer statistically-robust leads and lags between the different components of the climate system because of their tight coupling.


Conflict of interest statement

The authors declare no competing interests.

Figures

Fig. 1
Fig. 1. Abrupt climate variability recorded in Greenland water isotopic records.
a NGRIP δ18O record. Studied abrupt warming transitions are highlighted with red vertical bars and Greenland Interstadials (GI) are numbered. Gray boxes indicate intervals shown in (bg), illustrating the variety of abrupt GS–GI transitions across the Last Glacial; stadials containing Heinrich events are indicated in yellow following refs. ,, and Marine Isotope Stages (MIS) are indicated in gray. bg High-resolution δ18O from NGRIP (dark blue) and NEEM (light blue) and d-excess from NGRIP (red) and NEEM (orange) over 400 yr time intervals centered on the Holocene abrupt onset (b) and the abrupt transitions into GI-5.2 (c), GI-8c (d), GI-18 (e), GI-19.2 (f), and GI-20c (g).
Fig. 2
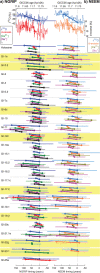
Fig. 2. Anatomy of Last Glacial abrupt changes inferred from an ice-core multi-tracer approach.
Onset and endpoints (dots) of the studied transitions (oblique lines) towards each GI over the past 112 ka, together with associated uncertainty intervals (horizontal shaded lines) found by the ramp-fitting analysis on (a) NGRIP and (b) NEEM ice-core tracers: δ18O, d-excess, [Ca2+], [Na+] and annual-layer thickness λ (see legend for colors). On the top, NGRIP and NEEM δ18O and d-excess records are represented across the Holocene onset together with the fitted ramp to illustrate how the ramp results are represented below. Transitions preceded by stadials containing Heinrich events are indicated in yellow. All timings are shown relative to the onset of the δ18O transition (dashed vertical line). The vertical amplitude between the onset and the end of each transition is the same for all tracers, it has been set arbitrarily and does not represent the true amplitude of change for each ice-core tracer.
Fig. 3
Fig. 3. Anatomy of last deglaciation abrupt changes from an ice-core multi-tracer approach.
Onset and endpoints (symbols) of the studied transitions (oblique lines) together with associated uncertainty intervals (horizontal shaded lines) found by the ramp-fitting analyses applied to NGRIP and NEEM ice-core tracers across the Holocene onset (a and b) and across the transition into GI-1e (c and d) in this study (circles), ref. (triangles) and ref. (squares). All timings are represented relative to the timing of the onset in the δ18O transition inferred in this study. The vertical amplitude between the onset and the end of each transition is the same for all tracers, it has been set arbitrarily and does not represent the true amplitude of change for each ice-core tracer.
Fig. 4
Fig. 4. Duration estimates of the δ18O, d-excess, [Ca2+], [Na2+], and annual-layer thickness (λ) transitions into each GI.
Duration estimates inferred from (a) NGRIP data sets and (b) NEEM data sets. Transitions highlighted in yellow are preceded by a stadial containing a Heinrich event. Gray shading indicates the section at the bottom of the two cores where duration data should be interpreted with caution owing to marginal data resolution. Uncertainty intervals in the transition duration range from 2 to 262 yr with a mean of 86 yr (they are omitted here for clarity purposes but are shown in Supplementary Figure 4 and tabulated in Supplementary Data 4).
Fig. 5
Fig. 5. Anatomy of self-sustained abrupt transitions simulated in CCSM4.
Onset and endpoints (dots) of modeled abrupt transitions (oblique lines) together with associated uncertainty intervals (horizontal shaded lines) found by the ramp-fitting analysis on time series of the annual surface air temperature (blue) and the annual precipitation rate (black) both at the model grid point closest to NGRIP, the sea-ice extent in the Irminger Seas (light orange) and an NAO index defined as PC1 of sea-level pressure variations in the North Atlantic region (purple; details in SOM) over the two unforced oscillations simulated in CCSM4 with atmospheric CO2 concentrations of (ab) 185 ppm, (c) 200 ppm, and (d) 210 ppm. The time series (numbered 1–6) are shown in Supplementary Figure 7. (a) simulated time series for each climate parameter from the first modeled abrupt change under a CO2 concentration background of 185 ppm are represented together with the resulting identification of the onset and the end of the abrupt transition from the ramp-fitting analysis to illustrate what is represented in (bd). All transitions are shown relative to the timing of the onset of the NGRIP surface air temperature transition (dashed vertical line). The vertical amplitude between the onset and the end of each transition is the same for all tracers, it has been set arbitrarily and does not represent the true amplitude of change for each ice-core tracer. (e) Zoom on the duration estimates of the transitions in the simulated climatic parameters. Uncertainty intervals in the transition duration range from 15 to 118 yr with a mean of 57 yr (they are omitted here for clarity purposes).

References

    1. Voelker AHL. Global distribution of centennial-scale records for Marine Isotope Stage (MIS) 3: a database. Quat. Sci. Rev. 2002;21:1185–1212. doi: 10.1016/S0277-3791(01)00139-1. - DOI
    1. Capron E, et al. Synchronising EDML and NorthGRIP ice cores using d18O of atmospheric oxygen (d18Oatm) and CH4 measurements over MIS 5 (80–123 kyr) Quat. Sci. Rev. 2010;29:222–234. doi: 10.1016/j.quascirev.2009.07.014. - DOI
    1. EPICA community members. One-to-one coupling of glacial climate variability in Greenland and Antarctica. Nature. 2006;444:195–198. doi: 10.1038/nature05301. - DOI - PubMed
    1. Johnsen SJ, et al. Oxygen isotope and palaeotemperature records from six Greenland ice-core stations: camp Century, Dye-3, GRIP, GISP2, Renland and NorthGRIP. J. Quat. Sci. 2001;16:299–307. doi: 10.1002/jqs.622. - DOI
    1. NorthGRIP community members. High-resolution record of Northern Hemisphere climate extending into the last interglacial period. Nature. 2004;431:147–151. doi: 10.1038/nature02805. - DOI - PubMed

Publication types

LinkOut - more resources