

Single molecule network analysis identifies structural changes to caveolae and scaffolds due to mutation of the caveolin-1 scaffolding domain
- PMID: 33833286
- PMCID: PMC8032680
- DOI: 10.1038/s41598-021-86770-6
Single molecule network analysis identifies structural changes to caveolae and scaffolds due to mutation of the caveolin-1 scaffolding domain
Abstract
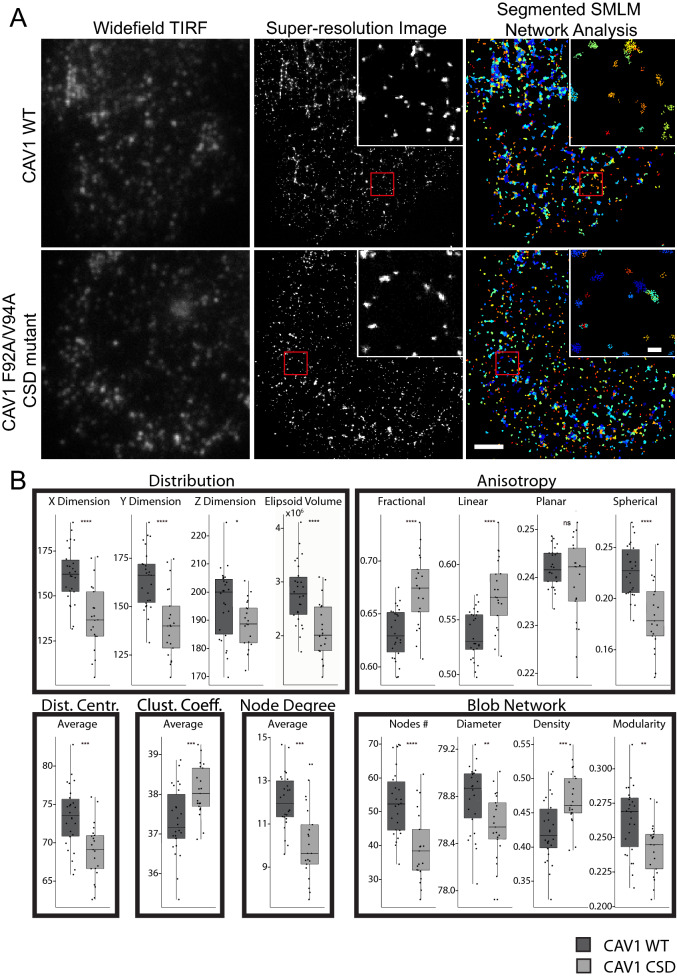
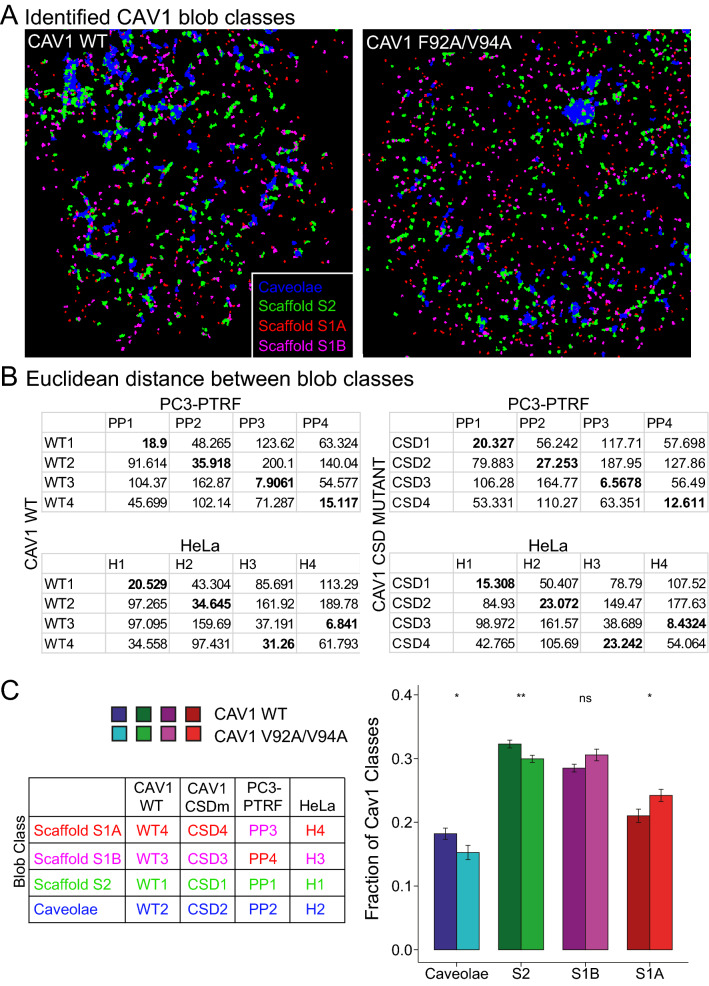
Caveolin-1 (CAV1), the caveolae coat protein, also associates with non-caveolar scaffold domains. Single molecule localization microscopy (SMLM) network analysis distinguishes caveolae and three scaffold domains, hemispherical S2 scaffolds and smaller S1B and S1A scaffolds. The caveolin scaffolding domain (CSD) is a highly conserved hydrophobic region that mediates interaction of CAV1 with multiple effector molecules. F92A/V94A mutation disrupts CSD function, however the structural impact of CSD mutation on caveolae or scaffolds remains unknown. Here, SMLM network analysis quantitatively shows that expression of the CAV1 CSD F92A/V94A mutant in CRISPR/Cas CAV1 knockout MDA-MB-231 breast cancer cells reduces the size and volume and enhances the elongation of caveolae and scaffold domains, with more pronounced effects on S2 and S1B scaffolds. Convex hull analysis of the outer surface of the CAV1 point clouds confirms the size reduction of CSD mutant CAV1 blobs and shows that CSD mutation reduces volume variation amongst S2 and S1B CAV1 blobs at increasing shrink values, that may reflect retraction of the CAV1 N-terminus towards the membrane, potentially preventing accessibility of the CSD. Detection of point mutation-induced changes to CAV1 domains highlights the utility of SMLM network analysis for mesoscale structural analysis of oligomers in their native environment.
Conflict of interest statement
The authors declare no competing interests.
Figures


Similar articles
-
Scaffolds and the scaffolding domain: an alternative paradigm for caveolin-1 signaling.Biochem Soc Trans. 2024 Apr 24;52(2):947-959. doi: 10.1042/BST20231570. Biochem Soc Trans. 2024. PMID: 38526159 Free PMC article. Review.
-
Super-resolution modularity analysis shows polyhedral caveolin-1 oligomers combine to form scaffolds and caveolae.Sci Rep. 2019 Jul 8;9(1):9888. doi: 10.1038/s41598-019-46174-z. Sci Rep. 2019. PMID: 31285524 Free PMC article.
-
Identification of caveolin-1 domain signatures via machine learning and graphlet analysis of single-molecule super-resolution data.Bioinformatics. 2019 Sep 15;35(18):3468-3475. doi: 10.1093/bioinformatics/btz113. Bioinformatics. 2019. PMID: 30759191 Free PMC article.
-
Super Resolution Network Analysis Defines the Molecular Architecture of Caveolae and Caveolin-1 Scaffolds.Sci Rep. 2018 Jun 13;8(1):9009. doi: 10.1038/s41598-018-27216-4. Sci Rep. 2018. PMID: 29899348 Free PMC article.
-
Caveolae and cancer: A new mechanical perspective.Biomed J. 2015 Sep-Oct;38(5):367-79. doi: 10.4103/2319-4170.164229. Biomed J. 2015. PMID: 26345539 Review.
Cited by
-
Studying the Dynamics of Chromatin-Binding Proteins in Mammalian Cells Using Single-Molecule Localization Microscopy.Methods Mol Biol. 2022;2476:209-247. doi: 10.1007/978-1-0716-2221-6_16. Methods Mol Biol. 2022. PMID: 35635707
-
Scaffolds and the scaffolding domain: an alternative paradigm for caveolin-1 signaling.Biochem Soc Trans. 2024 Apr 24;52(2):947-959. doi: 10.1042/BST20231570. Biochem Soc Trans. 2024. PMID: 38526159 Free PMC article. Review.
-
Caveolin-1 Regulates Cellular Metabolism: A Potential Therapeutic Target in Kidney Disease.Front Pharmacol. 2021 Dec 10;12:768100. doi: 10.3389/fphar.2021.768100. eCollection 2021. Front Pharmacol. 2021. PMID: 34955837 Free PMC article. Review.
-
Are There Lipid Membrane-Domain Subtypes in Neurons with Different Roles in Calcium Signaling?Molecules. 2023 Dec 2;28(23):7909. doi: 10.3390/molecules28237909. Molecules. 2023. PMID: 38067638 Free PMC article. Review.
-
SPECHT: Self-tuning Plausibility based object detection Enables quantification of Conflict in Heterogeneous multi-scale microscopy.PLoS One. 2022 Dec 29;17(12):e0276726. doi: 10.1371/journal.pone.0276726. eCollection 2022. PLoS One. 2022. PMID: 36580473 Free PMC article.
References
Publication types
MeSH terms
Substances
Grants and funding
LinkOut - more resources
Full Text Sources
Other Literature Sources
Research Materials
Miscellaneous
