. 2021 Jul;26(7):3043-3059.
doi: 10.1038/s41380-021-01065-6. Epub 2021 Apr 8.

Type 1 interferon mediates chronic stress-induced neuroinflammation and behavioral deficits via complement component 3-dependent pathway

Affiliations

Type 1 interferon mediates chronic stress-induced neuroinflammation and behavioral deficits via complement component 3-dependent pathway

Ashutosh Tripathi et al. Mol Psychiatry. 2021 Jul.

Abstract

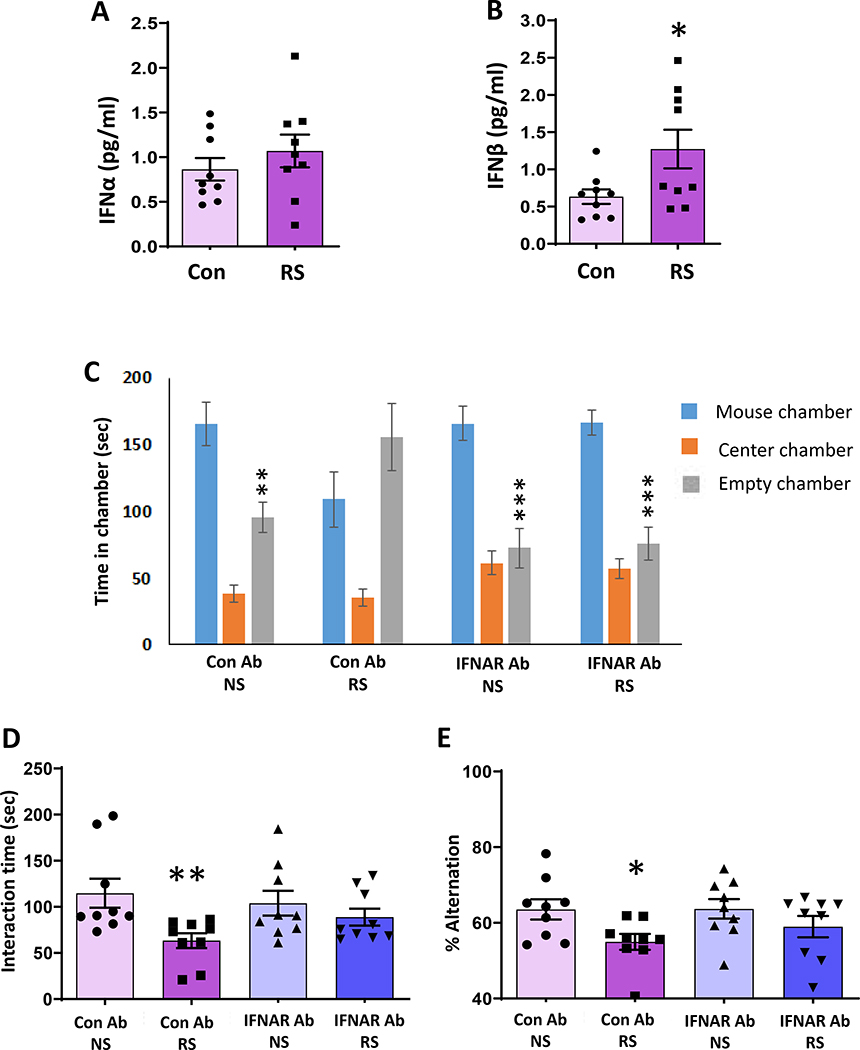
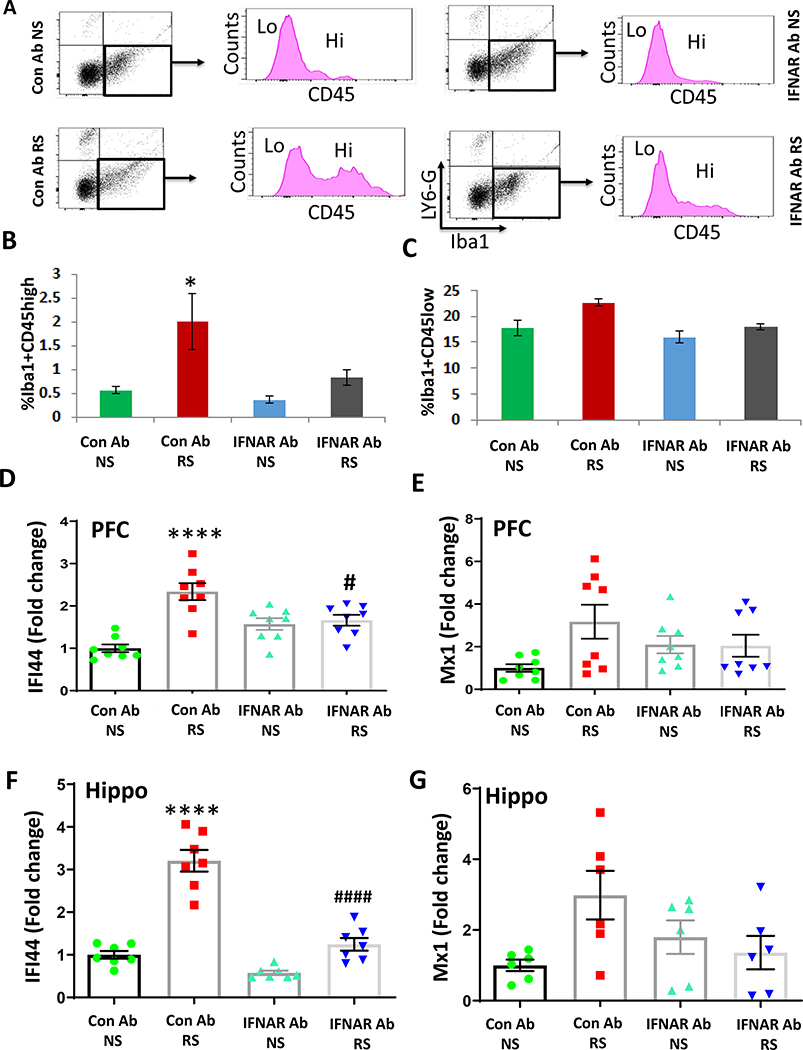
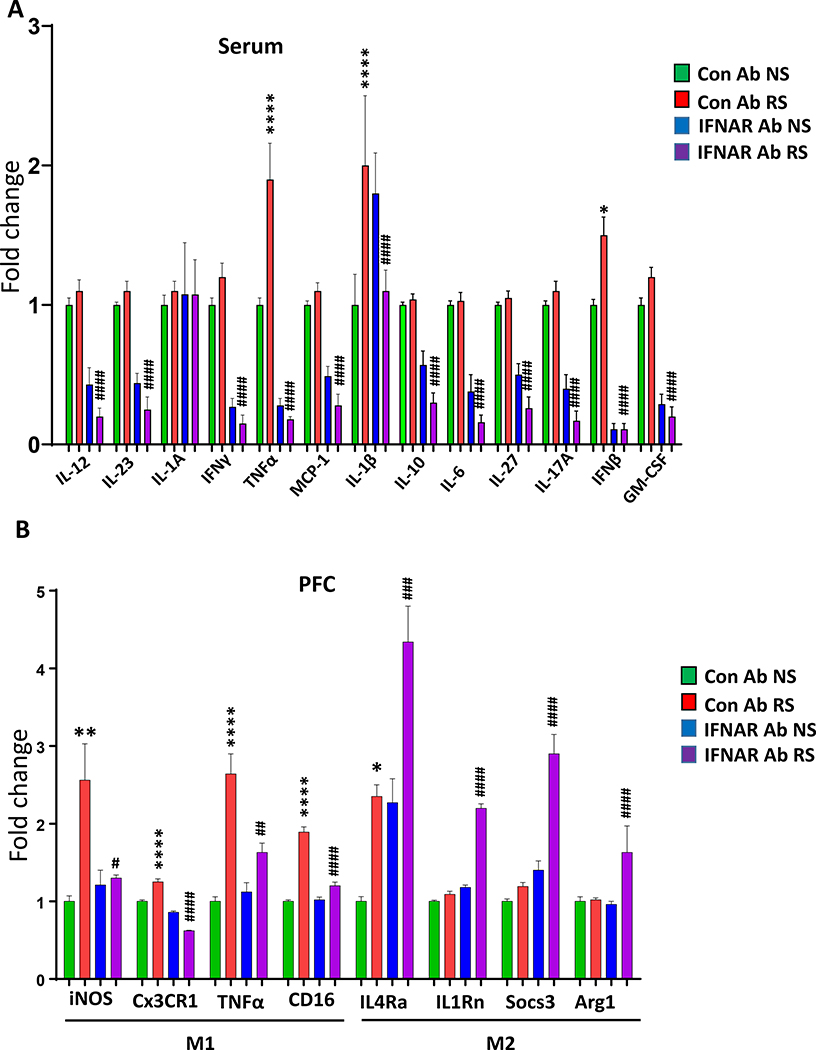
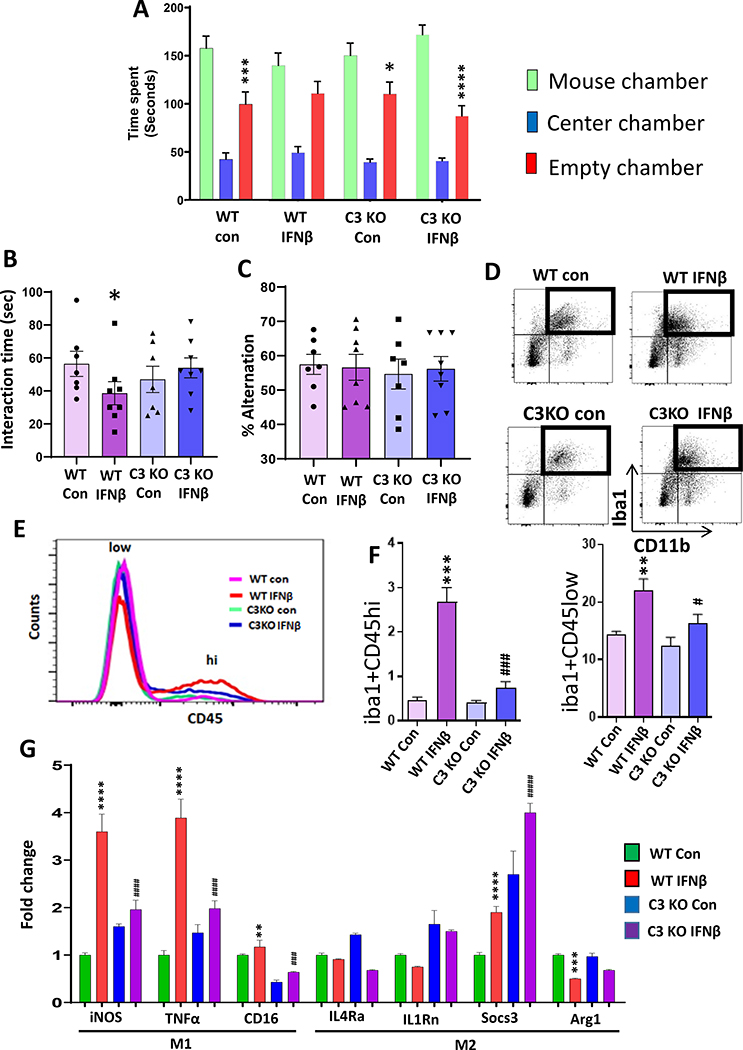
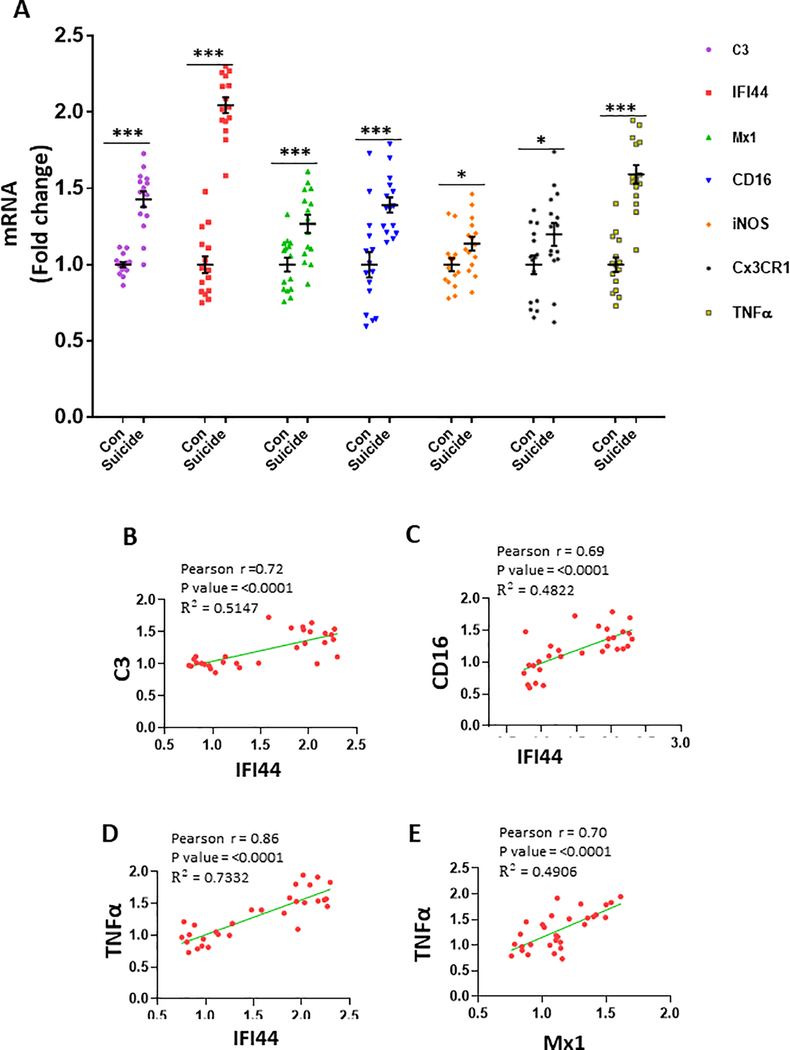
Chronic stress is a major risk factor in the pathophysiology of many neuropsychiatric disorders. Further, chronic stress conditions can promote neuroinflammation and inflammatory responses in both humans and animal models. Type I interferons (IFN-I) are critical mediators of the inflammatory response in the periphery and responsible for the altered mood and behavior. However, the underlying mechanisms are not well understood. In the present study, we investigated the role of IFN-I signaling in chronic stress-induced changes in neuroinflammation and behavior. Using the chronic restraint stress model, we found that chronic stress induces a significant increase in serum IFNβ levels in mice, and systemic blockade of IFN-I signaling attenuated chronic stress-induced infiltration of macrophages into prefrontal cortex and behavioral abnormalities. Furthermore, complement component 3 (C3) mediates systemic IFNβ-induced changes in neuroinflammation and behavior. Also, we found significant increases in the mRNA expression levels of IFN-I stimulated genes in the prefrontal cortex of depressed suicide subjects and significant correlation with C3 and inflammatory markers. Together, these findings from animal and human postmortem brain studies identify a crucial role of C3 in IFN-I-mediated changes in neuroinflammation and behavior under chronic stress conditions.


Conflict of interest statement

Conflict of Interest:

None.

Figures

Figure 1.
Figure 1.. IFNAR antibody treatment attenuates chronic stress-induced deficits in social behavior and spatial working memory.
(A-B) Chronic stress-induced changes in serum (A) IFNα and (B) IFNβ protein levels; *p =0.0348 vs NS; Student’s t test: n=9. (C-E) IFNAR antibody treatment attenuated chronic stress-induced deficits in social behavior and spatial working memory. C, Time in chamber in the three-chamber social interaction test. Two-way ANOVA, chamber (F(2,102)=53.75, p<0.0001); chamber X treatment interaction (F(6,102)=6.364, p<0.0001). **p<0.01 and ***p<0.001 (mouse chamber vs empty chamber); n=9–10 per group. D, Reciprocal social interaction test; Two-way ANOVA, stress (F(1,32)=7.617, p=0.0095); **p<0.01 vs Con Ab NS; n=9 per group. E, Y-maze test. Two-way ANOVA, stress (F(1,35)=6.898, p=0.0127); *p<0.05 vs Con Ab NS; n=9–10 per group. NS: no stress; RS: restraint stress.
Figure 2.
Figure 2.. IFNAR antibody treatment attenuates chronic stress-induced infiltration of macrophages and increases in IFN-I-stimulated gene in the PFC
(A-C) Flow cytometry analysis of infiltrating monocytes and resident microglia in the PFC of mice exposed to chronic stress in presence or absence of IFNAR antibody. A, Flow cytometry gating strategy showing Iba1+ cells were analyzed using CD45 to differentiate infiltrating macrophages (CD45hi) from resident microglia (CD45low). B, % of Iba1+ cells expressing CD45high in PFC of no stress (NS) and restraint stress (RS) mice treated with control (Con) Ab or IFNAR Ab. Two-way ANOVA, stress (F(1,8)=2.708, p=0.0142); *p<0.05 vs Con Ab NS; n=3 per group. C, % of Iba1+ cells expressing CD45low in PFC of mice exposed to RS as compared to NS. Two-way ANOVA, stress (F (1, 8) = 7.848, p=0.0231); treatment ( F (1, 8) = 6.283, p=0.0366); n=3 per group. (D-G) IFN-I signaling in the brain of chronic stressed mice treated with Con Ab or IFNAR Ab. D, mRNA expression of IFI44 in PFC. Two-way ANOVA, stress (F (1, 28) = 24.27 p<0.0001); stress X treatment interaction (F (1, 28) = 18.47, p=0.0002); ****p<0.0001 vs Con Ab NS,; #p<0.05 vs Con Ab RS; n=8 per group. E, mRNA expression of Mx1 in PFC. Two-way ANOVA, n=8–9 per group. F, mRNA expression of IFI44 in hippocampus. Two-way ANOVA, stress (F (1, 24) = 85.35 p<0.0001); treatment (F (1, 24) = 58.65, p<0.0001); stress X treatment interaction (F (1, 24) = 24.46, p<0.0001); ****p<0.0001 vs Con Ab NS,; ####p<0.0001 vs Con Ab RS; n=7 per group. G, mRNA expression of Mx1 in hippocampus. Two-way ANOVA, stress (F (1, 20) = 6.196, p=0.0217); n=6 per group.
Figure 3.
Figure 3.. IFNAR antibody treatment attenuates chronic stress-induced changes in serum inflammatory markers, and in M1 and M2 markers in the PFC.
(A) Array of 13 cytokines in the serum samples from no stress (NS) and restraint stress (RS) mice treated with control (Con) Ab or IFNAR Ab. IL-12. Two-way ANOVA, treatment (F (1, 19) = 81.67 p<0.001); ####p<0.0001 vs Con Ab RS; n =5–7 per group. IL-23. Two-way ANOVA, treatment (F (1, 20) = 91.68p<0.0001); ####p<0.05 vs Con Ab RS; n=5–7 per group. IL-1A. Two-way ANOVA, NSp>0.05 vs Con Ab RS; n=5–7 per group. IFNγ. Two-way ANOVA, treatment (F (1, 20) = 155.2 p<0.001); ####p<0.0001 vs Con Ab RS; n=5–7 per group. TNFα. Two-way ANOVA, stress (F (1, 20) = 9.92, p<0.01); treatment (F (1, 20) = 95.54 p<0.001); stress X treatment interaction (F (1, 20) = 14.62, p<0.01); ****p<0.0001 vs Con Ab NS; ####p<0.0001 vs Con Ab RS; n=5–7 per group. MCP1. Two-way ANOVA, treatment (F (1, 20) = 98.27, p<0.001); ####p<0.0001 vs Con Ab RS; n=5–7 per group. IL1β. Two-way ANOVA, stress X treatment interaction (F (1, 20) = 6.88, p<0.05); ****p<0.0001 vs Con Ab NS, ####p<0.0001 vs Con Ab RS; n=5–7 per group. IL-10. Two-way ANOVA, treatment (F (1, 20) = 79.09, p<0.0001);###p<0.001 vs Con Ab RS; n=5–7 per group. IL-6. Two-way ANOVA, treatment (F (1, 20) = 102.0, p<0.0001); ####p<0.0001 vs Con Ab RS; n=5–7 per group. IL-27. Two-way ANOVA, treatment (F (1, 20) = 85.32, p<0.0001); ####p<0.0001 vs Con Ab RS; n=5–7 per group. IL-17A. Two-way ANOVA, treatment (F (1, 20) = 108.3, p<0.001); ####p<0.0001 vs Con Ab RS; n=5–7 per group. IFNβ. Two-way ANOVA, stress (F (1, 17) = 5.309, p<0.05); treatment (F (1, 17) = 146.7 p<0.001); stress X treatment interaction (F (1, 17) = 5.309, p<0.05); *p<0.05 vs Con Ab NS, ####p<0.0001 vs Con Ab RS; n=5–7 per group. GM-CSF. Two-way ANOVA, treatment (F (1, 20) = 153.5, p<0.001); ####p<0.0001 vs Con Ab RS; n=5–7 per group. (B) mRNA expressions of M1/M2 phenotype in the PFC of no stress (NS) and restraint stress (RS) mice treated with control (Con) Ab or IFNAR Ab.. mRNA expressions of M1 markers; iNOS. Two-way ANOVA, stress (F (1, 20) = 10.32, p=0.0044); stress x treatment interaction (F (1, 20) = 7.985, p=0.0104); **p<0.01 vs Con Ab NS, #p<0.05 vs Con Ab RS; n=6 per group. Cx3CR1. Two-way ANOVA, treatment (F (1, 20) = 231.9, p<0.0001); stress x treatment interaction (F (1, 20) = 60.84, p<0.0001); ****p<0.0001 vs Con Ab NS, ####p<0.0001 vs Con Ab RS; n=6 per group. TNFα. Two-way ANOVA, Stress (F (1, 20) = 46.33, p<0.0001), treatment (F (1, 20) = 7.940, p=0.0106); stress x treatment interaction (F (1, 20) = 12.80, p=0.0019); ****p<0.0001 vs Con Ab NS, ##p<0.01 vs Con Ab RS; n=6 per group. CD16. Two-way ANOVA, Stress (F (1, 20) = 129.7, p<0.0001), treatment (F (1, 20) = 50.84, p<0.0001); stress x treatment interaction (F (1, 20) = 57.09, p<0.0001); ****p<0.0001 vs Con Ab NS, ####p<0.0001 vs Con Ab RS; n=6 per group. IL4Rα. Two-way ANOVA, Stress (F (1, 20) = 41.45, p<0.0001), treatment (F (1, 20) = 37.66, p<0.0001); *p<0.05 vs Con Ab NS, ###p<0.001 vs Con Ab RS; n=6 per group. IL1Rn. Two-way ANOVA, Stress (F (1, 20) = 277.3, p<0.0001), treatment (F (1, 20) = 380.9, p<0.0001); stress x treatment interaction (F (1, 20) = 194.3, p<0.0001); ####p<0.0001 vs Con Ab RS; n=6 per group. Socs3. Two-way ANOVA, Stress (F (1, 20) = 48.16, p<0.0001), treatment (F (1, 20) = 87.03, p<0.0001); stress x treatment interaction (F (1, 20) = 28.23, p<0.0001); ####p<0.0001 vs Con Ab RS; n=6 per group. Arg1. Two-way ANOVA, Stress (F (1, 20) = 70.76, p<0.0001), treatment (F (1, 20) = 48.29, p<0.0001); stress x treatment interaction (F (1, 20) = 62.80, p<0.0001); ####p<0.0001 vs Con Ab RS; n=6 per group.
Figure 4.
Figure 4.. Complement component 3 mediates IFNβ–induced neuroinflammation and deficits in social behavior
(A-C) C3 deletion attenuated IFNβ-induced deficits in social behavior. WT and C3 KO mice were treated with vehicle (PBS; Con) or IFNβ. A, Time in chamber in the three-chamber social interaction test. Two-way ANOVA, chamber (F (2, 78) = 119.2, p<0.0001); *p<0.05, ***p<0.001, ****p<0.0001 and (mouse chamber vs empty chamber); n=7–8 per group). B, Reciprocal social interaction test. Two-way ANOVA, genotype X treatment interaction (F (1, 24) = 8.221, p=0.0085); *p<0.05 vs WT Con; n=7 per group). C, Y-maze test for spatial working memory. Two-way ANOVA; n=7–8 per group. (D-F) Flow cytometry analysis of infiltrating monocytes and resident microglia in the PFC of WT and C3 KO mice treated with Con or IFNβ. D-E, Flow cytometry gating strategy showing Iba1+ cells were analyzed using CD45 to differentiate infiltrating monocytes (CD45hi) from resident microglia (CD45low). F, % of Iba1+ cells expressing CD45high. Two-way ANOVA, genotype (F (1, 8) = 28.57, p=0.0007), treatment (F (1, 8) = 45.84, p=0.0001), genotype X treatment interaction (F (1, 8) = 24.89, p=0.0011); ***p<0.001 vs WT con, ###p<0.001 vs WT IFNβ; n=3 per group). % of Iba1+ cells expressing CD45low. Two-way ANOVA, genotype (F (1, 8) = 19.59, p=0.0022), treatment (F (1, 8) = 45.37, p=0.0001); **p<0.01 vs WT con, #p<0.05 vs WT IFNβ; n=3 per group). (G) mRNA expressions of M1/M2 phenotype in the PFC of WT and C3 KO mice treated with Con or IFNβ. mRNA expressions of M1 markers; iNOS. Two-way ANOVA, genotype (F (1, 20) = 36.35, p<0.0001); treatment (F (1, 20) = 294.5, p<0.0001), genotype X treatment interaction (F (1, 20) = 168.6, p<0.0001); ****p<0.0001 vs WT Con, ####p<0.0001 vs WT IFNβ; n=6 per group. TNFα. Two-way ANOVA, genotype (F (1, 20) = 56.80, p<0.0001); treatment (F (1, 20) = 316.6, p<0.0001), genotype X treatment interaction (F (1, 20) = 155.1, p<0.0001); ****p<0.0001 vs WT Con, ####p<0.0001 vs WT IFNβ; n=6 per group. CD16. Two-way ANOVA, genotype (F (1, 20) = 341.6, p<0.0001); treatment (F (1, 20) = 41.19, p<0.0001); **p<0.0001 vs WT Con, ###p<0.0001 vs WT IFNβ; n=6 per group. mRNA expression of M2 markers; IL4Rα. Two-way ANOVA, treatment (F (1, 20) = 5.027, p=0.0364), n=6 per group. IL1Rn. Two-way ANOVA, genotype (F (1, 20) = 119.8, p<0.0001); treatment (F (1, 20) = 6.709, p=0.0175); n=6 per group. Socs3. Two-way ANOVA, genotype (F (1, 20) = 236.6, p<0.0001); treatment (F (1, 20) = 74.92, p<0.0001), ****p<0.0001 vs WT Con, ####p<0.0001 vs WT IFNβ; n=6 per group. Arg1. Two-way ANOVA, treatment (F (1, 20) = 42.80, p=0.1909), genotype X treatment interaction (F (1, 20) = 4.569, p=0.0451); ***p<0.001 vs WT Con; n=6 per group.
Figure 5.
Figure 5.. Increased expression of IFI44 and Mx1 in the PFC of depressed subjects.
(A) Increase in IFN-I stimulated genes (IFI44 and Mx1), complement component (C3) and M1 phenotyppe markers in the PFC of depressed suicide subjects. mRNA levels of these genes in the PFC of depressed suicide (n=15) and control (n=15) subjects were measured by qRT-PCR. mRNA levels were normalized to housekeeping genes 18S and B2m. C3 (***p <0.001), IFI44 (***p <0.001), Mx1 (***p <0.001), CD16 (***p <0.001), iNOS (*p <0.05), Cx3CR1 (*p <0.005) and TNFα (***p =0.001) as compared to the controls, multivariate analysis of variance (MANOVA). (B-E) Representative graphs showing correlation between the mRNA levels. B, Correlation between IFI44 and C3 (Pearson r =0.72; p<0.0001; R2 = 0.5147). C, Correlation between IFI44 and CD16 (Pearson r =0.69; p<0.0001; R2 = 0.4822). D, Correlation between IFI44 and TNFα (Pearson r =0.86; p<0.0001; R2 = 0.7332). E, Correlation between Mx1 and TNFα (Pearson r =0.70; p<0.0001; R2 = 0.4906).

Similar articles

Cited by

References

    1. Marshall PS, Watson D, Steinberg P, Cornblatt B, Peterson PK, Callies A, et al. An assessment of cognitive function and mood in chronic fatigue syndrome. Biol Psychiatry. 1996;39(3):199–206. - PubMed
    1. Beck AT. Depression: Clinical, experimental, and theoretical aspects.1967.
    1. Enns MW, Bernstein CN, Kroeker K, Graff L, Walker JR, Lix LM, et al. The association of fatigue, pain, depression and anxiety with work and activity impairment in immune mediated inflammatory diseases. PLoS One. 2018;13(6):e0198975. - PMC - PubMed
    1. Feinstein A, Brochet B, Sumowski J. The cognitive effects of anxiety and depression in immune-mediated inflammatory diseases. Neurology. 2019;92:211–2. - PubMed
    1. Whitehouse CE, Fisk JD, Bernstein CN, Berrigan LI, Bolton JM, Graff LA, et al. Comorbid anxiety, depression, and cognition in MS and other immune-mediated disorders. Neurology. 2019;92:e406–17. - PMC - PubMed

Publication types