. 2021 May;35(5):1463-1474.
doi: 10.1038/s41375-021-01221-5. Epub 2021 Apr 8.

Temporal multiomic modeling reveals a B-cell receptor proliferative program in chronic lymphocytic leukemia

Affiliations

Temporal multiomic modeling reveals a B-cell receptor proliferative program in chronic lymphocytic leukemia

Cedric Schleiss et al. Leukemia. 2021 May.

Abstract

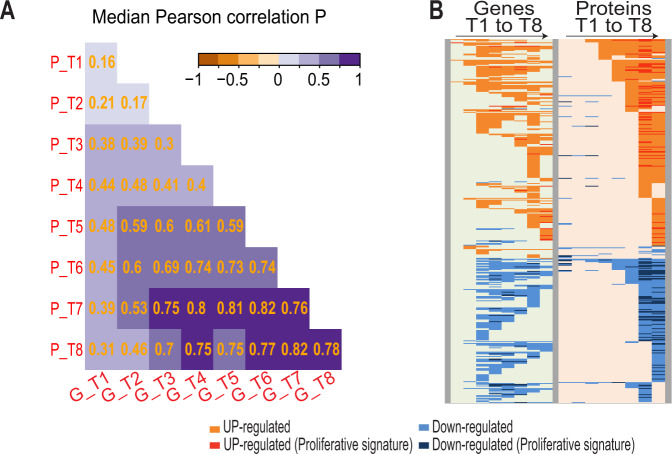
B-cell receptor (BCR) signaling is crucial for the pathophysiology of most mature B-cell lymphomas/leukemias and has emerged as a therapeutic target whose effectiveness remains limited by the occurrence of mutations. Therefore, deciphering the cellular program activated downstream this pathway has become of paramount importance for the development of innovative therapies. Using an original ex vivo model of BCR-induced proliferation of chronic lymphocytic leukemia cells, we generated 108 temporal transcriptional and proteomic profiles from 1 h up to 4 days after BCR activation. This dataset revealed a structured temporal response composed of 13,065 transcripts and 4027 proteins, comprising a leukemic proliferative signature consisting of 430 genes and 374 proteins. Mathematical modeling of this complex cellular response further highlighted a transcriptional network driven by 14 early genes linked to proteins involved in cell proliferation. This group includes expected genes (EGR1/2, NF-kB) and genes involved in NF-kB signaling modulation (TANK, ROHF) and immune evasion (KMO, IL4I1) that have not yet been associated with leukemic cells proliferation. Our study unveils the BCR-activated proliferative genetic program in primary leukemic cells. This approach combining temporal measurements with modeling allows identifying new putative targets for innovative therapy of lymphoid malignancies and also cancers dependent on ligand-receptor interactions.


Conflict of interest statement

The authors declare no competing interests.

Figures

Fig. 1
Fig. 1. Unsupervised statistical analysis of genes and proteins expression.
A Multidimensional scaling plot (MDS) analysis based on the expression of the 500 most expressed genes for each pairwise comparisons between the samples (among a total of 13,065 normalized gene expressions), analyzed before (T0) and at eight time points (T1–T8) after ex vivo B-cell antigen receptor activation for six chronic lymphocytic leukemia (CLL) patients (three proliferative samples (P1-3) and three control nonproliferative samples (NP1–3)). The MDS graphs were constructed from the LogFC of the expressions/abundances at different time points (T1–T8 versus T0). Each dot represents the transcriptional profile of one CLL cell sample at a specific time point. A color code represents the different time points. Successive time points of a same cell sample are linked in the graph (red line for proliferative samples and blue line for nonproliferative samples). B Hierarchical clustering of all samples and all time points, based on the expression of the 500 most expressed genes. Dendrograms from clustering are added to the left side and to the top of the image. The abbreviations of the times (T0–T8) represented in the different time clusters observed on the hierarchical clustering are shown at the bottom. C MDS analysis based on the expression of the 500 most abundant proteins for each pairwise comparisons between the samples, analyzed before and after ex vivo cell activation for the six CLL patients. Each dot represents the proteome of one CLL cell sample at a specific time point before (T0) and at eight time points (T1–T8) after cell stimulation. A color code represents the different time points. Successive time points of a same cell sample are linked in the graph. D Hierarchical clustering of all samples and all time points, based on the expression of the 500 most abundant proteins.
Fig. 2
Fig. 2. Supervised statistical analysis of genes and proteins temporal expression.
Temporal signature (T versus T0 comparison, horizontally). Number of genes differentially expressed (DE) and proteins differentially abundant (DA) in proliferative (n = 3) and control nonproliferative CLL samples (n = 3) across time after cell stimulation (T1–T8), compared to initial (T0) expression/abundance (FDR < 1%). Response signature (proliferative versus nonproliferative comparison, vertically). Number of DE genes and DA proteins in proliferative CLL cells, compared to nonproliferative cells (FDR < 5%). Proliferative signature (combination of T versus T0 and proliferative versus nonproliferative comparisons). The intersection of the list of DE genes and DA proteins expressed in proliferative samples after BCR engagement compared to T0 (T versus T0), and the list of DE genes and DA proteins in the proliferative samples compared to the nonproliferative samples (proliferative versus nonproliferative) identifies the “proliferative signature” of genes and proteins specifically DE/DA after stimulation in proliferative samples.
Fig. 3
Fig. 3. Supervised statistical analysis of genes and proteins temporal expression in proliferating CLL cells.
A Number of DE genes and B number of DA proteins at each time point after cell stimulation in proliferating CLL cells. At each time point (T1–T8), the number of genes and proteins up- or downregulated (T versus T0 Log2FC) are shown in orange or blue, respectively. The number of genes and proteins specifically up- or downregulated in proliferative compared to nonproliferative cells are shown in dark orange or dark blue respectively in the graph.
Fig. 4
Fig. 4. Correlation of gene expressions and protein abundancies.
A Correlation between gene (G) and corresponding protein (P) at each time point after BCR engagement. The median value of the individual Pearson gene/protein correlation is indicated and represented with a color scale. B Heat map of the temporal expression/abundance of the 421 gene–protein pairs in the proliferating cells. Each line represents the temporal expression of a gene and its corresponding protein. At each time point, upregulated (T versus T0-positive Log2FC) or downregulated (T versus T0-negative Log2FC) genes and proteins are shown in red or blue, respectively.
Fig. 5
Fig. 5. Temporal propagation in the transcriptional and proteomic network of 2167 genes and 1074 proteins induced after BCR stimulation in proliferating cells.
Temporal graphical representation of statistical interactions (arrows) between genes (circle) and/or proteins (square) across time in the proliferating CLL cells after B-cell receptor stimulation. A color code represents genes and proteins differentially (DE/DA T versus T0) upregulated (orange) or downregulated (blue) at each time point after cell activation. Genes or proteins specifically up- or downregulated in proliferating cells from the proliferative signature (DE/DA T versus T0 and DE/DA P versus NP) are represented in dark orange or dark blue, respectively. Graphical representation made with Cytoscape software.
Fig. 6
Fig. 6. Nested temporal proliferative program induced after BCR stimulation in proliferating CLL cells.
The proliferative temporal subnetwork is represented in a time ordered graph, with genes (circle) and proteins (square) represented at their first time point of differential expression after cell activation (first time DE/DA T versus T0). Genes and proteins up- or downregulated are represented in orange or blue, respectively, and size of circles and squares are proportional to fold changes (Log2FC T versus T0). The 173 seeding proteins involved in “cell cycle” or “proliferation” are grouped in the upper part of the graph (layer#1). The 71 genes coding some of these 173 proteins are represented in the middle (layer#2). The 50 genes and 94 proteins also included in this proliferative subnetwork are grouped in the lower part of the graph (layer#3).

References

    1. Shaffer AL, 3rd, Young RM, Staudt LM. Pathogenesis of human B cell lymphomas. Annu Rev Immunol. 2012;30:565–610. - PMC - PubMed
    1. Niiro H, Clark EA. Regulation of B-cell fate by antigen-receptor signals. Nat Rev Immunol. 2002;2:945–56. - PubMed
    1. Messmer BT, Albesiano E, Efremov DG, Ghiotto F, Allen SL, Kolitz J, et al. Multiple distinct sets of stereotyped antigen receptors indicate a role for antigen in promoting chronic lymphocytic leukemia. J Exp Med. 2004;200:519–25. - PMC - PubMed
    1. Caligaris-Cappio F. Role of the microenvironment in chronic lymphocytic leukaemia. Br J Haematol. 2003;123:380–8. - PubMed
    1. Herishanu Y, Perez-Galan P, Liu D, Biancotto A, Pittaluga S, Vire B, et al. The lymph node microenvironment promotes B-cell receptor signaling, NF-kappaB activation, and tumor proliferation in chronic lymphocytic leukemia. Blood. 2011;117:563–74. - PMC - PubMed

Publication types