Observational Study
. 2021 May;22(5):607-619.
doi: 10.1038/s41590-021-00910-8. Epub 2021 Apr 8.

Single-cell analysis of FOXP3 deficiencies in humans and mice unmasks intrinsic and extrinsic CD4+ T cell perturbations

Affiliations
Observational Study

Single-cell analysis of FOXP3 deficiencies in humans and mice unmasks intrinsic and extrinsic CD4+ T cell perturbations

David Zemmour et al. Nat Immunol. 2021 May.

Abstract

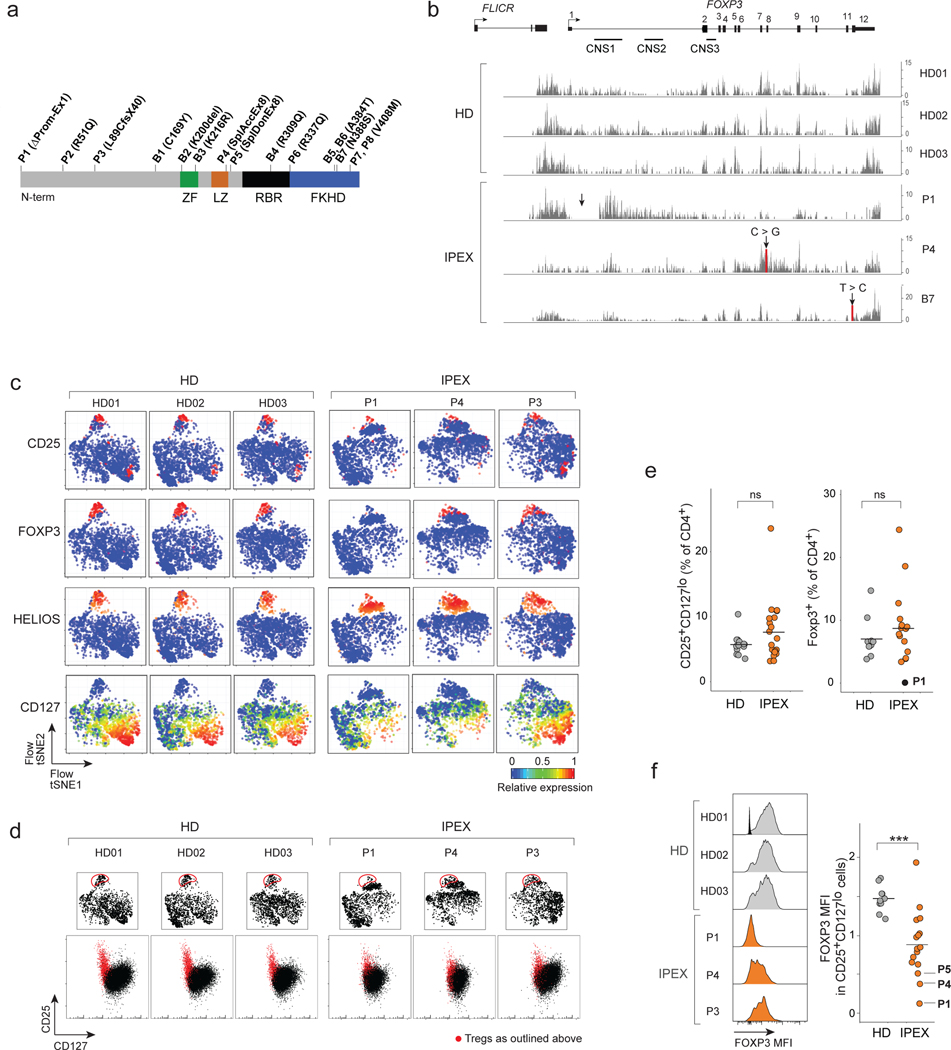
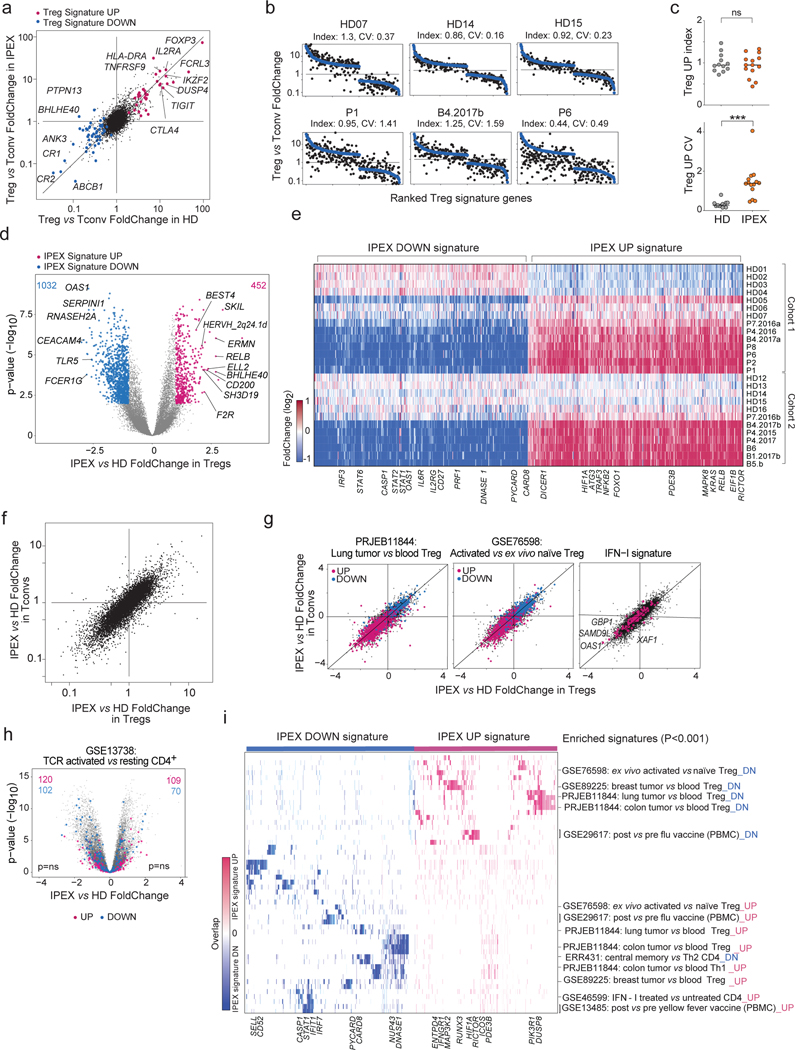
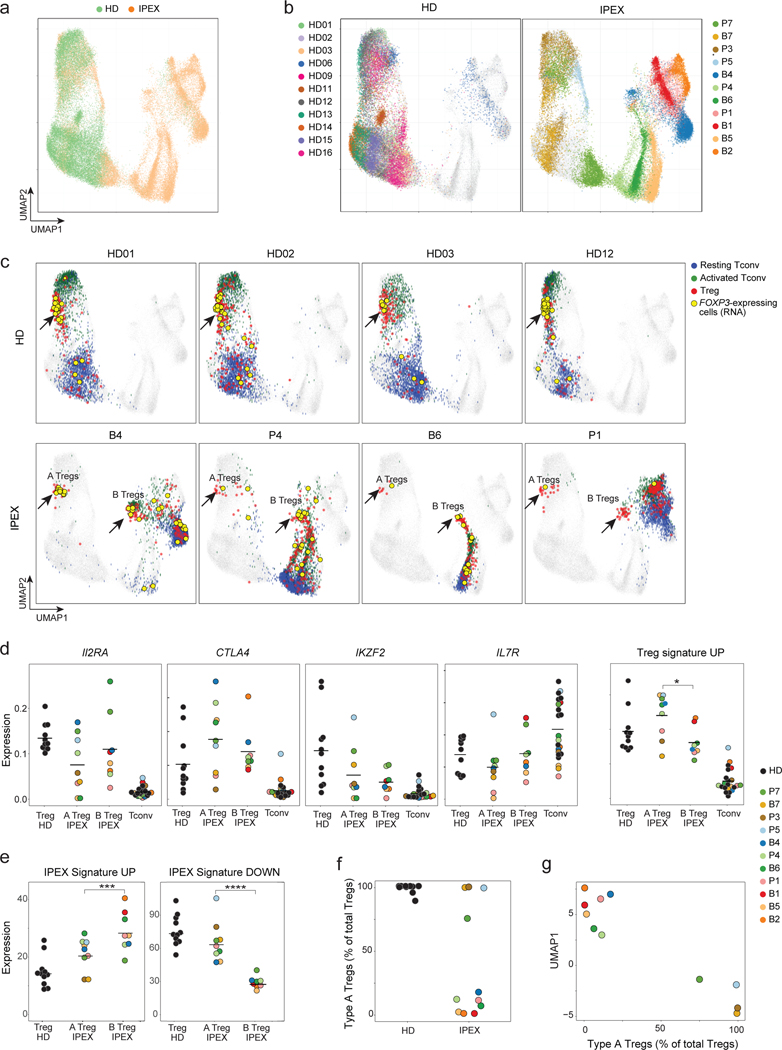
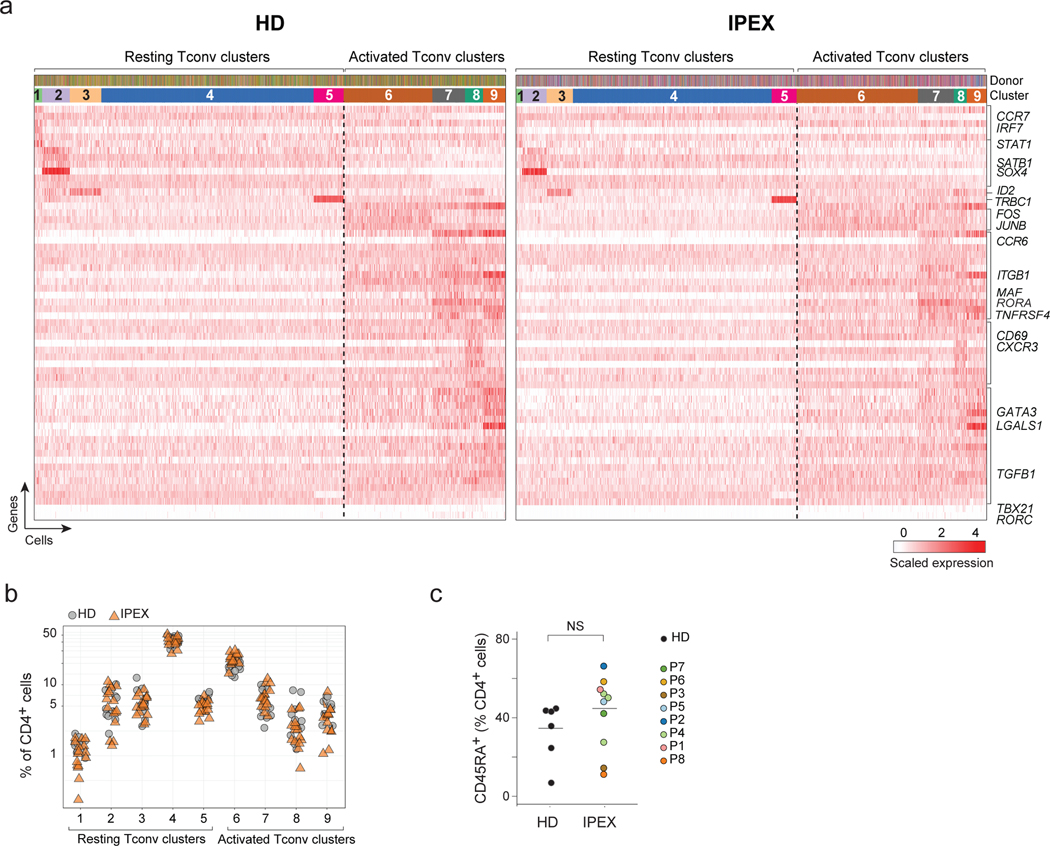
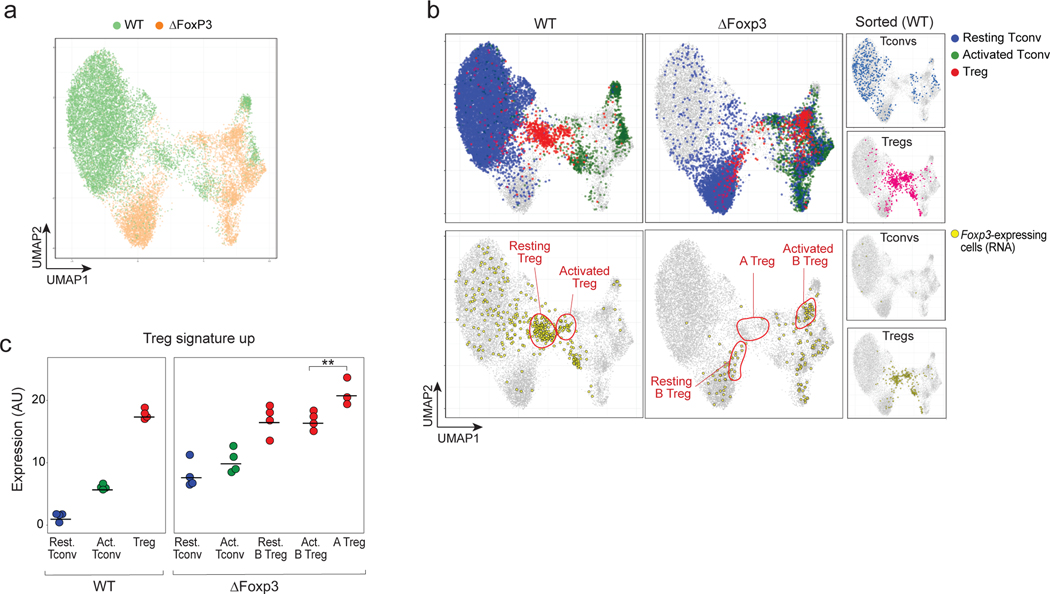
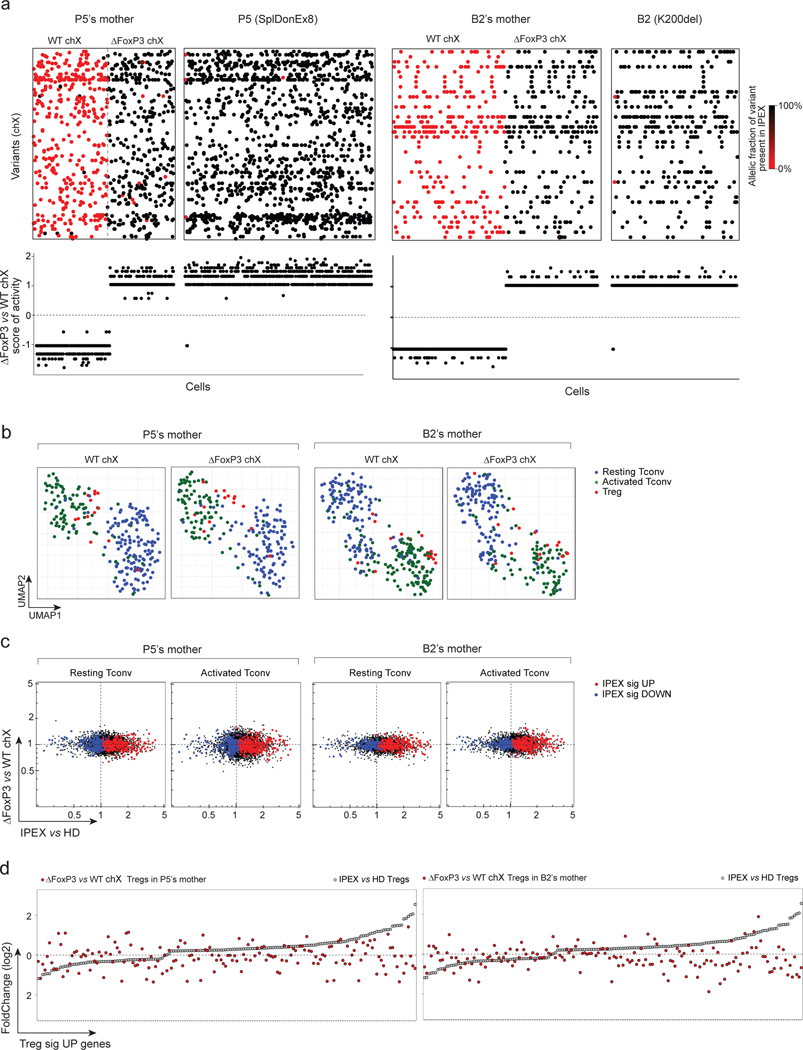
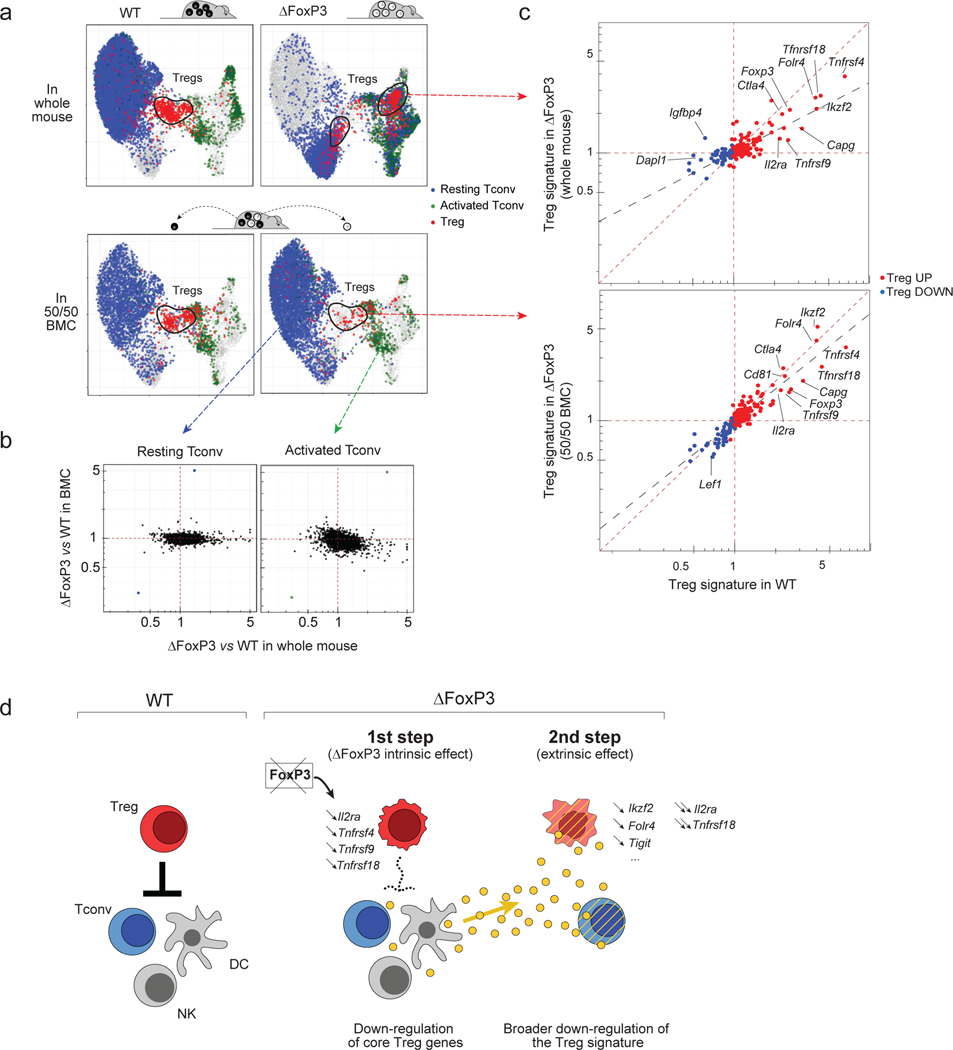
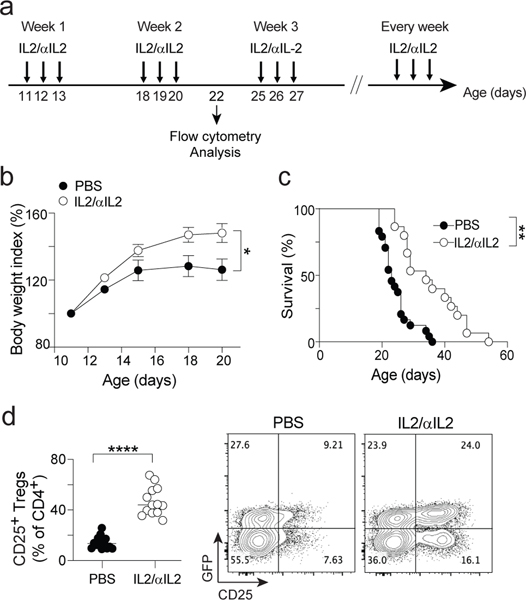
FOXP3 deficiency in mice and in patients with immune dysregulation polyendocrinopathy enteropathy X-linked (IPEX) syndrome results in fatal autoimmunity by altering regulatory T (Treg) cells. CD4+ T cells in patients with IPEX syndrome and Foxp3-deficient mice were analyzed by single-cell cytometry and RNA-sequencing, revealing heterogeneous Treg-like cells, some very similar to normal Treg cells, others more distant. Conventional T cells showed no widespread activation or helper T cell bias, but a monomorphic disease signature affected all CD4+ T cells. This signature proved to be cell extrinsic since it was extinguished in mixed bone marrow chimeric mice and heterozygous mothers of patients with IPEX syndrome. Normal Treg cells exerted dominant suppression, quenching the disease signature and revealing in mutant Treg-like cells a small cluster of genes regulated cell-intrinsically by FOXP3, including key homeostatic regulators. We propose a two-step pathogenesis model: cell-intrinsic downregulation of core FOXP3-dependent genes destabilizes Treg cells, de-repressing systemic mediators that imprint the disease signature on all T cells, furthering Treg cell dysfunction. Accordingly, interleukin-2 treatment improved the Treg-like compartment and survival.


Conflict of interest statement

COMPETING INTERESTS STATEMENT

The authors declare no competing interests.

Figures

Fig. 1.
Fig. 1.. Identification of Treg-like cells in IPEX by flow cytometry.
a. Position of the FOXP3 mutations in the IPEX cohorts (domains: ZF: zinc-finger; LZ: leucine-zipper; RBR: RUNX1 binding region; FKH: Forkhead). n = 15 IPEX b. Mapping of RNAseq reads from CD4+CD25+CD127lo cells to the FOXP3 locus in representative samples (see Fig. S1). Arrow indicates mutation. c. Flow-tSNE plot of CD4+ T cells, from anti-CD3, CD4, CD25, CD127, HELIOS, CD45RA and FOXP3 staining in representative samples (full set in Fig. S3). Color represents scaled expression. d. Flow cytometric anti-CD25/CD127 plots of CD4+ T cells (bottom row); red: cells gated in the flow-tSNE plot, top row. e. Proportion of CD25+CD127lo cells and total FOXP3+ cells in HD and IPEX (each dot a sample) (see Fig. S2a), ns non significant, two-sided t.test. n = 15 IPEX, n = 13 HD. f. FOXP3 expression in CD25+CD127lo HD and IPEX cells. Left: representative cytometry profiles (see Fig. S2b for all other samples; one unstained control overlaid with HD01), quantitation at right (each dot a sample; *** two-sided t.test p < 0.001, n = 15 IPEX, n = 13 HD).
Fig. 2.
Fig. 2.. Transcriptional changes in IPEX Treg and Tconv cells by population RNAseq.
Population RNAseq was performed on sorted Tconv and Treg-like cells from HD (n=12) and IPEX (n = 10) donors. a. The Treg/Tconv FoldChange in HD (x-axis) and IPEX (y-axis); Treg signature genes are highlighted. b. Ranked FC plots of Treg signature transcripts for individual donors, ranked according to mean FC in all HD (blue dots). FC values for each donor (black dots) computed from the donor’s Treg vs the mean of HD Tconv. c. Index and coefficient of variation (CV) of Treg Up signature transcripts (each dot is a sample). *** two-sided t.test p < 0.001. d. FoldChange vs p value (volcano) plot comparing normalized expression in all IPEX to all HD samples. Genes with differential expression (two-sided t.test p<0.01, FC >2) are highlighted (452 up genes and 1032 down genes), and numbers shown. e. Heatmap of the expression ratio, for IPEX signature genes defined in d, in Tregs from each donor, computed against the mean expression in HD Tregs (each cohort computed against its own HD Treg set). f. Comparison of mean IPEX effect (all IPEX vs all HD samples) in Treg (x-axis) versus Tconv (y-axis). g. Same FC/FC plot as in f, but highlighted with representative signatures of tumor-infitrating Tregs, activated Treg vs resting Treg, and IFN-I induced genes. h. Same volcano plot as in d, but with highlights from a representative CD4+ T activation signature (ns, hypergeometric test). i. Heatmap, for the IPEX signature genes defined in d, of their overlap with the pathways and signatures that significantly overlap with the IPEX signature (hypergeometric test p<0.001). Present genes are shown by tick marks, color-coded by their IPEX/HD FoldChange.
Fig. 3.
Fig. 3.. scRNAseq reveals the heterogeneous effect of FOXP3 deficiency in IPEX Tregs
scRNAseq was performed on peripheral blood CD4+ T cells from IPEX (n = 11) and HD (n = 11). a. 2D UMAP plot of all CD4+ cells from IPEX and HD samples (52,776 cells altogether, merged with Canonical Correlation Analysis and knn-graph, see Methods) b. Same UMAP as a, color-coded by individual donor (see also Fig. S6d). c. Same UMAP as a, with four representative HD and IPEX donors (see Fig. S8 for other donors). Blue, green, and red cells are resting Tconvs, activated Tconvs, and Tregs, respectively. FOXP3-expressing cells (RNA) are yellow. Type A and B Tregs in IPEX donors are indicated by an arrow. d. Normalized counts expression of IL2RA, CTLA4, IKZF2, IL7R, and the Treg signature in Tregs from HD and IPEX (type A and B) and Tconv cells; each dot is a sample. * t.test p < 0.05 e. Average expression of the IPEX signature in type A and B IPEX Tregs and HD Tregs (normalized counts). *** p < 10–3, **** p < 10–4, two-sided t.test. f. Proportion of type A Tregs in total Tregs for each sample. g. Proportion of Type A Tregs plotted against the average UMAP1 dimension for each sample.
Fig. 4.
Fig. 4.. Normal Tconv phenotypes in IPEX patients
a. From the scRNAseq Tconv datasets (HD and IPEX combined), the IPEX signature was regressed out (see Methods) and biclustering was performed to define clusters in resting and activated Tconv. plotted as a heatmap for expression of the most characteristic genes for each Tconv cluster (each vertical line represents one cell). Top ribbons indicate donor origin and cluster annotations for every cell. b. Proportion of resting and activated Tconv clusters in total CD4+ cells in HD and IPEX in scRNAseq data. c. Proportion of CD45RA+ (resting) CD4+ T cells determined by flow cytometry in IPEX and HD. ns, non-significant (two-sided t.test, n= 11 HD, 11 IPEX).
Fig. 5.
Fig. 5.. scRNAseq reveals heterogeneous effects of the Foxp3 ablation in ΔFoxp3 mice
scRNAseq was performed on CD4+ T cells from WT (n = 4) and ΔFoxp3 (n = 4) mice (18,097 cells altogether). a. 2D UMAP plot of CD4+ single-cell transcriptomes for WT (green) and ΔFoxp3 (orange) b. Same UMAP as b. Top row: resting Tconv (blue), activated Tconvs (green), and Tregs (red) (assigned by graph-based clustering on the merged dataset after regressing out the ΔFoxp3 signature, see Methods) are highlighted; bottom: cells with an active Foxp3 locus (GFP or Cre transcripts detected) are colored yellow. The small inserts on the right show sorted control WT Tconvs and WT Tregs, sorted and included as spike-in controls. c. Treg signature expression in resting Tconvs, activated Tconvs, and Tregs in WT and ΔFoxp3 mice (normalized counts). ** p < 10–2, two-sided t.test.
Fig. 6.
Fig. 6.. Cell intrinsic and extrinsic effect of FOXP3 deficiency in Tregs and Tconvs of IPEX female carriers (mothers)
scRNAseq was performed on sorted and hashtagged blood CD4+ T cells from two IPEX mothers: P5’s and B2’s mothers (2,880 cells altogether) a. Because of X inactivation in females a mix of FOXP3-deficient (ΔFOXP3) and -proficient (WT) T cells are present in IPEX mothers (left: P5’s mother, right: B2’s mother). Top: biclustering heatmap showing in each single cell (columns) the allelic fraction of X chromosome variants present in IPEX (P5 and B2) (carrying the FOXP3 mutation). Bottom: FOXP3-deficient vs -proficient X chromosome score of activity for each single cell. b. 2D UMAP plot of all CD4+ cells from P5’s and B2’s mothers split by active X chromosome (left: FOXP3-proficient, right: FOXP3-deficient). Resting Tconvs, activated Tconvs and Tregs are highlighted in blue, green and red, respectively. c. scRNAseq data for Tconv cells were collapsed, and expression ratio between FOXP3-deficient and -proficient Tconv (resting or activated) calculated for IPEX (x-axis) and in P5’s and B2’s mothers (y-axis). Up and down IPEX signatures genes in red and blue, respectively. d. FC plots of FOXP3-deficient vs -proficient Treg in P5’s and B2’s mothers, Treg UP signature genes, ranked according to FC in IPEX vs HD (grey dots).
Fig. 7.
Fig. 7.. Cell intrinsic and extrinsic effect of Foxp3 deficiency in Tregs and Tconvs in mice
scRNAseq was performed on sorted and hashtagged CD4+ T cells from 50/50 mixed BMC mice (WT and ΔFoxp3 hematopoietic stem cells, congenically marked) (8,556 cells altogether, n = 3 mice) a. Same UMAP as 5b. integrating WT and ΔFoxp3 CD4+ cells from whole mice (top) or from chimeras (bottom row). Resting Tconvs (blue), activated Tconvs (green), and Tregs (red) (identified by graph-based clustering on the merged dataset after regressing out the ΔFoxp3 signature, see Methods) are color-coded as in Fig. 5. b. scRNAseq data for Tconv cells were collapsed, and expression ratio between WT and ΔFoxp3 Tconv calculated for whole mice (x-axis) or for 50/50 BMC (y-axis); for the latter, WT and ΔFoxp3 cells originated from the same host. c. Treg/Tconv ratio in ΔFoxp3 cells (y-axis) in whole mice (top) and in 50/50 BMC (bottom), both plotted against the same Treg/Tconv expression ratio in WT (x-axis). Treg signature genes are highlighted. Dashed lines (linear regression) represent the slope of the fit. d. Two-step model of the impact of FOXP3 deficiency in mice and humans. First, the absence of FOXP3 downregulates a few core Treg signature genes in Tregs (cell-intrinsic effect), leading to perturbed control of other immune cells (which might include known Treg targets like Tconv, DCs, NKs, or other), unleashing a secondary inter-cellular response (e.g. cytokines, cell surface modulators) which imprints the dominant IPEX signature on Treg and Tconv, and further affects Treg functionality, amplifying disease pathology.
Figure 8:
Figure 8:. IL2 therapy mitigates Foxp3 deficiency disease.
a. IL2 treatment protocol: daily injection of IL2/αIL2 complex for three consecutive days every week starting 11 days after birth. b. Body weight index growth curves of vehicle (PBS) and IL2 (IL2/αIL2) treated ΔFoxp3 mice (mean +/− SEM). * One-way ANOVA p < 0.05 (b), n = 10 and 19 (PBS and IL2 groups, respectively) c. Survival curves of vehicle (PBS) and IL2 (IL2/αIL2) treated ΔFoxp3 mice ** Log Rank test p < 10–4, n = 24 and 15 (PBS and IL2 groups, respectively) d. Proportion of CD25+GFP+ Tregs cells in vehicle (PBS) and IL2 (IL2/αIL2) treated ΔFoxp3 mice (day 22). Right: Representative flow cytometric CD25/GFP plots of CD4+ T cells. **** two-sided t.test p < 10–4, n = 14 and 13 (PBS and IL2 groups, respectively)

References

    1. Josefowicz SZ, Lu LF, & Rudensky AY Regulatory T cells: mechanisms of differentiation and function. Annu. Rev. Immunol 30, 531–564 (2012). - PMC - PubMed
    1. Wing JB, Tanaka A, & Sakaguchi S. Human FOXP3+ regulatory T cell heterogeneity and function in autoimmunity and cancer. Immunity. 50, 302–316 (2019). - PubMed
    1. Panduro M, Benoist C, & Mathis D. Tissue Tregs. Annu. Rev Immunol 34, 609–633 (2016). - PMC - PubMed
    1. Hill JA et al. Foxp3 transcription-factor-dependent and -independent regulation of the regulatory T cell transcriptional signature. Immunity. 27, 786–800 (2007). - PubMed
    1. Ferraro A et al. Interindividual variation in human T regulatory cells. Proc Natl Acad Sci U S A 111, E1111–E1120 (2014). - PMC - PubMed

Publication types

MeSH terms

Substances

Supplementary concepts