. 2021 May;53(5):672-682.
doi: 10.1038/s41588-021-00829-8. Epub 2021 Apr 8.

Silencing of LINE-1 retrotransposons is a selective dependency of myeloid leukemia

Affiliations

Silencing of LINE-1 retrotransposons is a selective dependency of myeloid leukemia

Zhimin Gu et al. Nat Genet. 2021 May.

Abstract

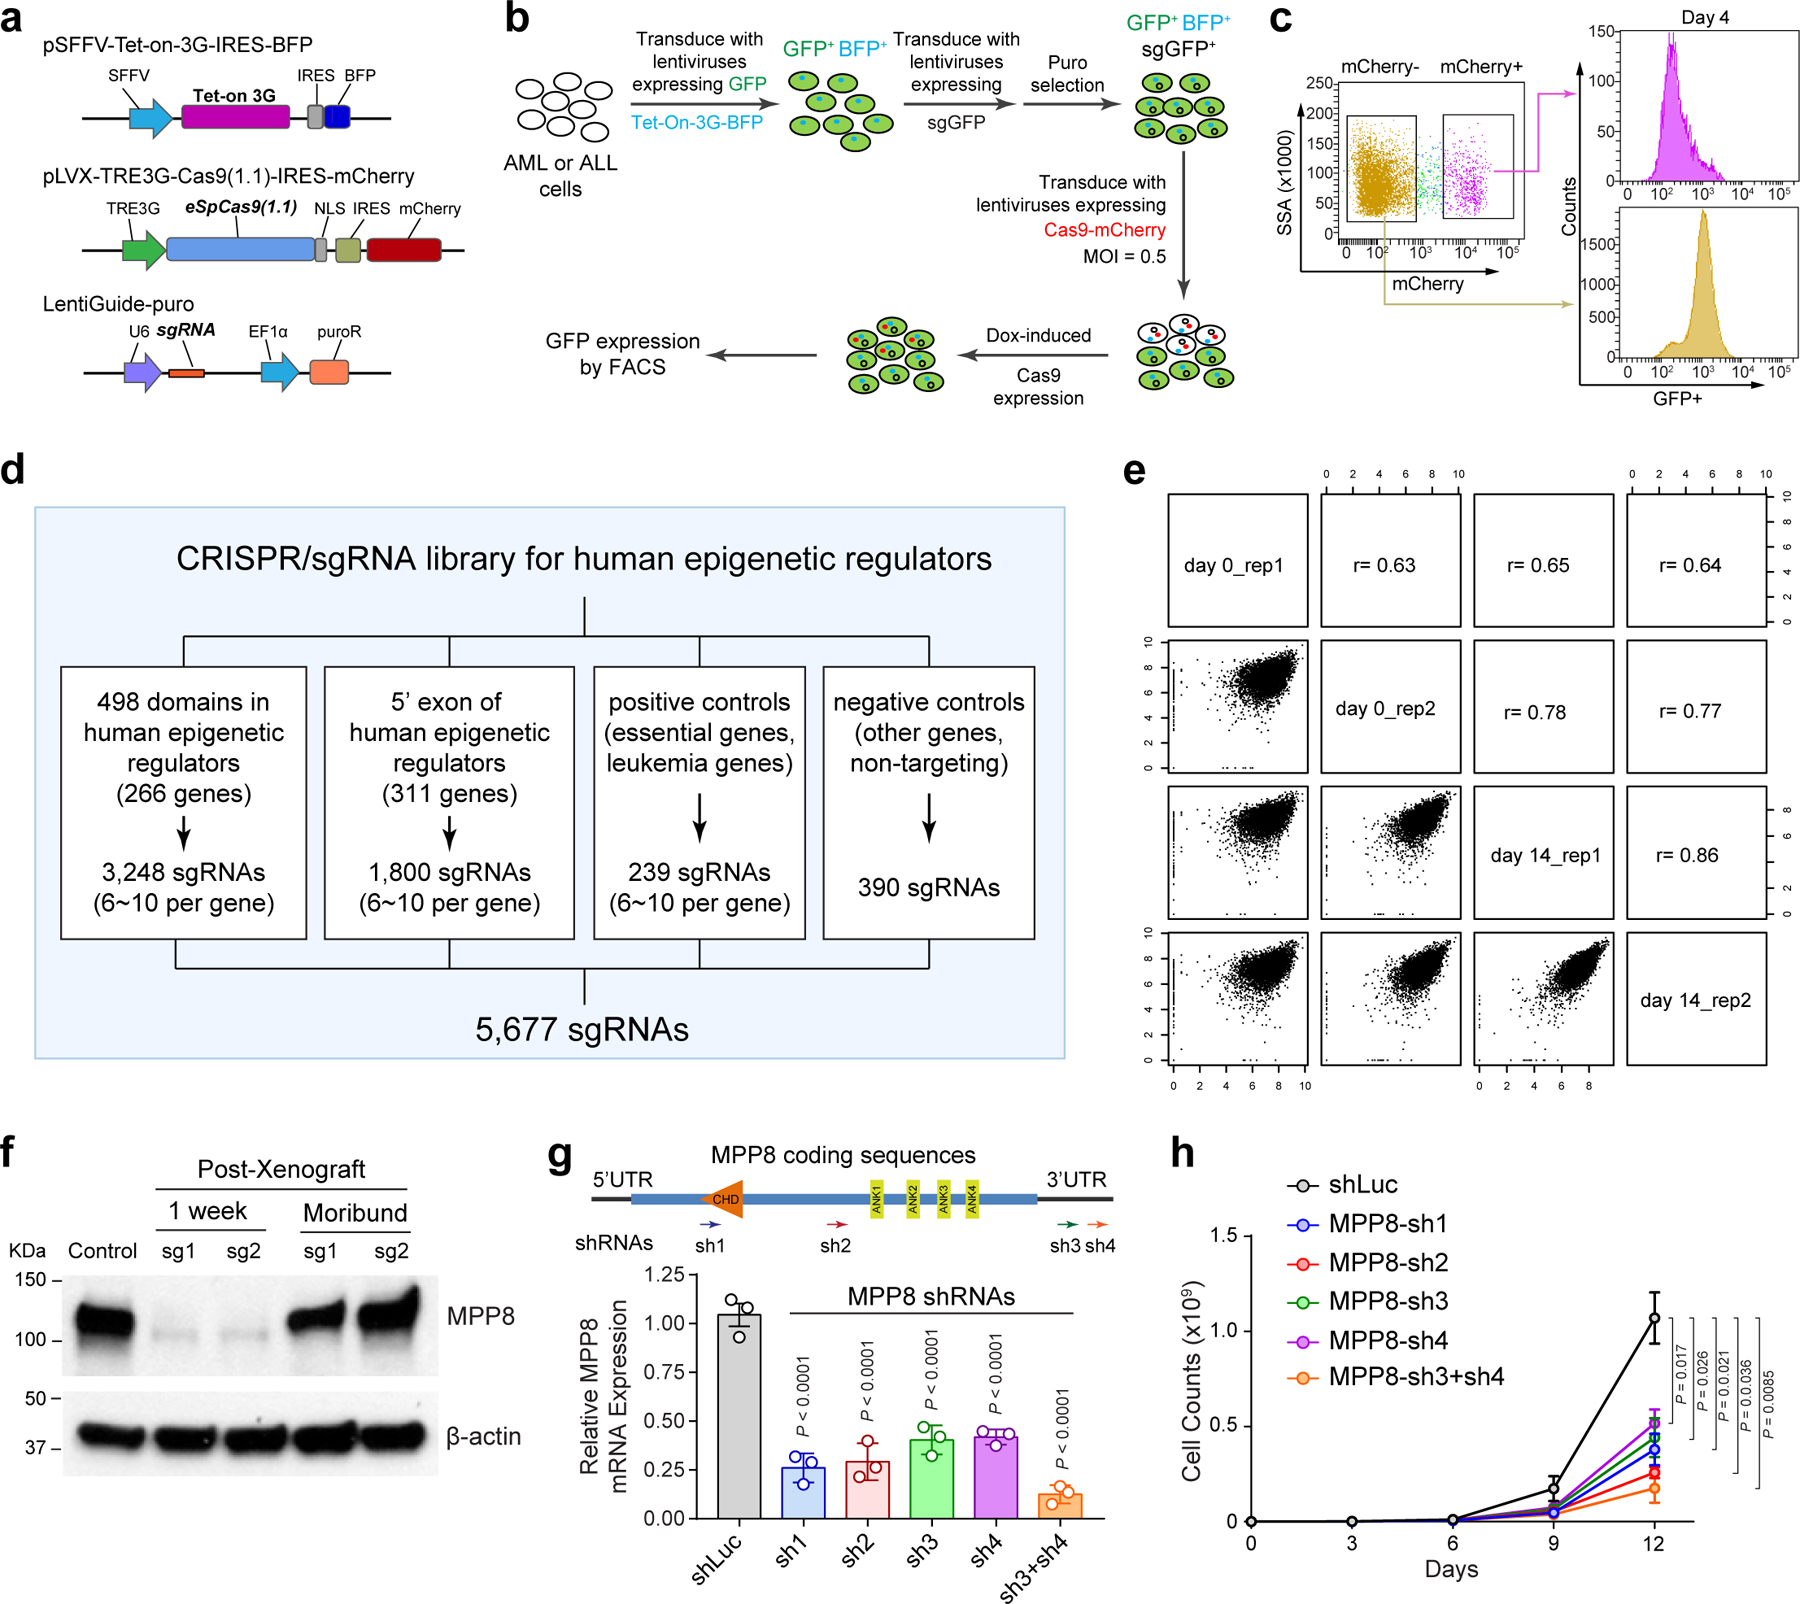
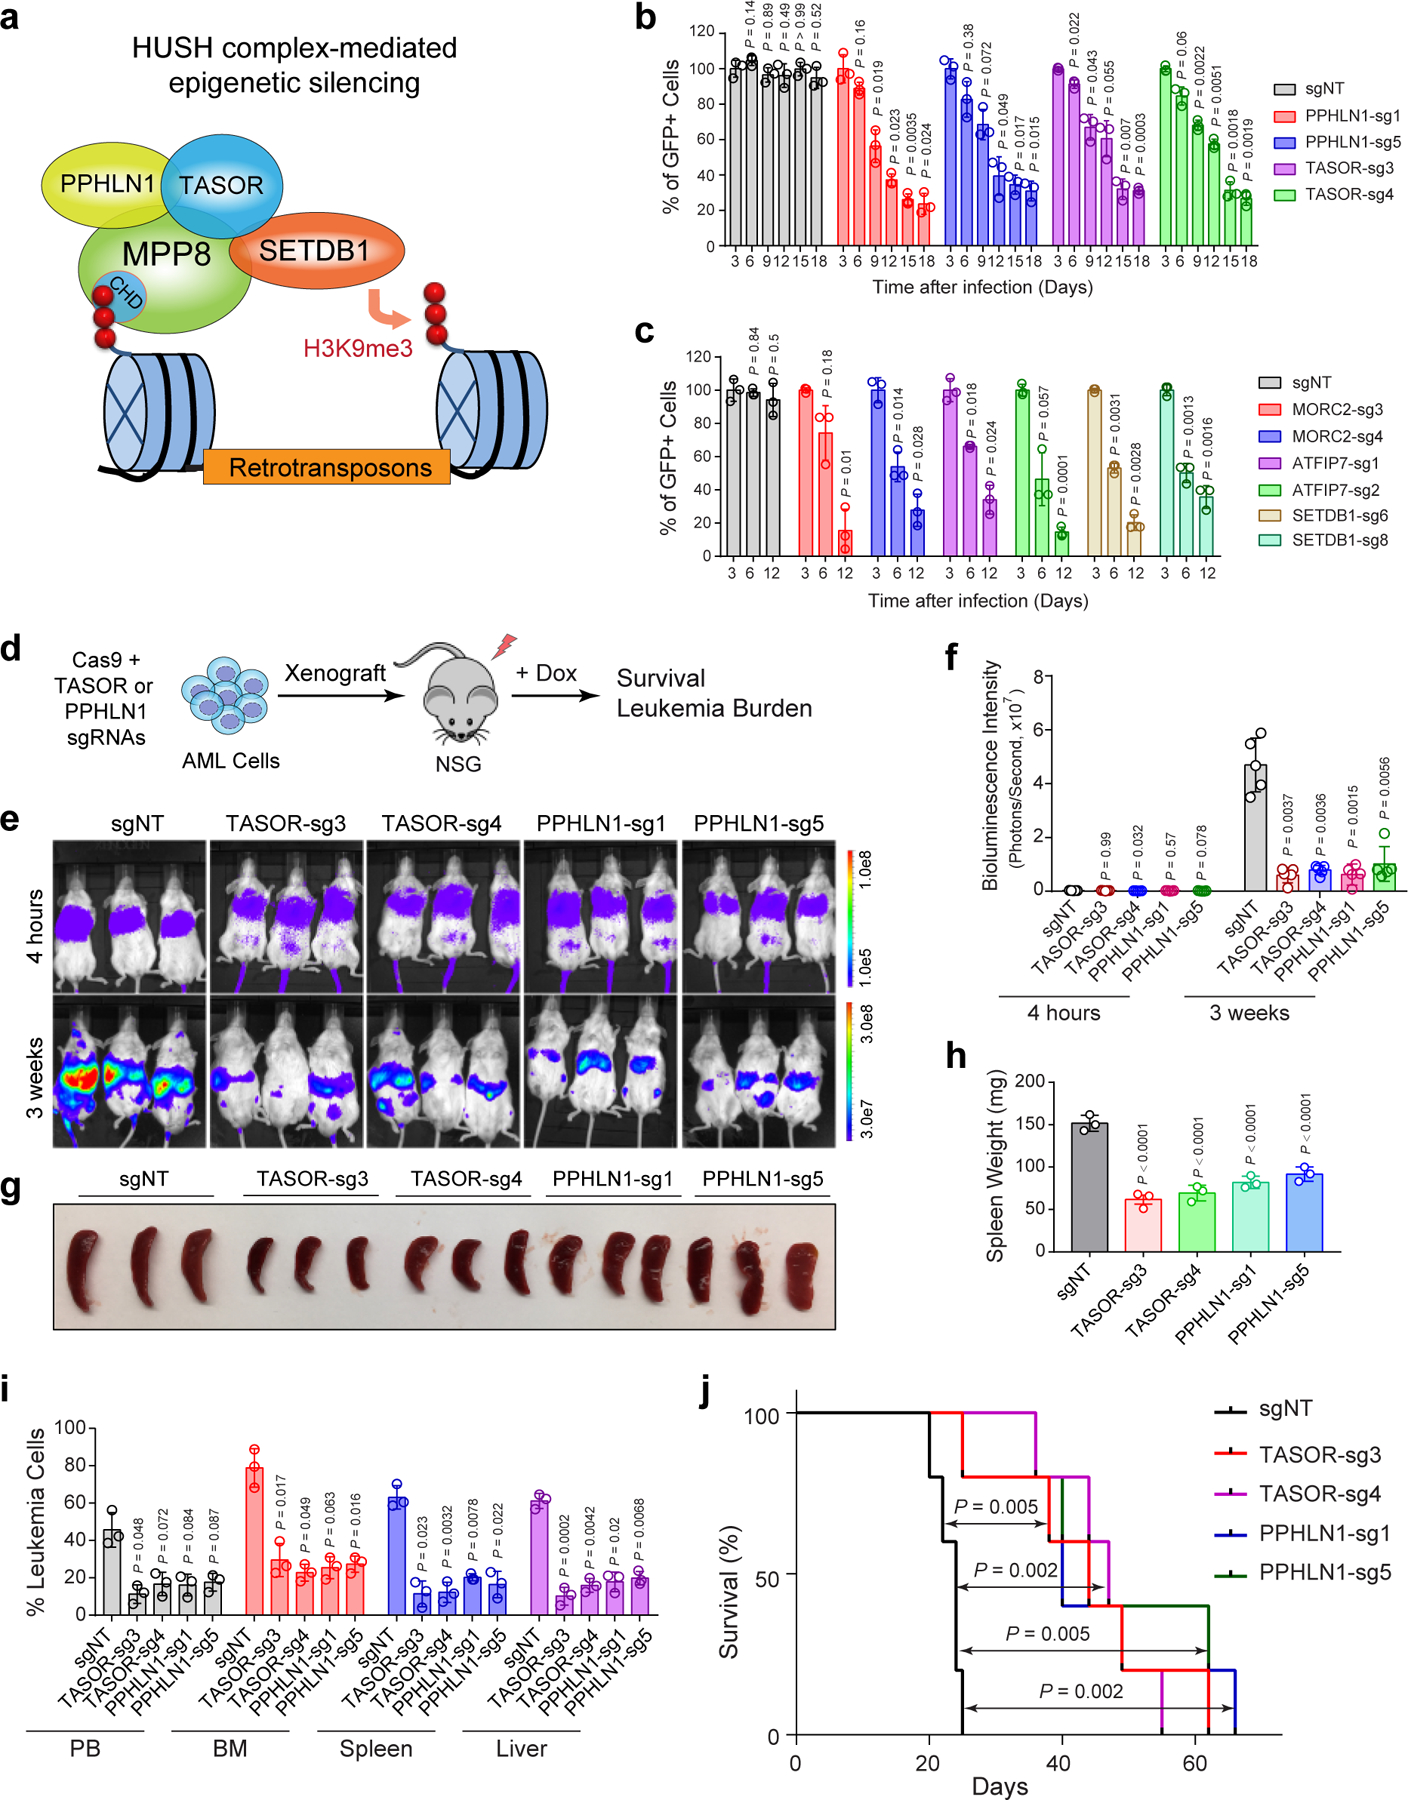
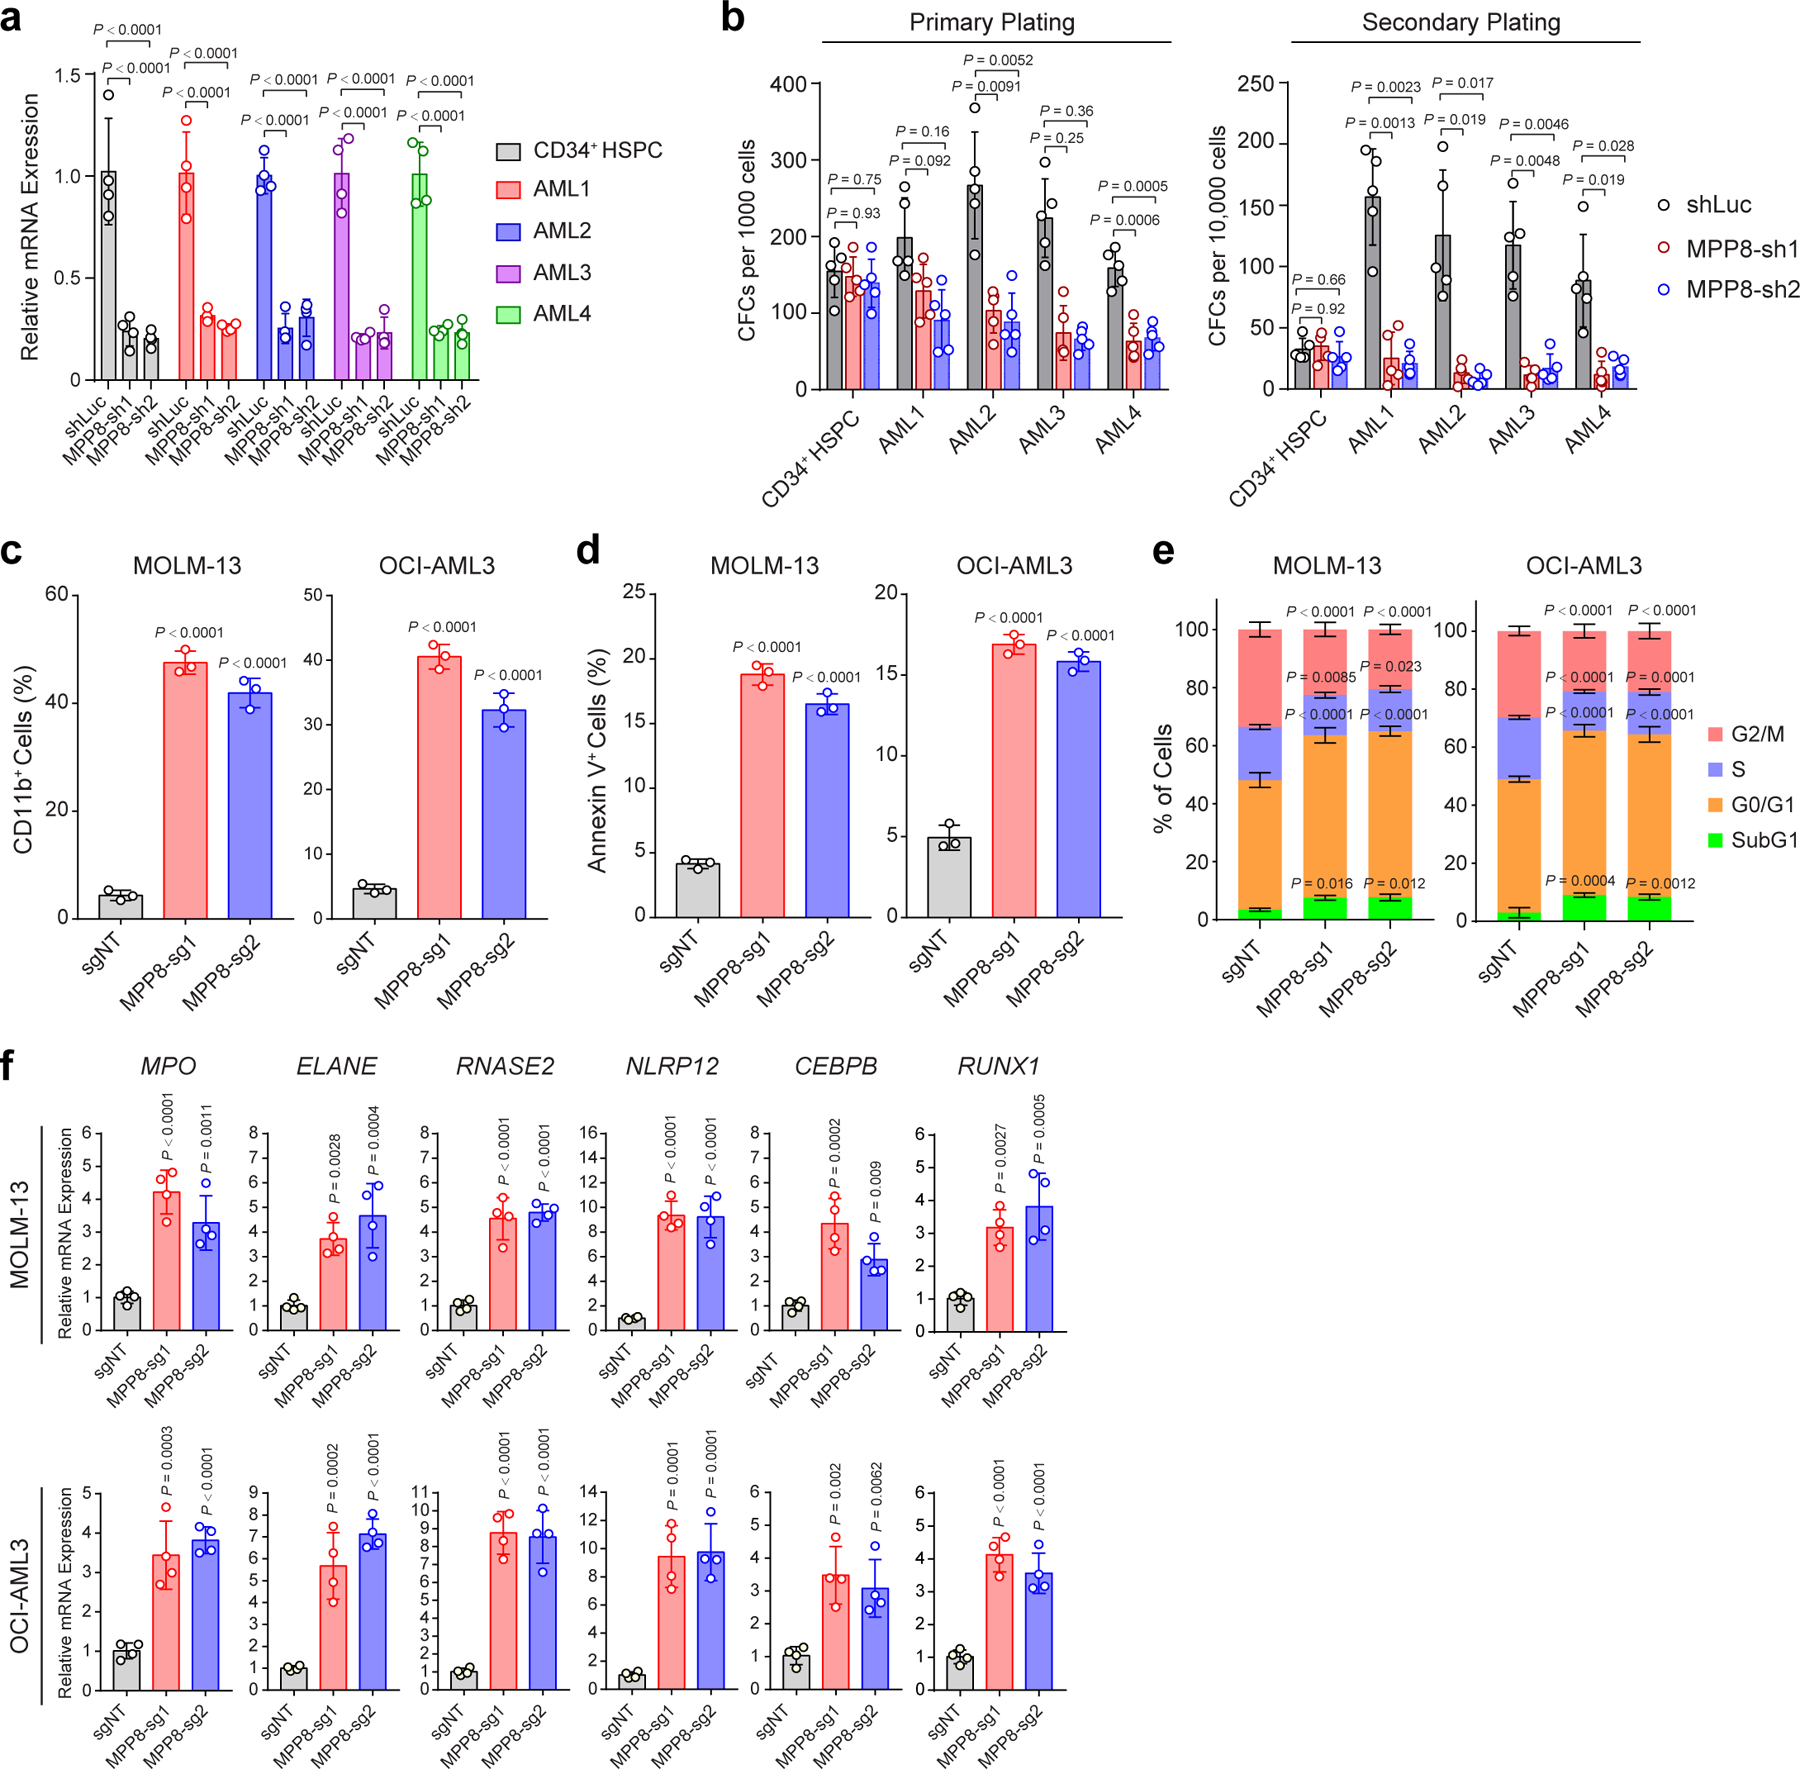
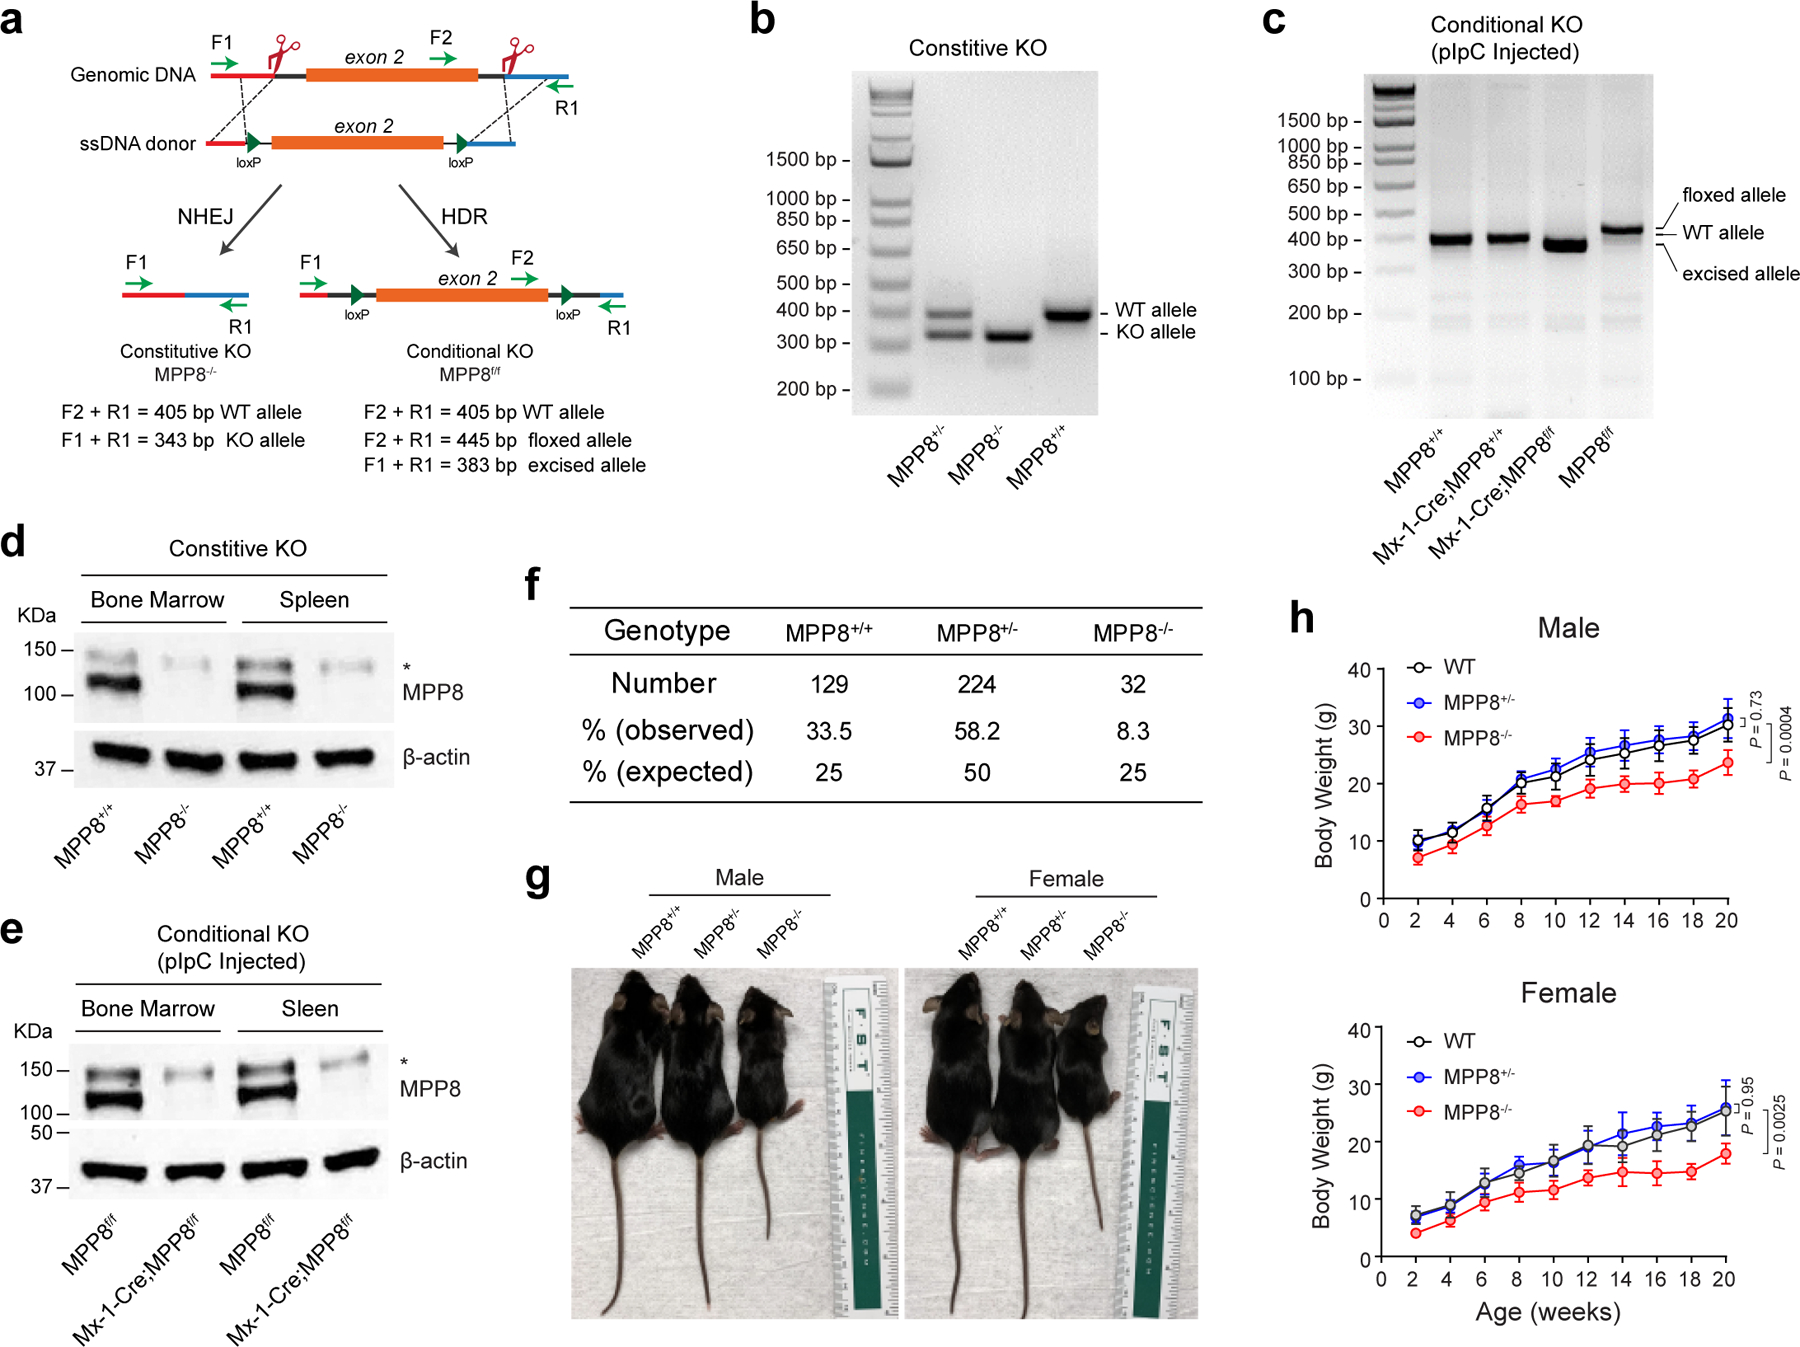
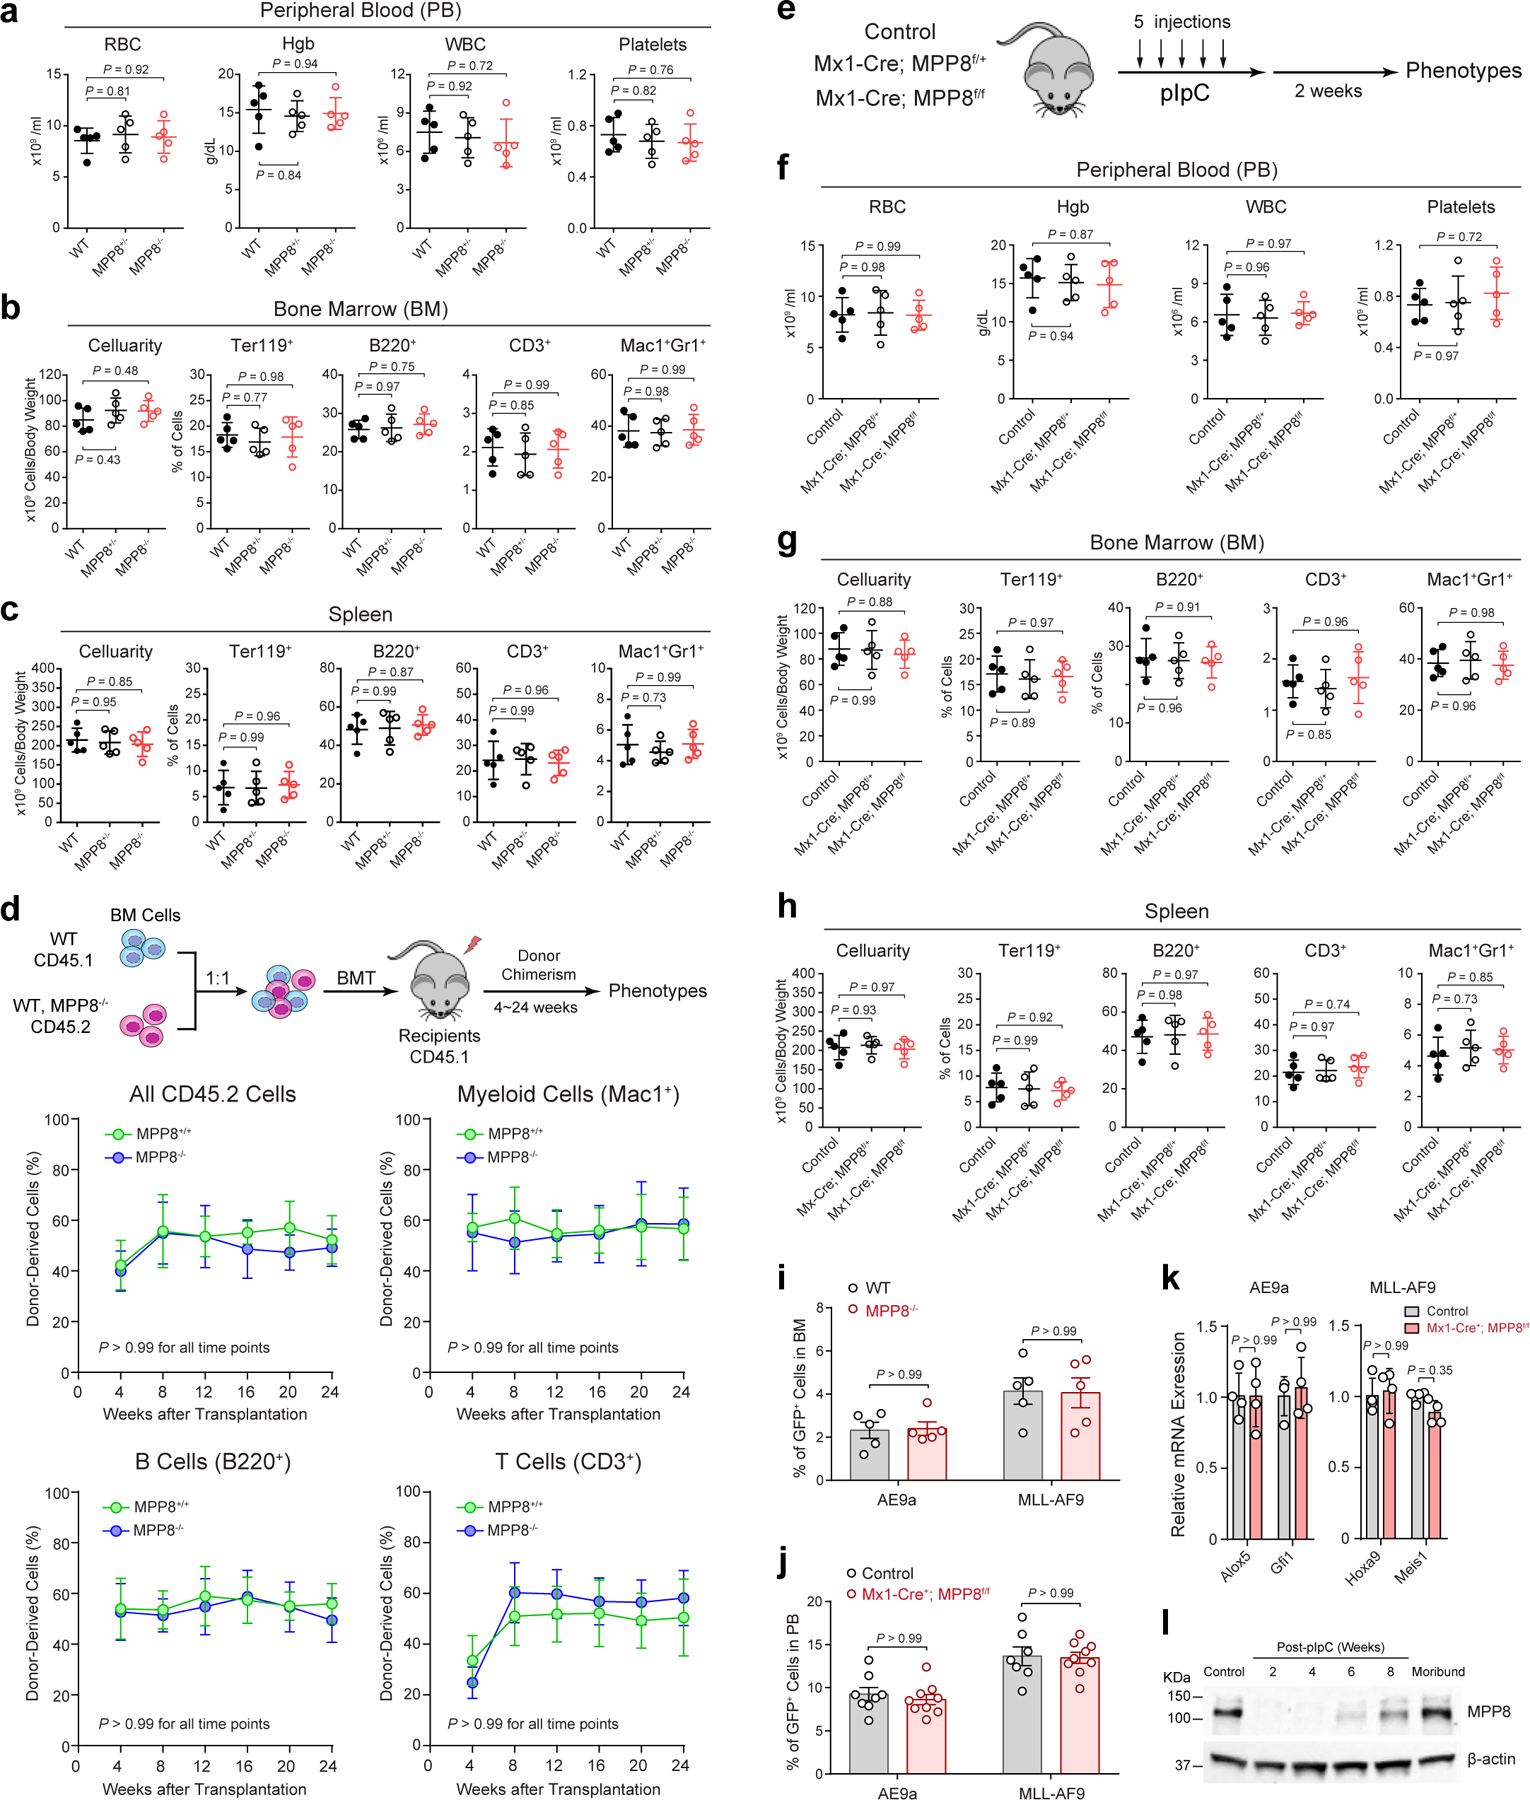
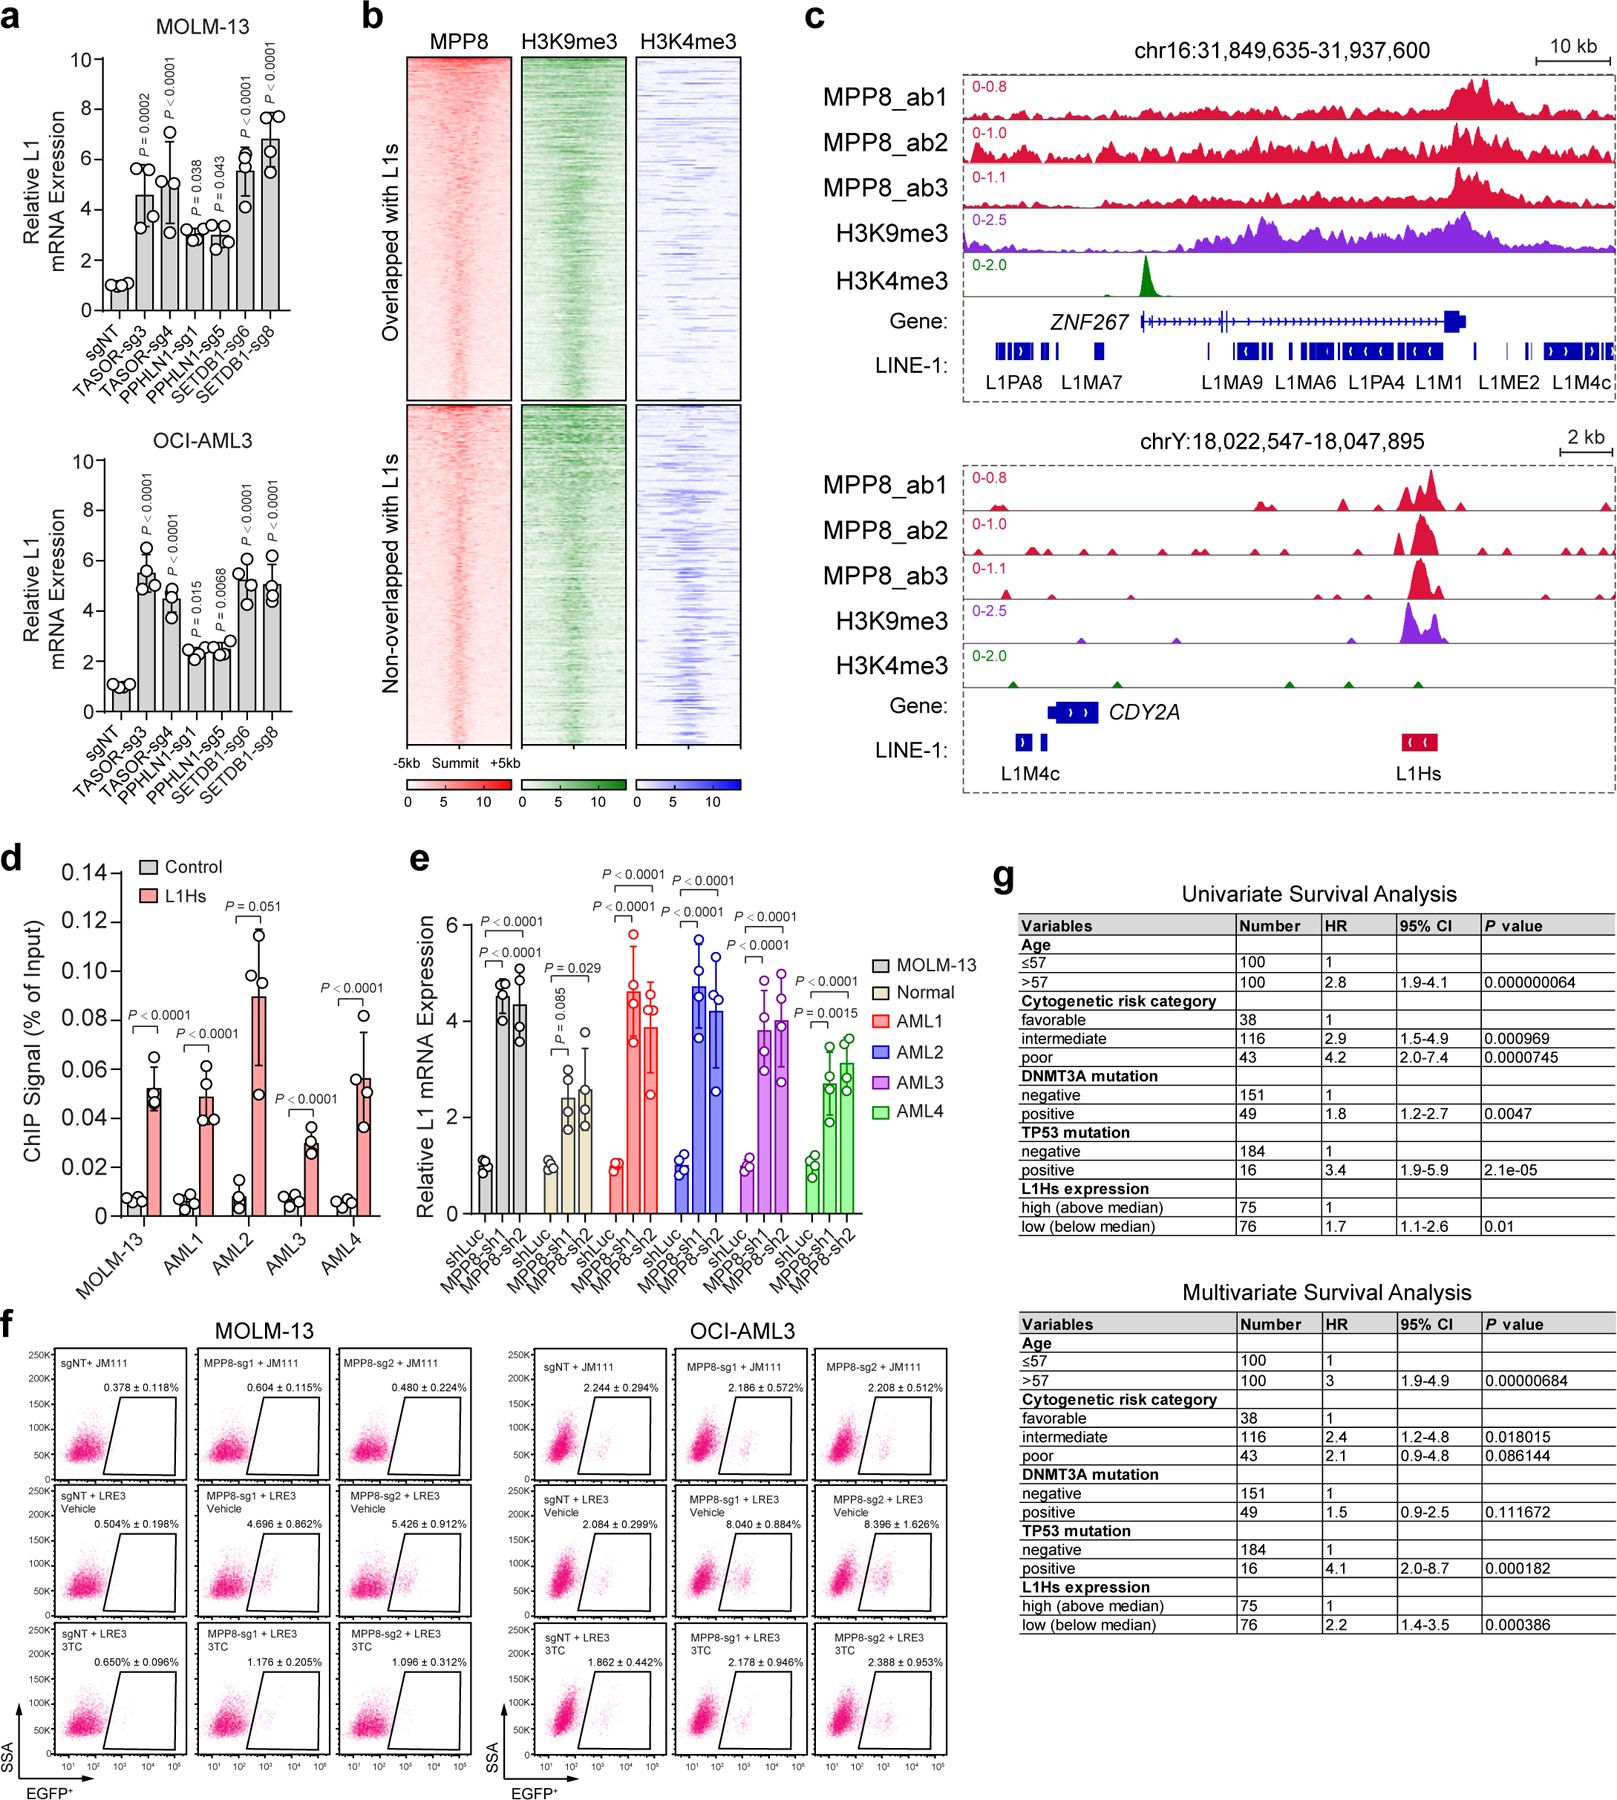
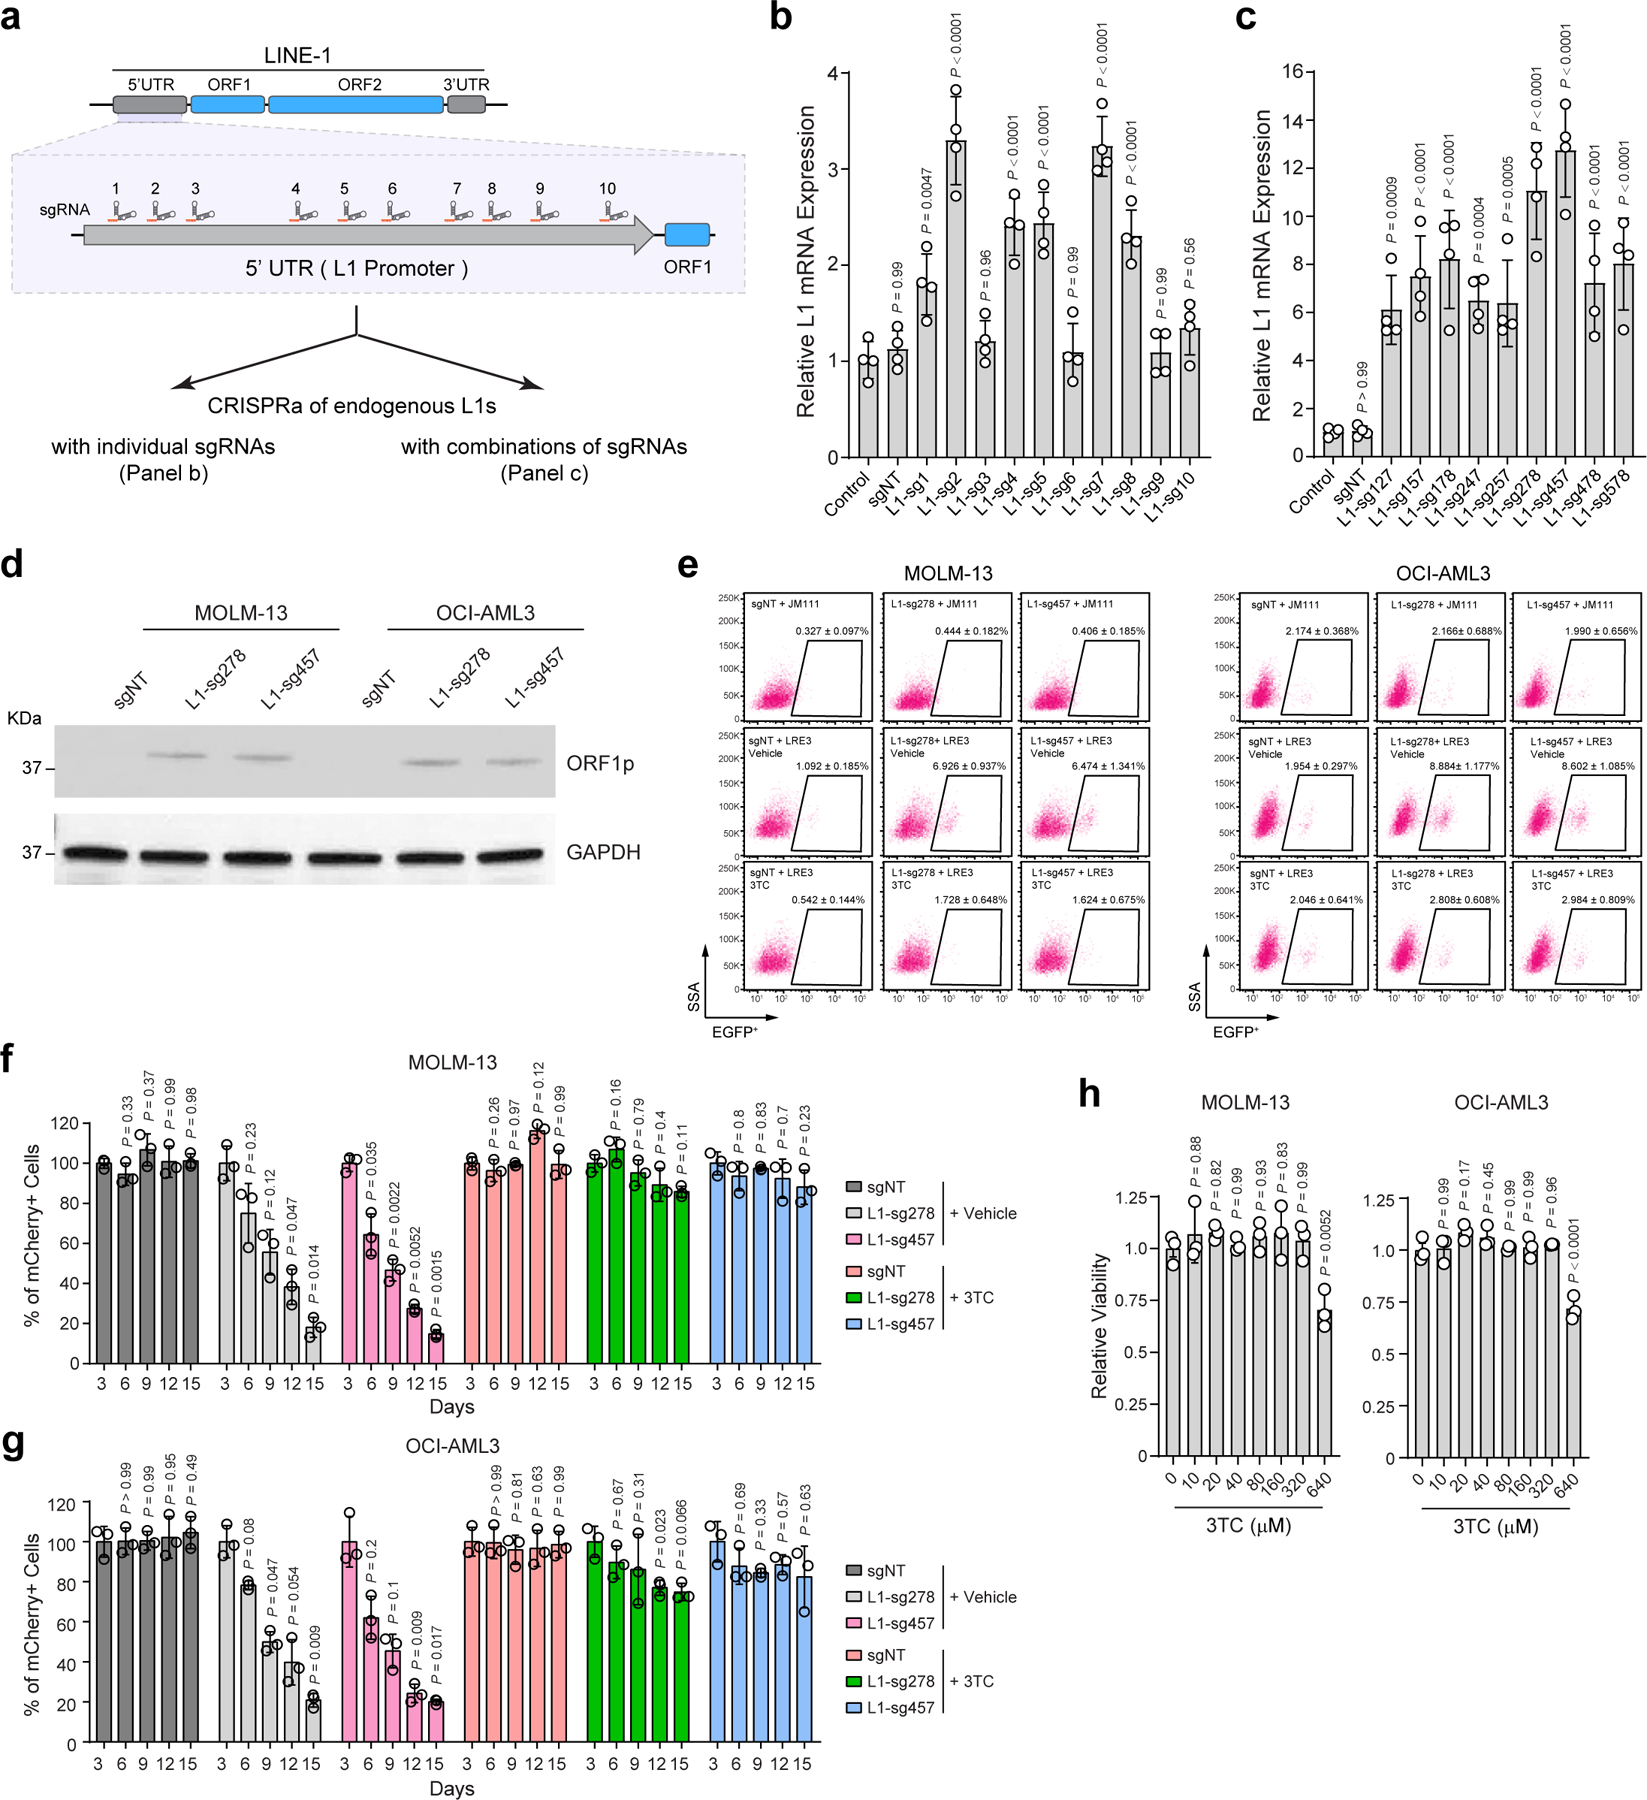
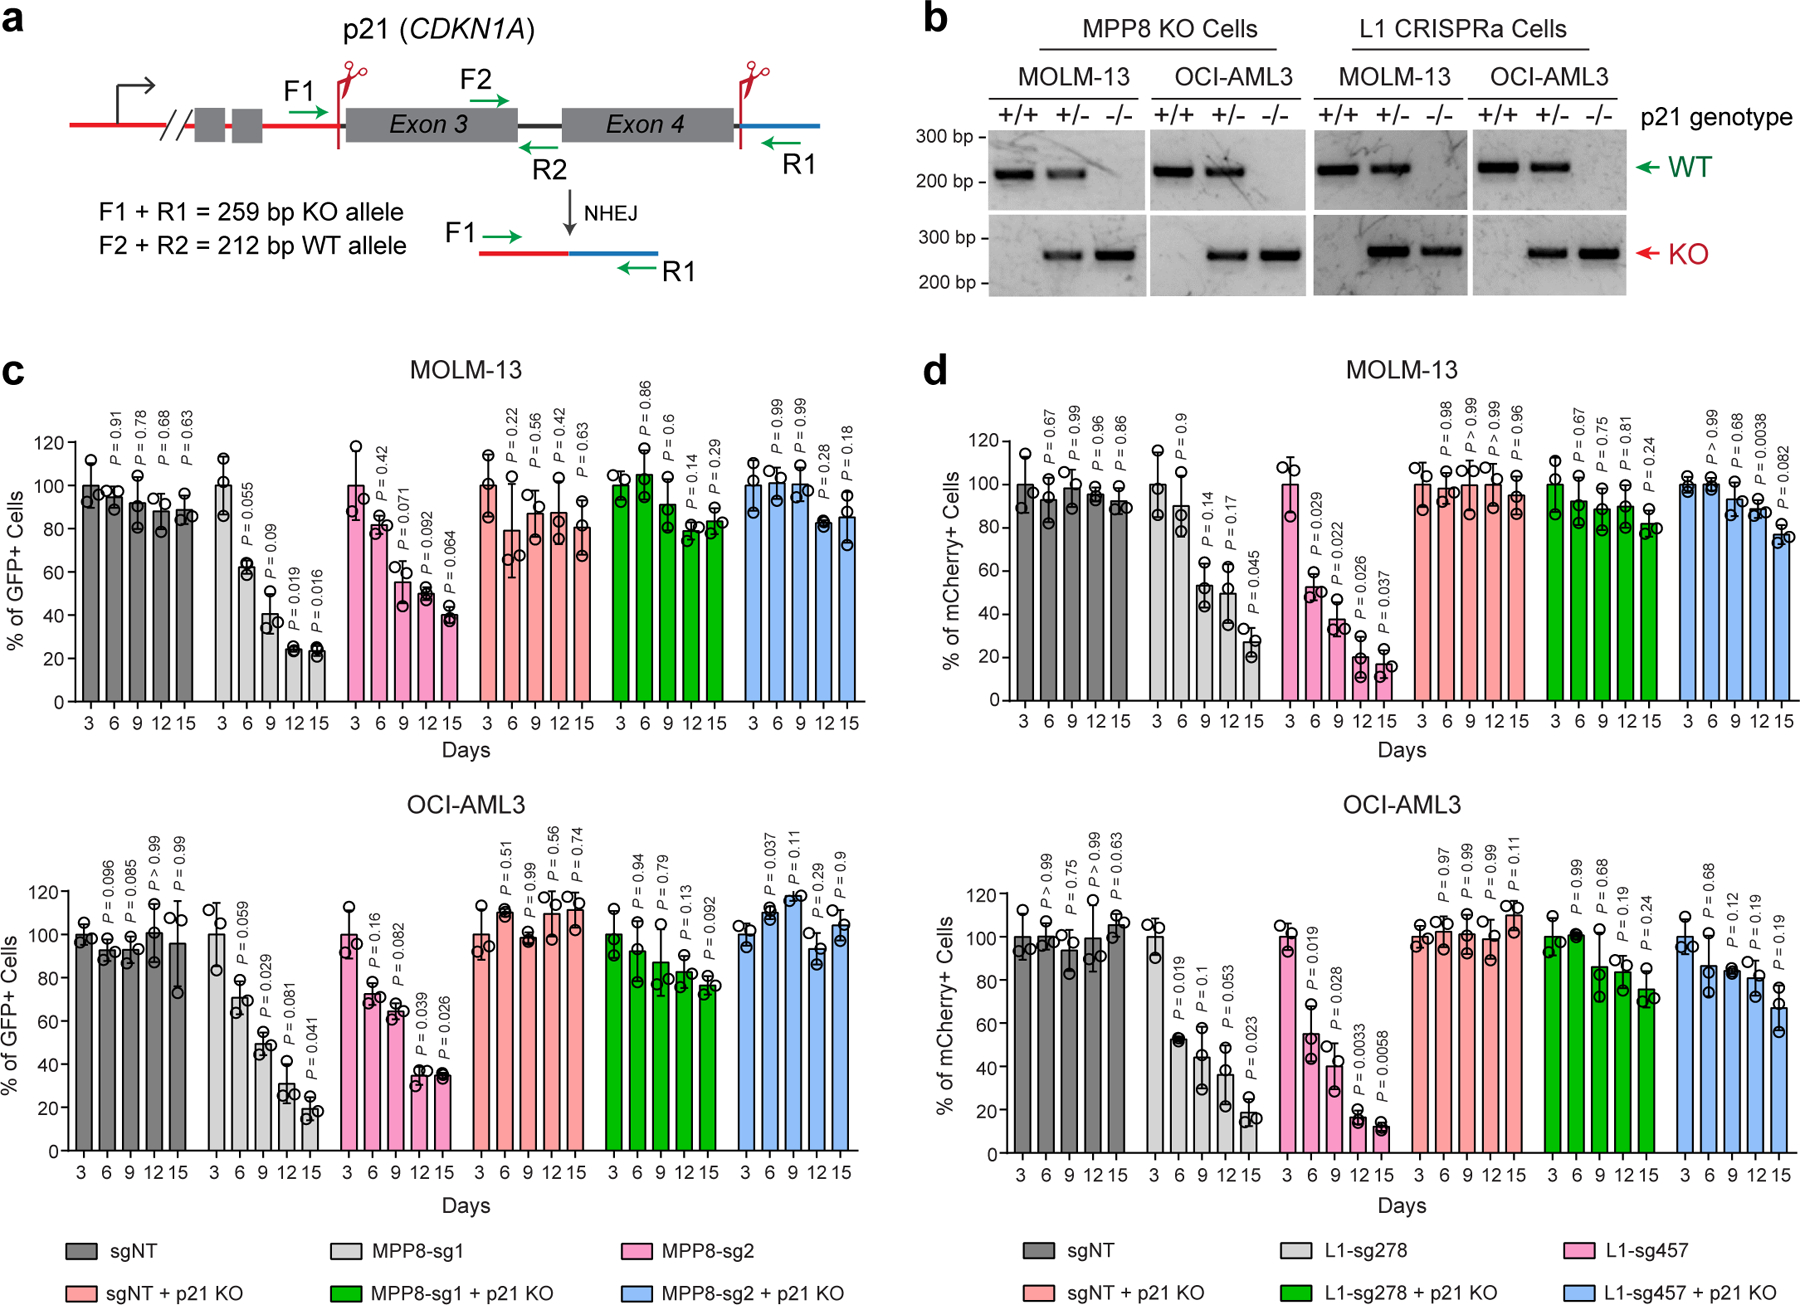
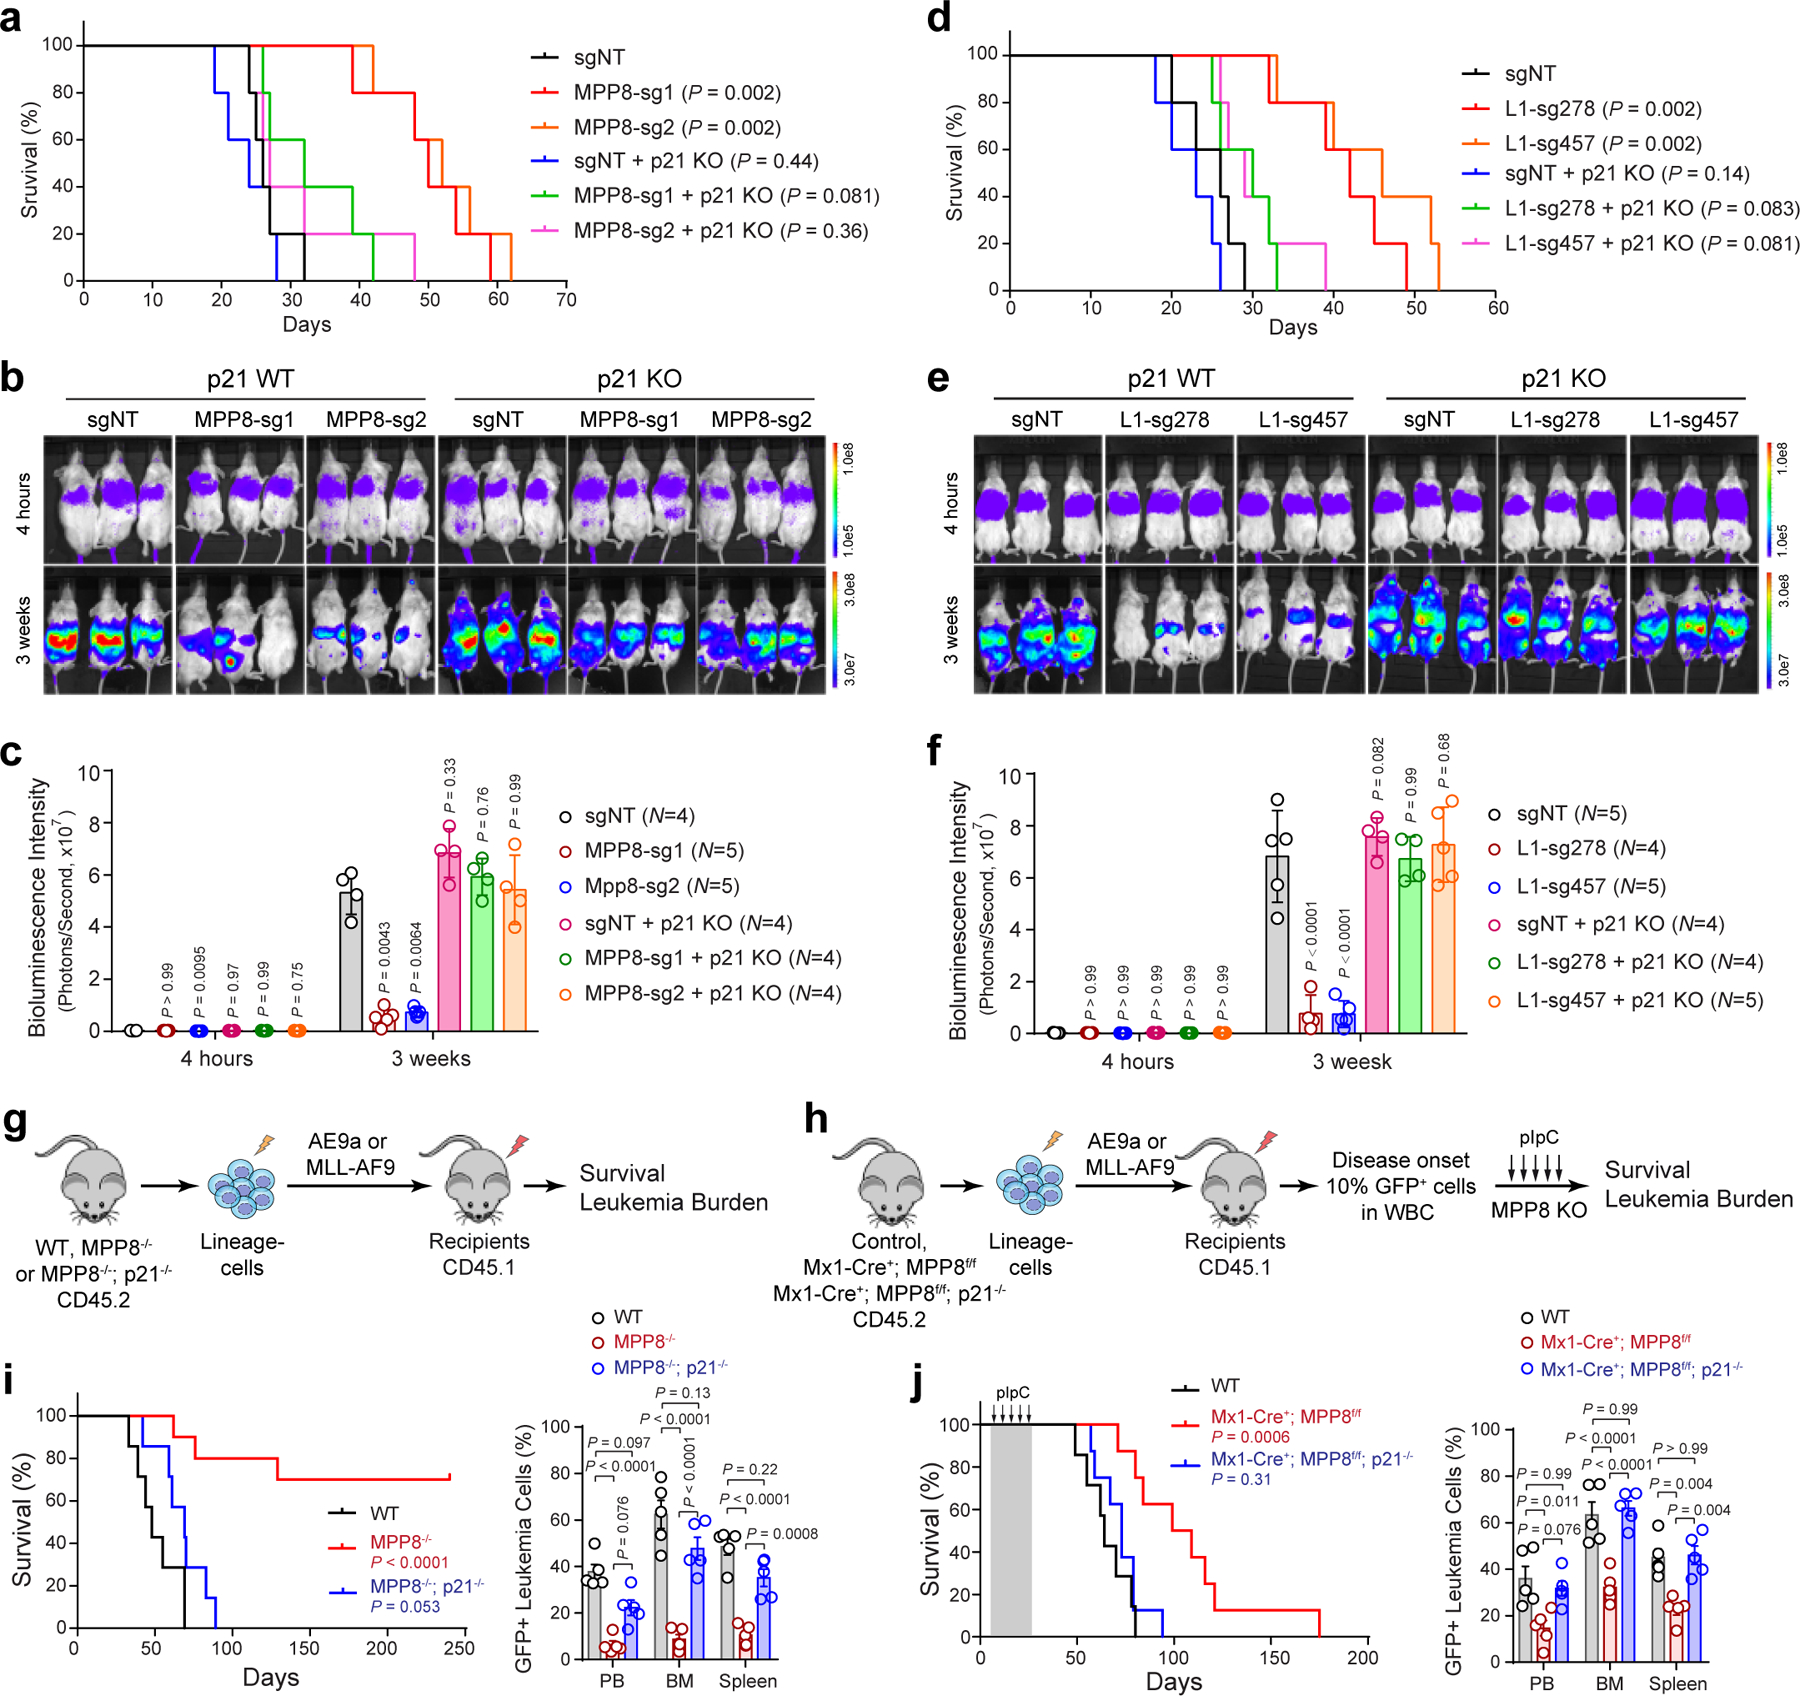
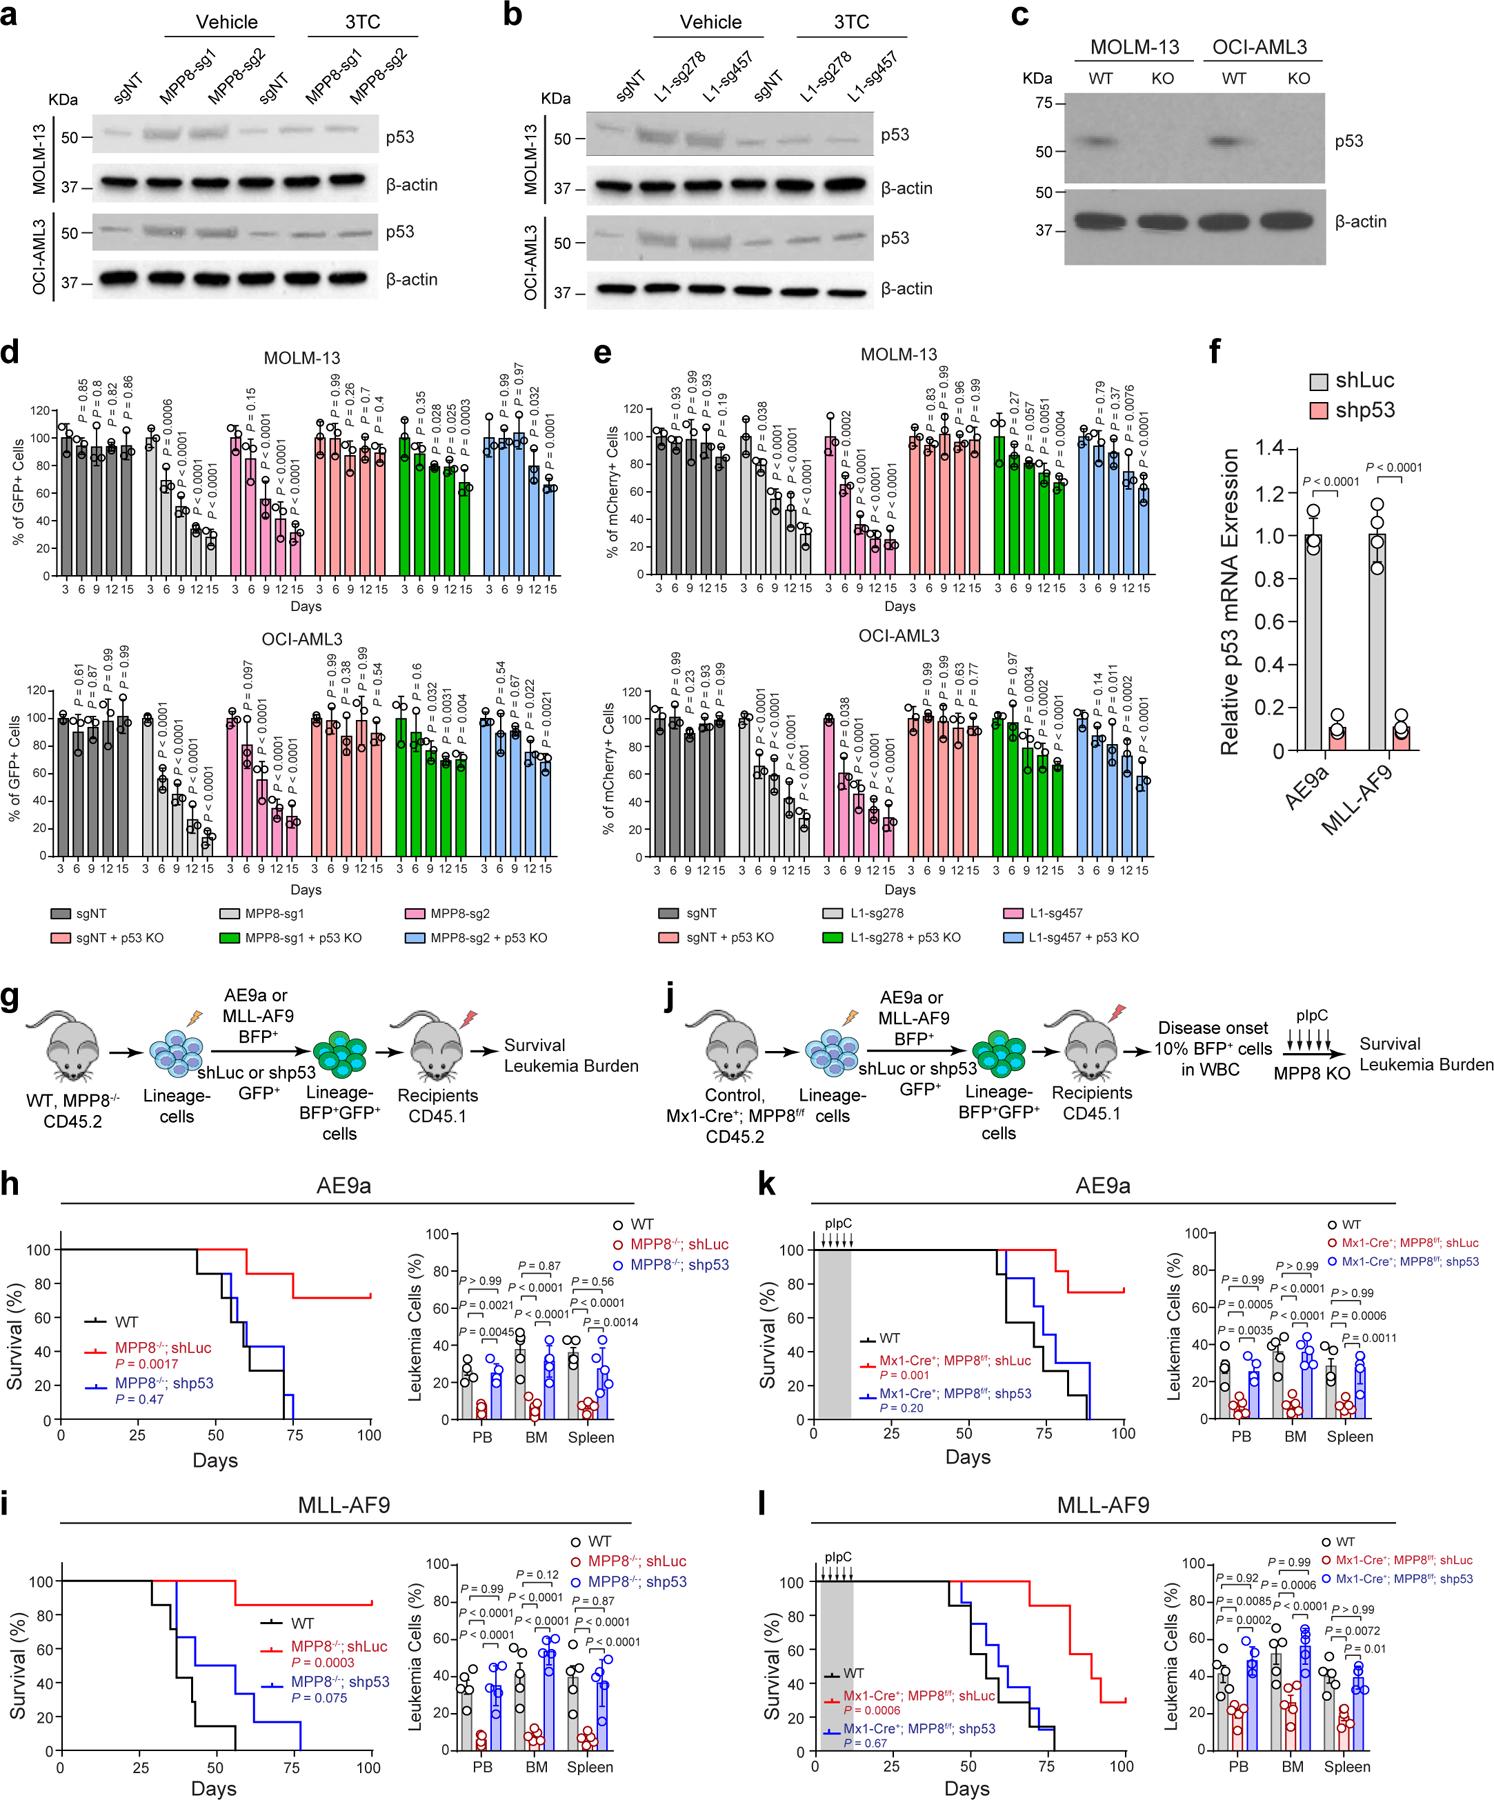
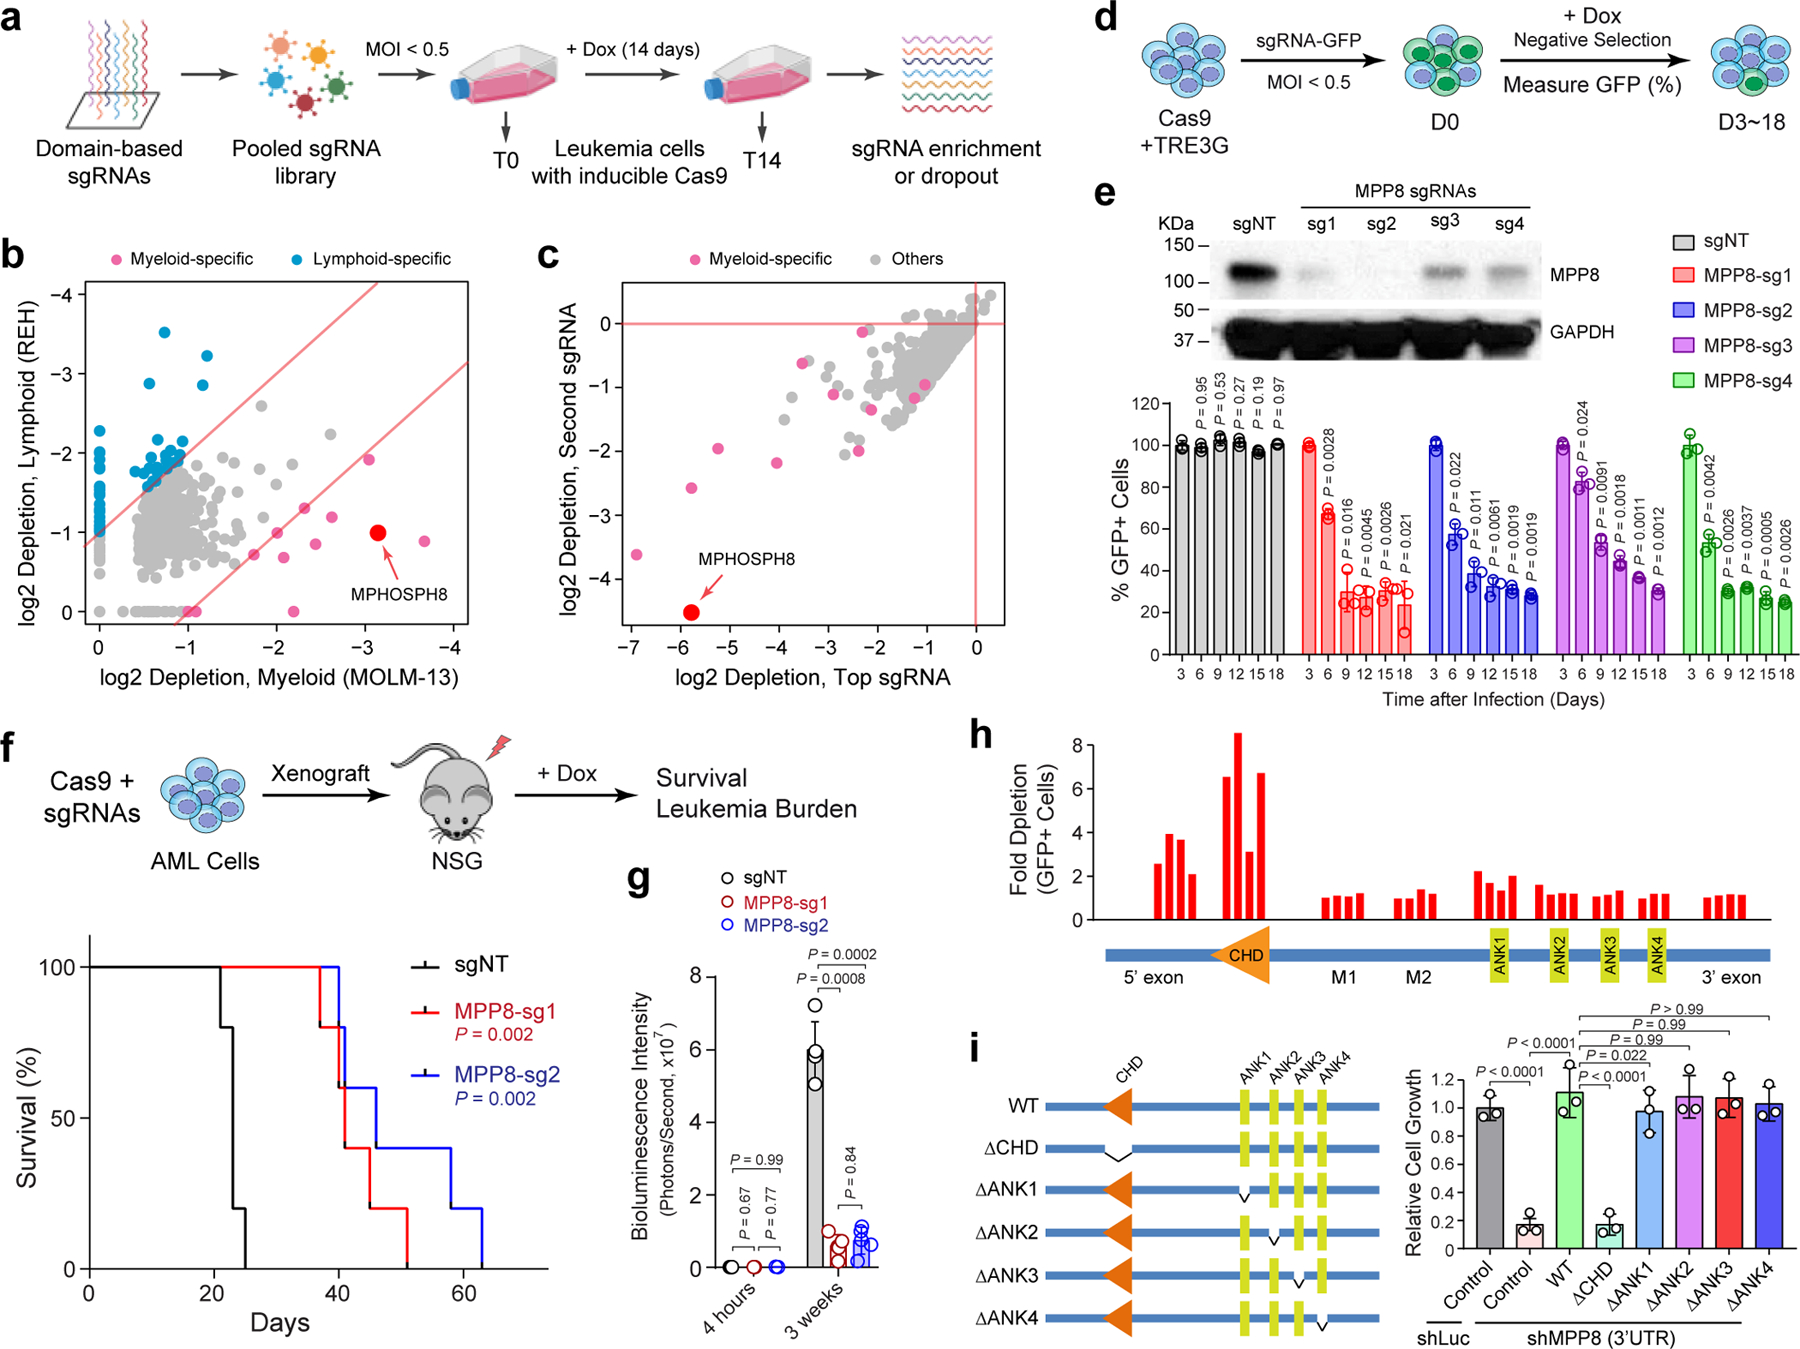
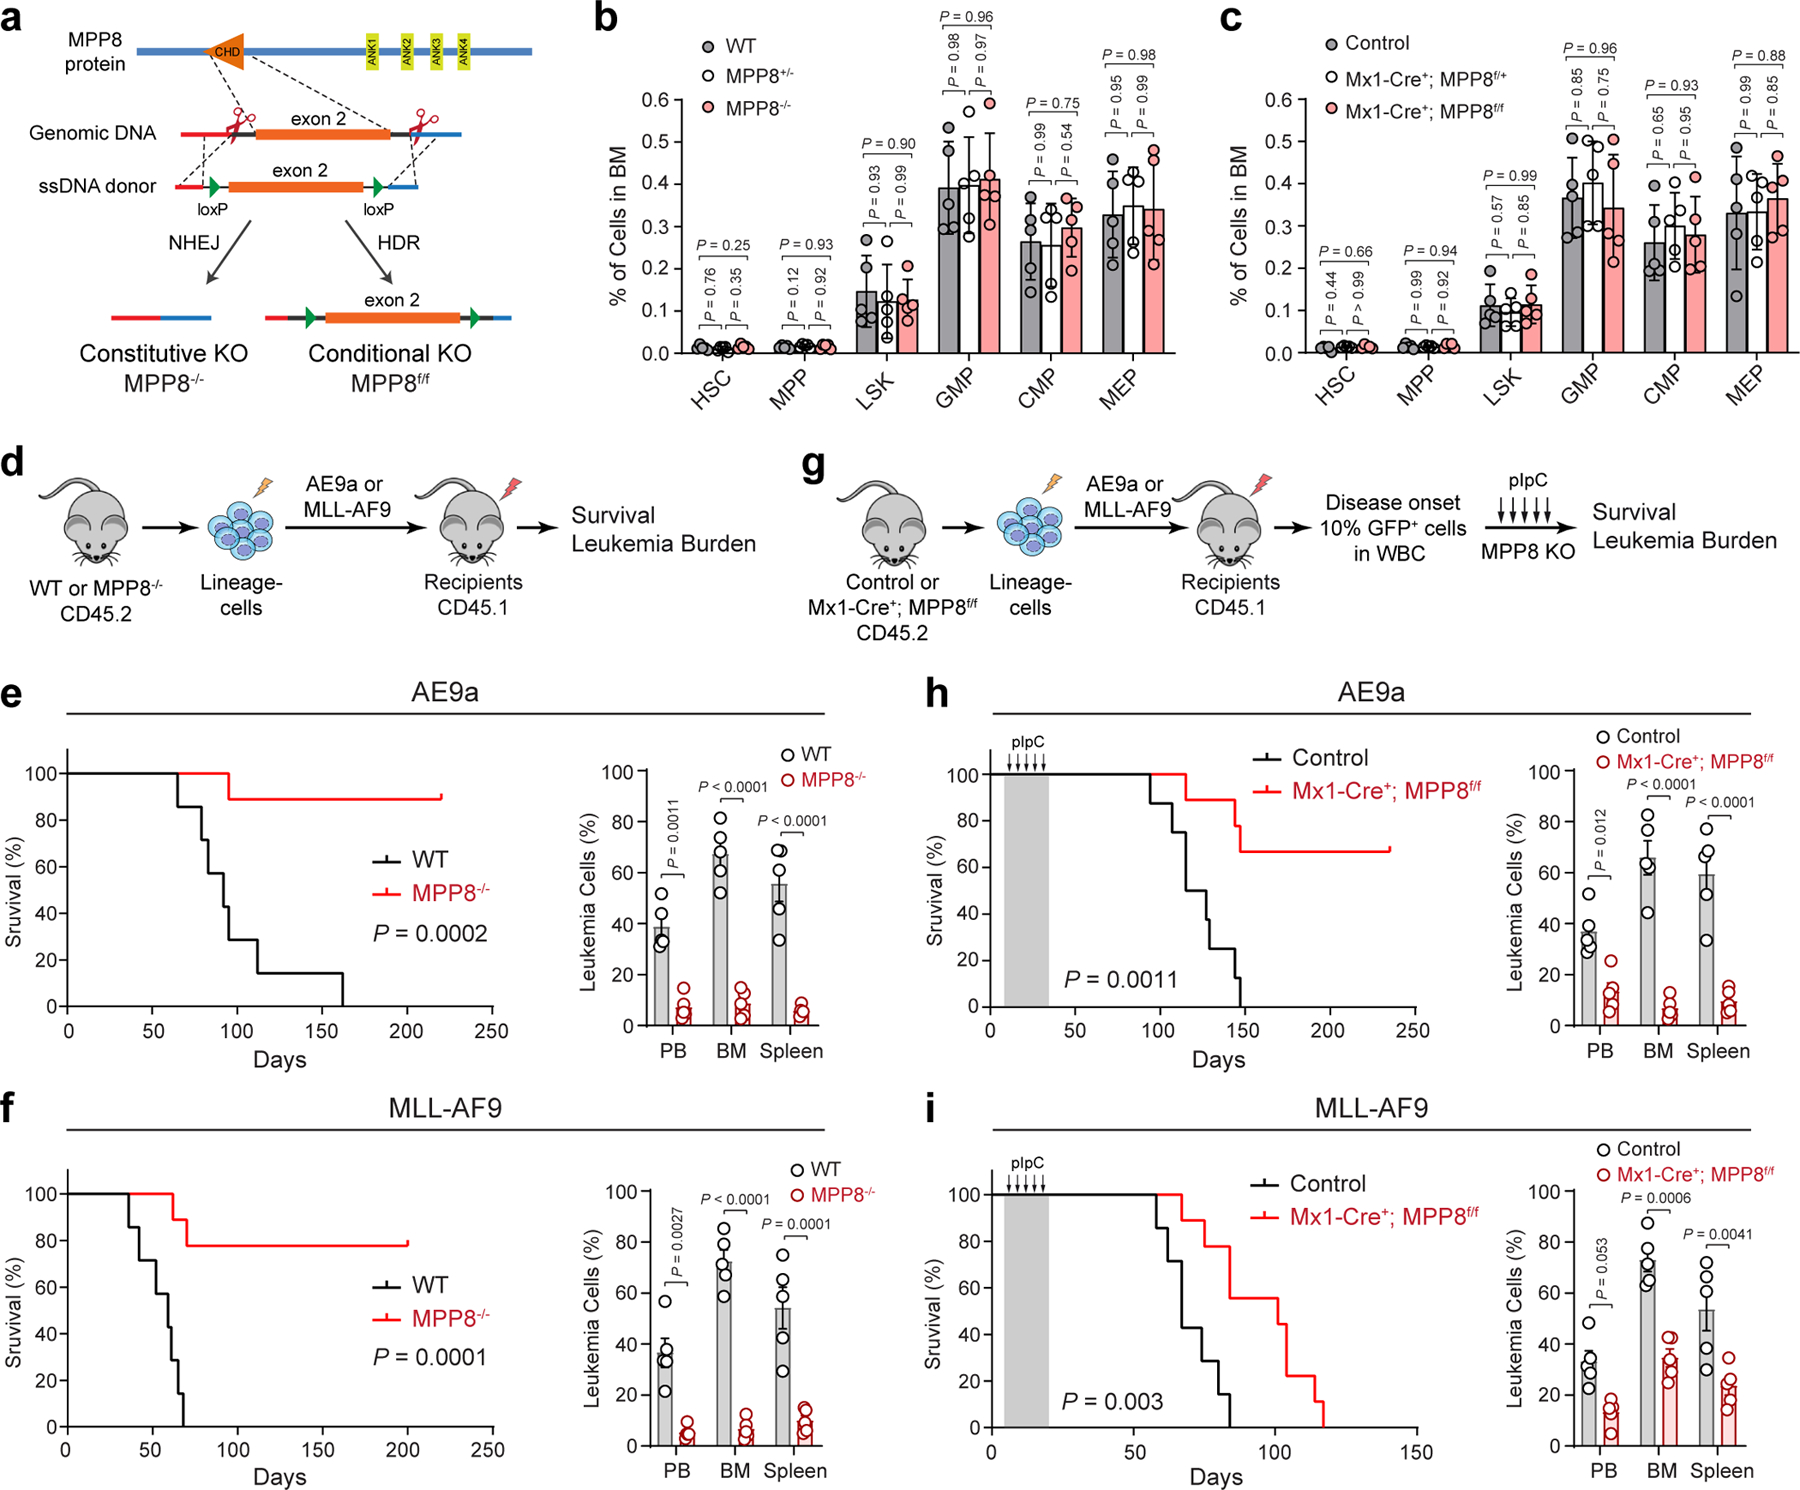
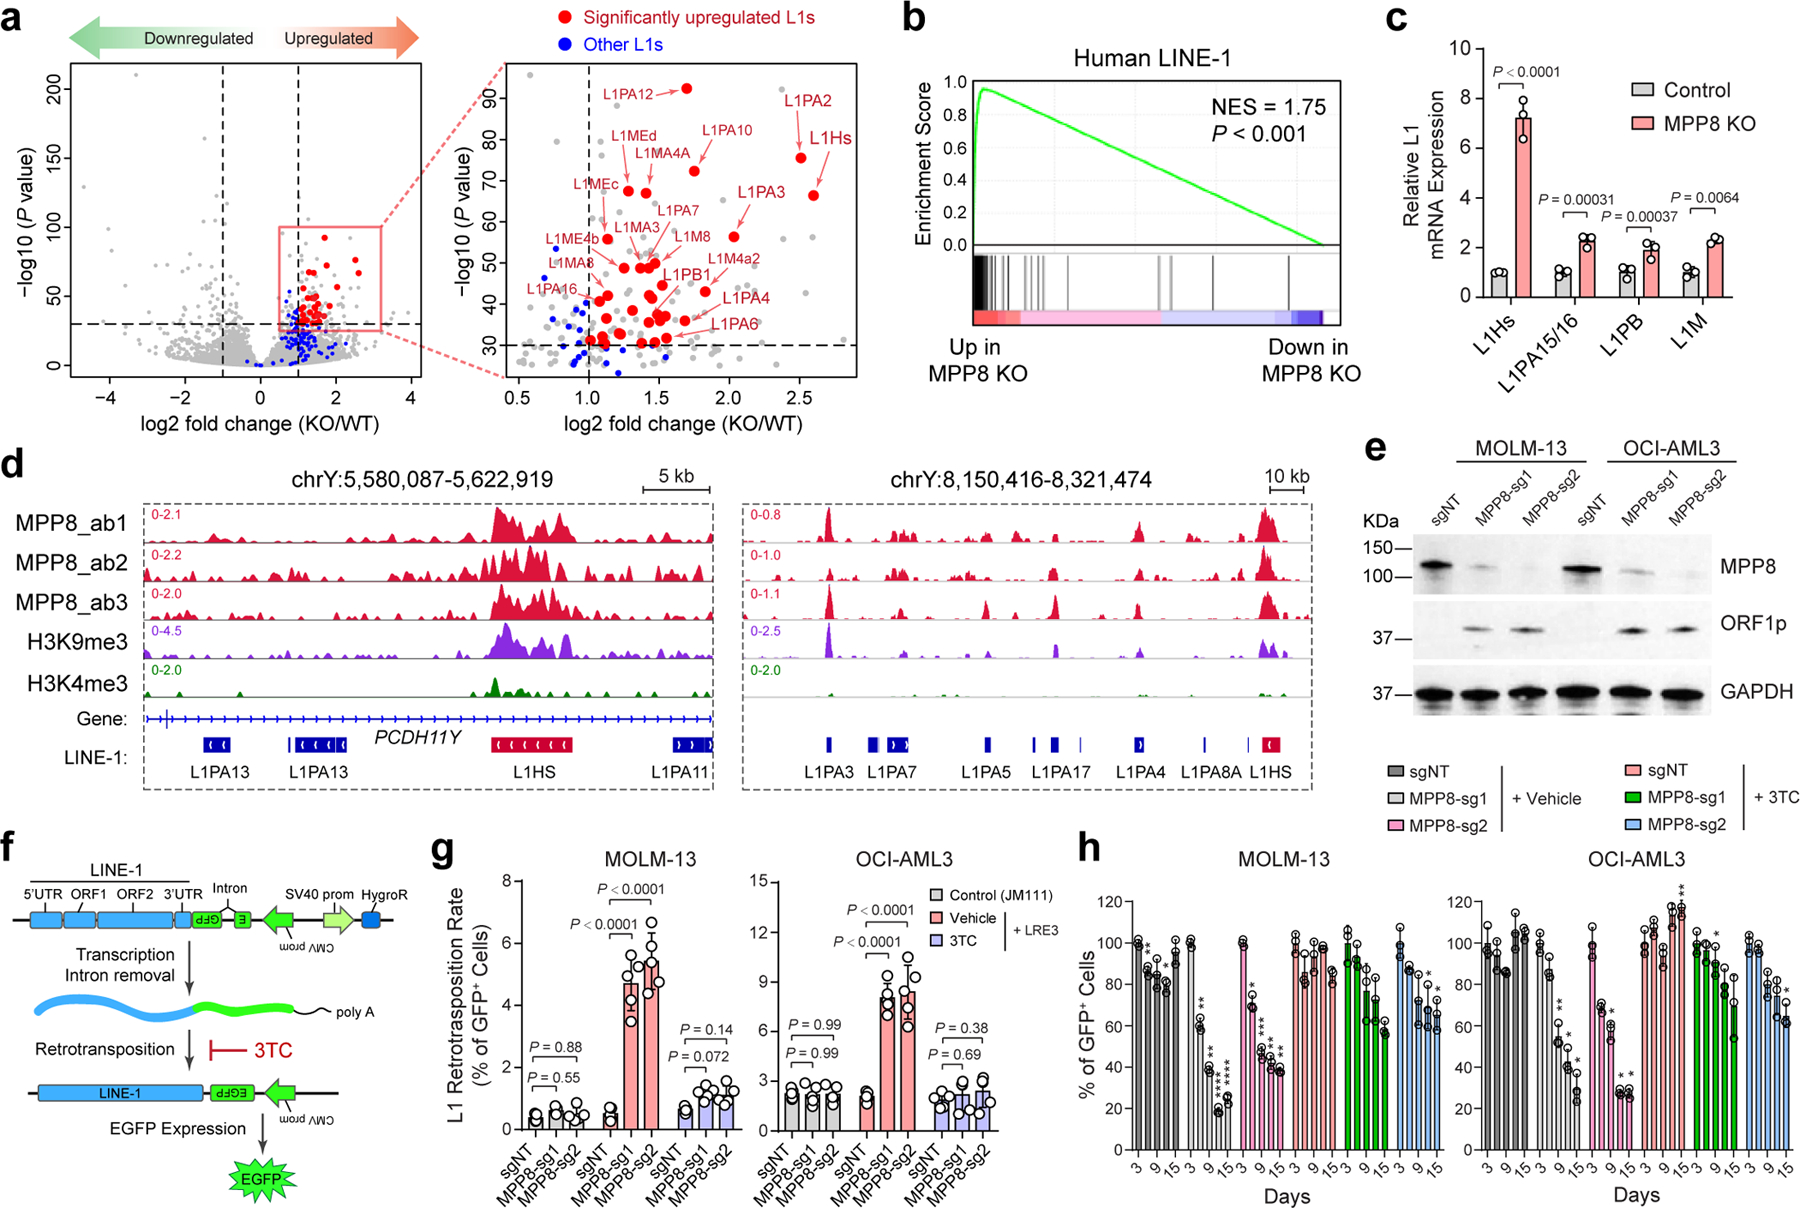
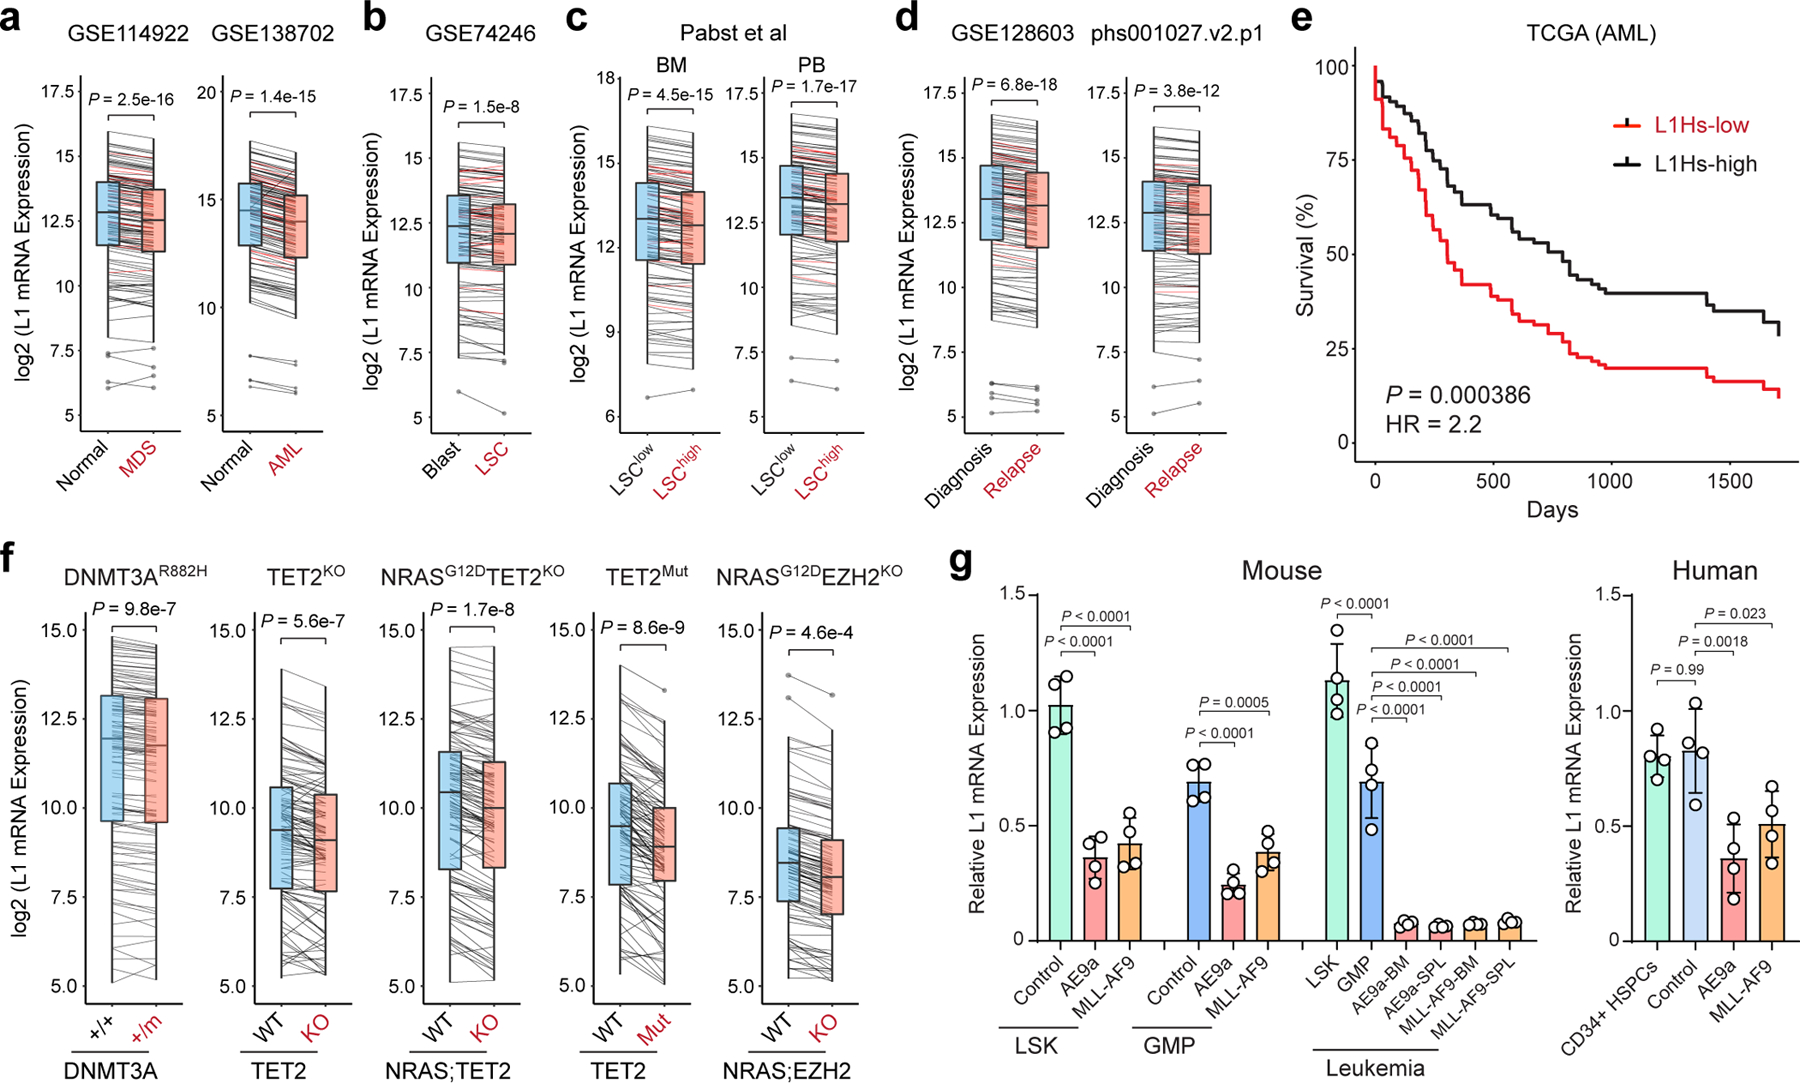
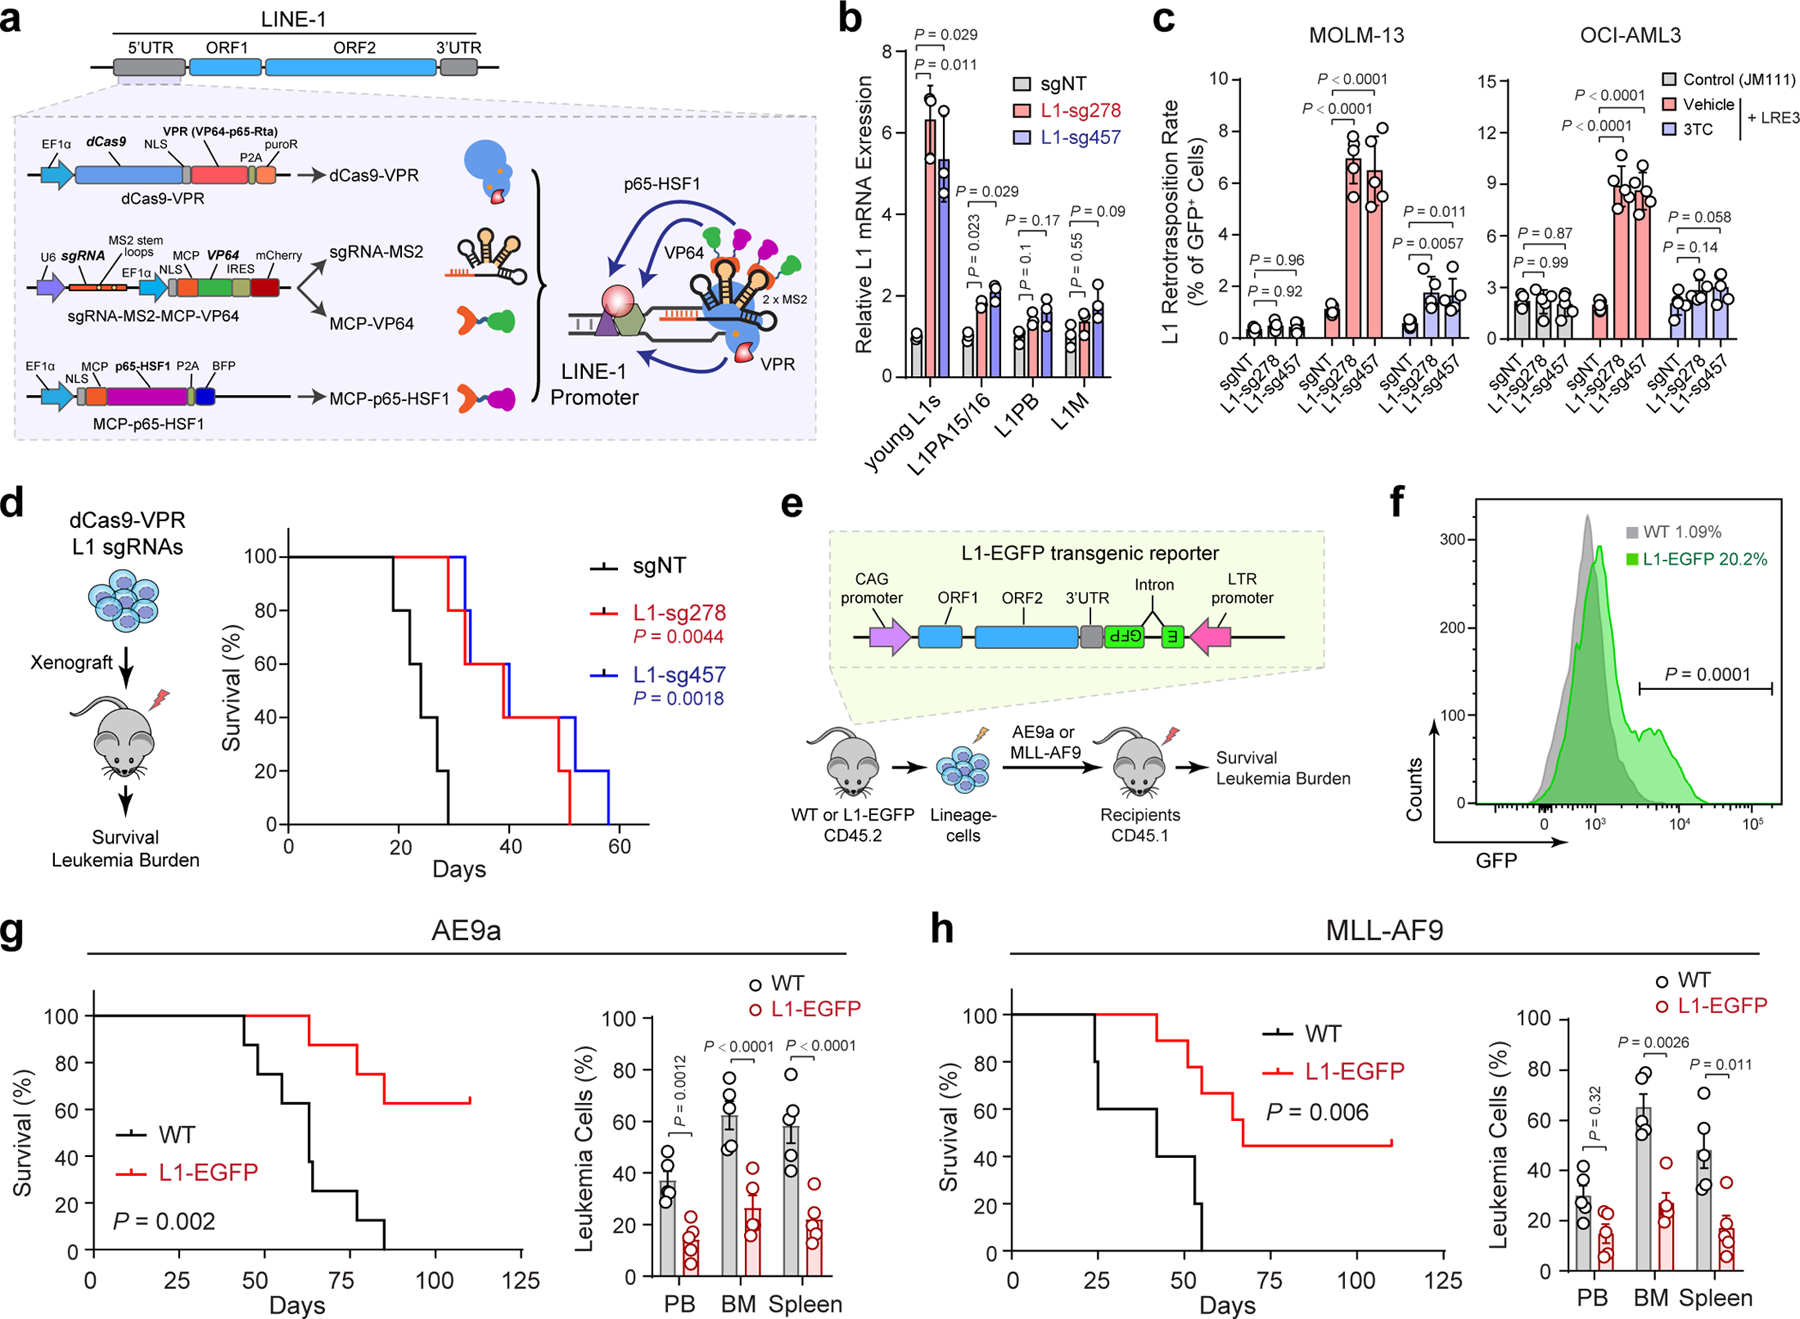
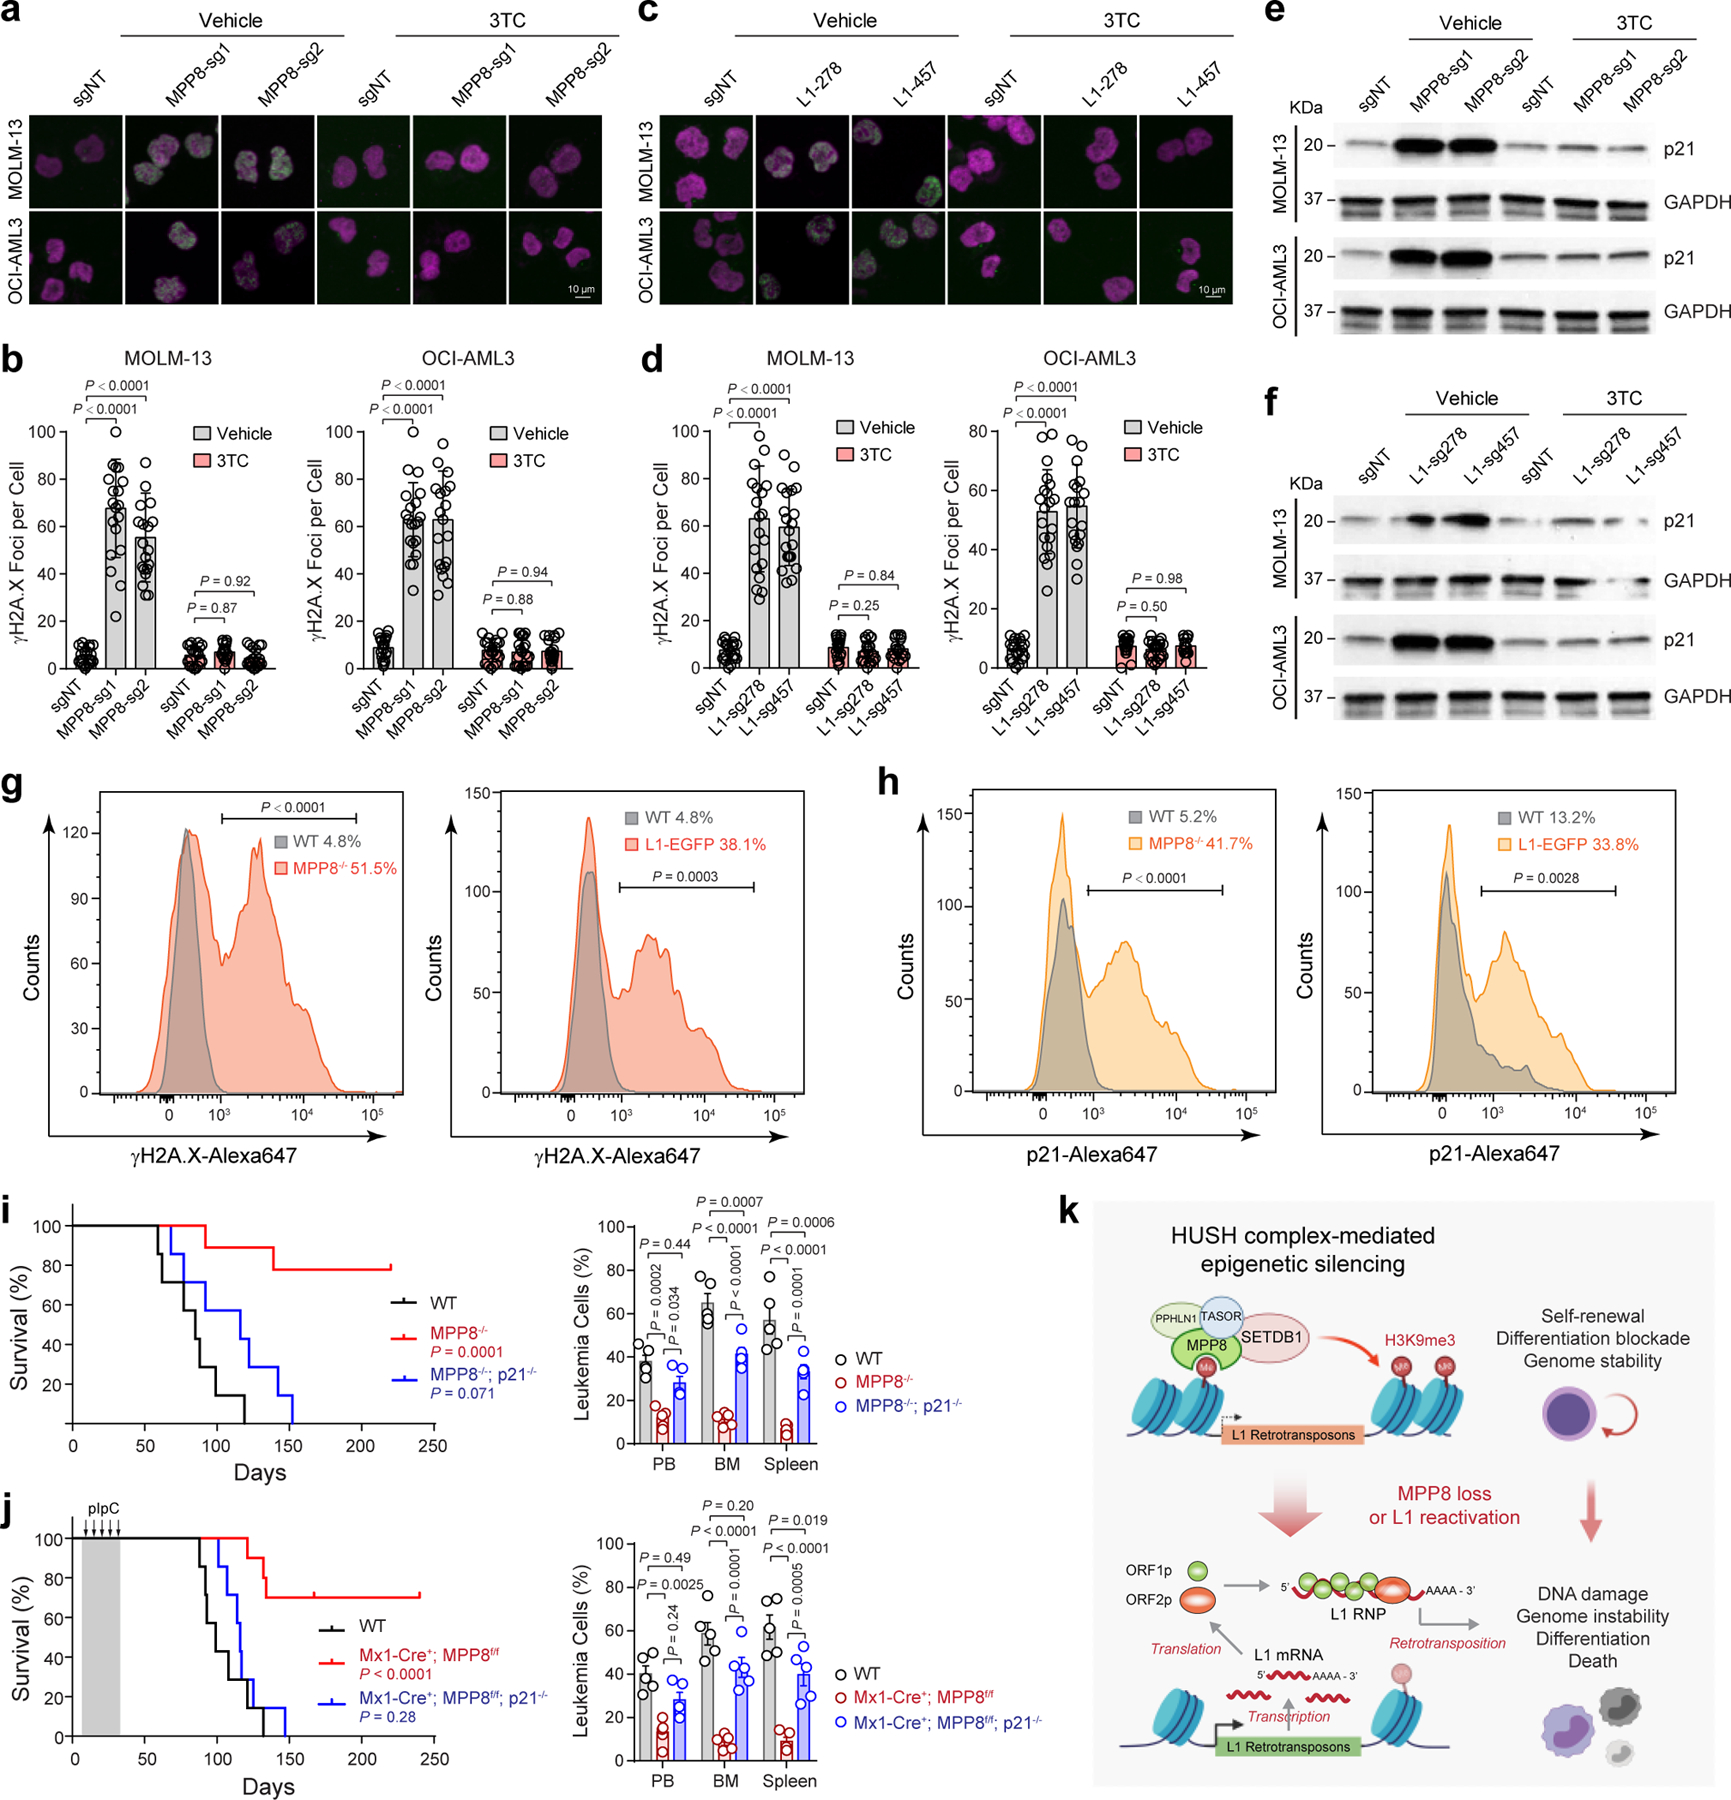
Transposable elements or transposons are major players in genetic variability and genome evolution. Aberrant activation of long interspersed element-1 (LINE-1 or L1) retrotransposons is common in human cancers, yet their tumor-type-specific functions are poorly characterized. We identified MPHOSPH8/MPP8, a component of the human silencing hub (HUSH) complex, as an acute myeloid leukemia (AML)-selective dependency by epigenetic regulator-focused CRISPR screening. Although MPP8 is dispensable for steady-state hematopoiesis, MPP8 loss inhibits AML development by reactivating L1s to induce the DNA damage response and cell cycle exit. Activation of endogenous or ectopic L1s mimics the phenotype of MPP8 loss, whereas blocking retrotransposition abrogates MPP8-deficiency-induced phenotypes. Expression of AML oncogenic mutations promotes L1 suppression, and enhanced L1 silencing is associated with poor prognosis in human AML. Hence, while retrotransposons are commonly recognized for their cancer-promoting functions, we describe a tumor-suppressive role for L1 retrotransposons in myeloid leukemia.


Conflict of interest statement

Competing Interests Statement

The authors declare no competing interests

Figures

Extended Data Figure 1 |
Extended Data Figure 1 |. Design and validation of epigenetic regulator-focused CRISPR screens.
a, Schematic of the CRISPR screen system containing a TET-on-3G trans-activator, a tetracycline (TRE3G)-inducible Cas9 with an mCherry reporter, and the sgRNA. b, Schematic of the experiments to validate the inducible CRISPR screen system by targeting the stably expressed GFP reporter gene in MOLM-13 cells. c, Dox-induced expression of Cas9 and GFP-targeting sgRNAs in mCherry+ cells significantly decreased GFP expression compared to Cas9-negative (mCherry) cells after 4 days of doxycycline treatment. d, Schematic of the customized sgRNA library containing 3,248 sgRNAs targeting 498 conserved chromatin-interacting domains in 266 annotated human epigenetic regulators and 1,800 sgRNAs targeting the 5’ exon of the other epigenetic regulators, together with 239 positive and 390 negative control sgRNAs. e, Comparisons of replicate experiments of CRISPR screens in MOLM-13 cells. The x- and y-axis of each graph represent the normalized sgRNA counts at day0 and day14. Spearman correlation value is shown for each comparison. f, MPP8 expression was determined by Western blot in MOLM-13 cells before xenograft (control), one week after Dox-induced MPP8 KO in xenografted NSG mice, and in the moribund mice (6-week post-xenograft) by independent MPP8-targeting sgRNAs (sg1 and sg2). g, Depletion of MPP8 by RNAi-mediated knockdown using shRNAs against the coding or 3’UTR sequences. shRNA against the luciferase gene (shLuc) was used as a negative control. Schematic of the MPP8 gene and the positions of shRNAs (sh1 to sh4) are shown. Results are mean ± SD (N = 3 independent experiments) and analyzed by a one-way ANOVA with Dunnett’s test. h, Growth curves of MOLM-13 AML cells after doxycycline-induced expression of MPP8-targeting shRNAs. Results are mean ± SD (N = 3 independent experiments) and analyzed by a two-way ANOVA with Tukey’s test.
Extended Data Figure 2 |
Extended Data Figure 2 |. HUSH components and other L1 regulators are required for myeloid leukemia cells.
a, Schematic of the HUSH complex in epigenetic silencing of retrotransposons. b, Depletion of HUSH proteins (PPHLN1 and TASOR) impaired MOLM-13 cell growth by the negative-selection competition assays. Results are mean ± SD (N = 3 independent experiments) and analyzed by a two-way ANOVA with Dunnett’s test. c, Depletion of other L1 regulators (MORC2, ATPIP7 and SETDB1) impaired MOLM-13 cell growth. Results are mean ± SD (N = 3 independent experiments) and analyzed by a two-way ANOVA with Dunnett’s test. d, Schematic of the xenotransplantation assay. e, Depletion of HUSH proteins (TASOR or PPHLN1) impaired MOLM-13 cell growth in NSG mice. Bioluminescence intensity is shown at 4 hours and 3 weeks post-transplantation. f, Quantification of bioluminescent imaging. Results are mean ± SD (N = 5 mice per group) and analyzed by a two-way ANOVA with Dunnett’s test. g, Representative image is shown for spleens of the xenografted NSG mice 3 weeks post-transplantation. h, Quantification of spleen weight 3 weeks post-transplantation. Results are mean ± SD (N = 3 mice per genotype) and analyzed by a one-way ANOVA with Dunnett’s test. i, Quantification of leukemia burden in PB, BM, spleen and liver of the xenografted NSG mice 3 weeks post-transplantation. Results are mean ± SD (N = 3 mice per group) and analyzed by a two-way ANOVA with Dunnett’s test. j, Kaplan-Meier survival curves of NSG mice xenografted with MOLM-13 cells transduced with control (sgNT) or sgRNAs against TASOR or PPHLN1. N = 5 mice per group. P values by a log-rank Mantel-Cox test.
Extended Data Figure 3 |
Extended Data Figure 3 |. Cellular phenotypes of MPP8-deficient myeloid leukemia cells.
a, Validation of shRNA-mediated MPP8 depletion by qRT-PCR in human normal CD34+ HSPCs (control) and four independent primary AML samples (AML1 to AML4). Cells transduced with shLuc were analyzed as controls. Results are mean ± SD (N = 4 independent experiments) and analyzed by a two-way ANOVA with Tukey’s test. b, MPP8 depletion impaired the colony-forming activity of AML cells but not normal CD34+ HSPCs in serial plating assays. Results are mean ± SD (N = 5 experiments) and analyzed by a two-way ANOVA with Tukey’s test. c, MPP8 depletion significantly increased CD11b expression in MOLM-13 and OCI-AML3 cells. Cells were analyzed after 10 days of Dox-induced MPP8 KO. Results are mean ± SD (N = 3 experiments) and analyzed by a two-way ANOVA with Dunnett’s test. d, MPP8 depletion increased apoptosis (Annexin V+) in MOLM-13 and OCI-AML3 cells after 10 days of Dox-induced MPP8 KO. Results are mean ± SD (N = 3 experiments) and analyzed by a two-way ANOVA with Dunnett’s test. e, MPP8 depletion led to a G0/G1 cell cycle arrest after 10 days of Dox-induced MPP8 KO. Results are mean ± SD (N = 3 experiments) and analyzed by a two-way ANOVA with Dunnett’s test. f, Expression of myeloid differentiation genes were upregulated in MPP8-deficient MOLM-13 cells after 10 days of Dox-induced MPP8 KO. Results are mean ± SD (N = 4 experiments) and analyzed by a one-way ANOVA with Dunnett’s test.
Extended Data Figure 4 |
Extended Data Figure 4 |. Generation of MPP8 constitutive and conditional KO mouse models.
a, Schematic of the design and genotyping strategies of the MPP8 constitutive and conditional KO mouse models. The locations and sizes of the genotyping primers and PCR products are shown, respectively. b, Representative genotyping results are shown for the MPP8 constitutive heterozygous and homozygous KO mice. c, Representative genotyping results are shown for the MPP8 conditional heterozygous and homozygous KO mice (by Mx1-Cre) 2 weeks after pIpC-induced MPP8 deletion. Genomic DNA from lineage-negative bone marrow cells were analyzed. d, Validation of MPP8 KO by Western blot analysis of bone marrow and spleen cells in MPP8 WT and homozygous constitutive KO mice. The non-specific signal (*) was also observed by the MPP8 antibody. e, Validation of pIpC-induced MPP8 KO by Western blot of bone marrow and spleen cells in MPP8 conditional WT and homozygous KO mice (by Mx1-Cre) 2 weeks after pIpC-induced MPP8 deletion. f, Birth ratios are shown for MPP8 WT, heterozygous and homozygous constitutive KO mice from the breeding of MPP8 heterozygous KO mice. g, Representative images are shown for male and female mice with the indicated genotypes at 6-weeks old. h, Growth curves (body weight) of male or female mice of the indicated genotypes up to 20 weeks. Results are mean ± SD (N = 8 independent male or female mice per genotype) and analyzed by a two-way ANOVA with Dunnett’s test.
Extended Data Figure 5 |
Extended Data Figure 5 |. MPP8 loss has no detectable effect on steady-state hematopoiesis.
a, Complete blood counts (CBC) of PB red blood cells (RBC), hemoglobin (Hgb), white blood cells (WBC) and platelets in mice at 10-weeks old. N = 5 mice. b, Frequencies of BM erythroid (Ter119+), B-lymphoid (B220+), T-lymphoid (CD3+) and myeloid (Mac1+Gr1+) cells in mice at 8-weeks old. N = 5 mice. c, Cellularity and frequencies of spleen cell populations at 10-weeks old. N = 5 mice. d, Frequencies of donor-derived CD45.2+, myeloid (Mac1+), B (B220+) and T (CD3+) cells at 4 to 24 weeks after BMT. N = 5 mice. e, Schematic of experimental approach. f, CBC of PB RBC, Hgb, WBC and platelets. N = 5 mice. g, Cellularity and frequencies of BM cell populations. N = 5 mice. h, Cellularity and frequencies of spleen cell populations. N = 5 mice. i, Homing of AE9a or MLL-AF9-transformed cells in recipient BM. Results are shown for the % of GFP+ leukemia cells 16 hours after tail vein injection. N = 5 mice. j, MPP8 KO by Mx1-Cre had no effect on leukemia engraftment before pIpC administration in PB 4 weeks after tail vein injection. N = 8 control and 9 Mx1-Cre+;MPP8f/f mice (for AE9a), or N = 7 control and 9 Mx1-Cre+;MPP8f/f (for MLL-AF9). k, Expression of known AE9a and MLL-AF9 gene targets in AE9a or MLL-AF9-transformed BM cells, respectively. N = 4 experiments. l, Expression of MPP8 protein in MLL-AF9-transformed cells 2 to 8 weeks after pIpC-induced MPP8 deletion in recipients or the moribund mouse (12 weeks post-pIpC). Cells before transplantation were analyzed as the control. For a, b, c, f, g, h, results are mean ± SD and analyzed by a one-way ANOVA with Tukey’s test. For d, i, j, k, l, results are mean ± SD and analyzed by a two-way ANOVA with Bonferroni’s test.
Extended Data Figure 6 |
Extended Data Figure 6 |. Expression and regulation of L1 retrotransposons in myeloid leukemia.
a, Expression of young L1s was significantly upregulated upon depletion of other HUSH components or SETDB1. Results are mean ± SD (N = 4 experiments) and analyzed by a one-way ANOVA with Dunnett’s test. b, Heatmap depicting the genome-wide co-localization between MPP8 and H3K9me3, but not H3K4me3, ChIP-seq signals in MOLM-13 cells. MPP8 occupied genome regions (N = 6,292 peaks) were ranked according to the normalized MPP8 ChIP-seq intensities, and the regions upstream (−5kb) and downstream (+5kb) of the ChIP-seq peak summit are shown. Independent ChIP-seq experiments were merged for the heatmap illustration. c, Browser view of representative loci showing enrichment of MPP8 and H3K9me3 ChIP-seq signals at L1s. d, Validation of MPP8 chromatin occupancy at L1Hs in MOLM-13 cells and four independent primary AML samples (AML1 to AML4). Primers for the β-actin locus was analyzed as the negative control. Results are mean ± SD (N = 4 experiments) and analyzed by a two-way ANOVA with Bonferroni’s test. e, Depletion of MPP8 reactivated L1s in MOLM-13 cells, human normal CD34+ HSPCs and primary AML samples. Fold changes of L1 expression were calculated in MPP8-depleted versus shLuc-transduced cells. Results are mean ± SD (N = 4 experiments) and analyzed by a two-way ANOVA with Dunnett’s test. f, MPP8 KO in AML cells increased L1 retrotransposition, which were inhibited by 10 µM of 3TC. Representative flow cytometry graphs are shown for control (sgNT) or MPP8 KO (MPP8-sg1 and MPP8-sg2) cells harboring the LRE3-EGFP retrotransposition reporter or the retrotransposition-deficient JM111 control, respectively. g, Lower L1Hs expression is associated with poor survival in AML patients. Univariate and multivariate Cox regression analyses were performed using the AML samples from the TCGA cohort (N = 134 samples). L1Hs-high (top 50%) and L1Hs-low (bottom 50%) samples were compared. P values by the two-sided Wald test.
Extended Data Figure 7 |
Extended Data Figure 7 |. Reactivation of L1 retrotransposition impairs myeloid leukemia.
a, Schematic of 10 sgRNAs against the 5’UTR promoter sequences of the full-length L1Hs. b, CRISPRa-mediated activation of endogenous L1s in MOLM-13 cells using L1-promoter-targeting sgRNAs individually. Relative L1 expression was determined by qRT-PCR in non-transduced cells (control) and cells expressing non-targeting (sgNT) or L1-promoter-targeting sgRNAs (L1-sg1 to L1-sg10). Results are mean ± SD (N = 4 independent experiments) and analyzed by a one-way ANOVA with Dunnett’s test. c, CRISPRa of endogenous L1s in MOLM-13 cells using combinations of multiple L1-promoter-targeting sgRNAs. Results are mean ± SD (N = 4 independent experiments) and analyzed by a one-way ANOVA with Dunnett’s test. d, CRISPRa-mediated activation of endogenous L1s increased the expression of L1-encoded ORF1p in MOLM-13 and OCI-AML3 cells by Western blot. GAPDH was analyzed as a loading control. e, CRISPRa of endogenous L1s increased L1 retrotransposition in MOLM-13 and OCI-AML3 cells. Representative flow cytometry graphs are shown for control (sgNT) or L1 activated (L1-sg278 and L1-sg457) cells harboring the LRE3-EGFP or JM111 control, respectively. f, Activation of L1 retrotransposition impaired MOLM-13 cell growth by the negative-selection competition assay. Treatment with 3TC (10 µM) abrogated L1 retrotransposition-induced cell growth defects. Results are mean ± SD (N = 3 independent experiments) and analyzed by a two-way ANOVA with Dunnett’s test. g, Activation of L1 retrotransposition impaired OCI-AML3 cell growth, whereas 3TC treatment (10 µM) abrogated L1 retrotransposition-induced defects. Results are mean ± SD (N = 3 independent experiments) and analyzed by a two-way ANOVA with Dunnett’s test. h, 3TC treatment had no significant effect on AML cell viability as determined by treating MOLM-13 and OCI-AML3 cells with escalating doses (0 to 640 µM) of 3TC for 5 days. Results are mean ± SD (N = 3 independent experiments) and analyzed by a one-way ANOVA with Dunnett’s test.
Extended Data Figure 8 |
Extended Data Figure 8 |. p21 KO abrogates MPP8 KO or L1 reactivation-induced phenotypes in AML cells in vitro.
a, Schematic of CRISPR-mediated KO of p21 (CDKN1A) gene in human leukemia cells. The positions of sgRNAs and genotyping primers (F1, F2, R1 and R2) for WT or KO alleles are indicated. b, Representative genotyping results are shown for p21 KO in MOLM-13 and OCI-AML3 cells with MPP8 KO or CRISPRa (for L1 reactivation). c, p21 KO abrogated MPP8-deficiency-induced cell growth defects by the negative-selection competition assays in MOLM-13 and OCI-AML3 cells. Results are mean ± SD (N = 3 independent experiments) and analyzed by a two-way ANOVA with Dunnett’s test. d, p21 KO abrogated L1-reactivation-induced cell growth defects by the negative-selection competition assays in AML cells. Results are mean ± SD (N = 3 independent experiments) and analyzed by a two-way ANOVA with Dunnett’s test.
Extended Data Figure 9 |
Extended Data Figure 9 |. p21 KO abrogates MPP8 KO or L1 reactivation-induced phenotypes in AML cells in vivo.
a, Survival curves of NSG mice xenografted with WT or p21 KO MOLM-13 cells transduced with control (sgNT) or MPP8-targeting sgRNAs. P values by a log-rank Mantel-Cox test. b, KO of p21 abrogated MPP8-deficiency-induced cell growth defects of MOLM-13 cells in NSG mice. Bioluminescence intensity is shown at 4 hours and 3 weeks post-transplantation. c, Quantification of bioluminescent imaging. The numbers of independent mice are indicated. Results are mean ± SD and analyzed by mixed-effects analysis with Dunnett’s test. d, Survival curves of NSG mice xenografted with WT or p21 KO MOLM-13 cells transduced with control or L1-promoter-targeting sgRNAs for CRISPRa-mediated L1 reactivation. P values by a log-rank Mantel-Cox test. e, KO of p21 abrogated L1-reactivation-induced cell growth defects of MOLM-13 cells in xenografted NSG mice. f, Quantification of bioluminescent imaging. The numbers of independent mice are indicated. Results are mean ± SD and analyzed by mixed-effects analysis with Dunnett’s test. g, Schematic of the leukemia initiation experiments. h, Schematic of the leukemia maintenance experiments. i, Survival curves of recipient mice engrafted with WT (N = 7 mice), MPP8−/− (N = 10), or MPP8−/−p21−/− (N = 7) BM lineage-negative cells transduced with MLL-AF9. P values by a log-rank Mantel-Cox test. Quantification of leukemia burden by % of GFP+ leukemia cells at day 38 post-transplantation is shown. Results are mean ± SEM and analyzed by a two-way ANOVA with Tukey’s test. j, Survival curves of recipient mice engrafted with cells of the indicated genotypes transduced with MLL-AF9 for the leukemia maintenance experiments. N = 7, 8, and 8 WT, Mx1-Cre+;MPP8f/f, and Mx1-Cre+;MPP8f/f;p21−/− mice, respectively. P values by a log-rank Mantel-Cox test. Quantification of leukemia burden at day 60 post-transplantation is shown. Results are mean ± SEM and analyzed by a two-way ANOVA with Tukey’s test.
Extended Data Figure 10 |
Extended Data Figure 10 |. p53 is required for MPP8 KO or L1 reactivation-induced phenotypes in AML cells.
a, MPP8 loss increased p53 expression in AML cells. b, L1 reactivation increased p53 expression in AML cells. c, Validation of p53 KO by Western blot. d, p53 KO blunted MPP8-deficiency-induced cell growth defects. Results are mean ± SD (N = 3 experiments) and analyzed by a two-way ANOVA with Dunnett’s test. e, p53 KO blunted L1-reactivation-induced cell growth defects. Results are mean ± SD (N = 3 independent experiments) and analyzed by a two-way ANOVA with Dunnett’s test. f, Validation of p53 depletion in AE9a or MLL-AF9-transformed BM cells. Results are mean ± SD (N = 4 experiments) and analyzed by a two-way ANOVA with Bonferroni’s test. g, Schematic of the leukemia initiation experiments. h, Survival curves of recipients engrafted with AE9a-transformed WT or MPP8−/− cells with control (shLuc) or p53 depletion. N = 7 mice. P values by a log-rank Mantel-Cox test. Quantification of leukemia burden at day 50 post-transplantation (N = 5 mice) is shown. i, Survival curves of recipients engrafted with MLL-AF9-transformed WT or MPP8−/− cells with or without p53 depletion. N = 7, 7, and 6 mice for WT, MPP8−/−;shLuc, and MPP8−/−;shp53, respectively. Quantification of leukemia burden at day 37 (N = 5 mice) is shown. j, Schematic of the leukemia maintenance experiments. k, Survival curves of recipients engrafted with AE9a-transformed cells. N = 7, 8, and 6 mice for WT, Mx1-Cre+;MPP8f/f;shLuc, and Mx1-Cre+;MPP8f/f;shp53, respectively. Quantification of leukemia burden at day 62 (N = 5 mice) is shown. l, Survival curves of recipients engrafted with MLL-AF9-transformed cells. N = 7, 7, and 8 mice for WT, Mx1-Cre+;MPP8f/f;shLuc, and Mx1-Cre+;MPP8f/f;shp53, respectively. Quantification of leukemia burden at day 47 (N = 5 mice) is shown. For h, i, k and l, results are mean ± SD and analyzed by a two-way ANOVA with Tukey’s test.
Figure 1 |
Figure 1 |. CRISPR screens identify MPP8 as a vulnerability for myeloid leukemia.
a, Schematic of the domain-focused CRISPR dependency screen. b, Scatterplot depicting the dependency genes identified by CRISPR screens in AML (MOLM-13) and ALL (REH) cells. Red and blue dots indicate myeloid- and lymphoid-specific dependency genes, respectively. x- and y-axis indicate the log2 fold depletion of sgRNA abundance between day 0 and day 14, respectively. Results are based on mean values of all sgRNAs from two independent screens. c, Scatterplot depicting the myeloid-specific dependency genes (red dots) by the top and second dropout sgRNAs between day 0 and day 14 in MOLM-13 cells. d, Schematic of the negative-selection competition assay. e, MPP8 depletion by independent sgRNAs impaired MOLM-13 cell growth relative to the non-targeting control sgRNA (sgNT). Results are mean ± SD and analyzed by a two-way ANOVA with Dunnett’s multiple comparison test. MPP8 depletion was confirmed by Western blot. f, Kaplan-Meier survival curves of NSG mice xenografted with control (sgNT) or MPP8-deficient (MPP-sg1 and MPP8-sg2) MOLM-13 cells. P values by a log-rank Mantel-Cox test. g, Quantification of leukemia burden by bioluminescent imaging 4 hours (baseline) and 3 weeks post-xenograft. Results are mean ± SD (N = 5 mice per group) and analyzed by a two-way ANOVA with Tukey’s multiple comparison test. h, CRISPR-based mutagenesis of MPP8 domains by the negative-selection competition assay in MOLM-13 cells. i, Re-introduction of WT but not CHD-deleted MPP8 rescued the cell growth defects of MPP8-depleted MOLM-13 cells. Results are mean ± SD (N = 3 independent experiments) and analyzed by a two-way ANOVA with Tukey’s test.
Figure 2 |
Figure 2 |. MPP8 is dispensable for hematopoiesis but required for AML development in vivo.
a, Schematic of the MPP8 constitutive and conditional KO mouse models. b,c, Frequencies of hematopoietic stem and progenitor cell populations in bone marrow of MPP8 constitutive heterozygous (MPP8+/−) or homozygous (MPP8−/−) KO (b), or conditional heterozygous or homozygous KO by Mx1-Cre two weeks post-pIpC (c). Results are mean ± SD (N = 5 mice per genotype) and analyzed by a two-way ANOVA with Tukey’s test. d, Schematic of the leukemia initiation experiments. e,f, Kaplan-Meier survival curves of recipient mice engrafted with cells transduced with AE9a (e) or MLL-AF9 (f). N = 7 WT and 9 MPP8−/− mice. P values by a log-rank Mantel-Cox test. Quantification of leukemia burden by % of GFP+ leukemia cells in PB, BM and spleen at day 68 (AE9a) or day 41 (MLL-AF9) post-transplantation is shown, respectively. Results are mean ± SEM (N = 5 mice per group) and analyzed by a two-way ANOVA with Bonferroni’s multiple comparison test. g, Schematic of the leukemia maintenance experiments. h,i, Kaplan-Meier survival curves of recipient mice engrafted with cells transduced with AE9a (h) or MLL-AF9 (i). N = 7 (h) or 8 (i) WT and 9 Mx1-Cre+; MPP8f/f mice. P values by a log-rank Mantel-Cox test. Leukemia burden at day 95 (AE9a) or day 62 (MLL-AF9) post-transplantation is shown. Results are mean ± SEM (N = 5 mice per group) and analyzed by a two-way ANOVA with Bonferroni’s test.
Figure 3 |
Figure 3 |. MPP8 loss reactivates L1 retrotransposons in myeloid leukemia.
a, Scatterplots of differentially expressed genes in MPP8 KO relative to WT MOLM-13 AML cells by strand-specific pair-end RNA-seq (fold change ≥ 2 and FDR-adjusted P value ≤ 10−30 by DESeq2). A zoom-in view of the upregulated genes is shown with significantly upregulated L1s (red dots) and all other L1s (blue dots). b, Upregulation of human L1 gene signature in MPP8 KO MOLM-13 cells by GSEA. The normalized enrichment score (NES) and nominal P value based on permutation-generated null distribution are shown. c, Activation of L1Hs and other L1 subfamilies in MPP8-deficient MOLM13 cells. Results are mean ± SD (N = 3 independent experiments) and analyzed by a two-sided unpaired t test. d, Browser view of representative L1 loci with significant enrichment of MPP8 and H3K9me3 ChIP-seq signals. e, Expression of L1-encoded ORF1p was significantly upregulated in MPP8-deficient AML cells by Western blot. GAPDH was analyzed as a loading control. f, Schematic of the L1 retrotransposition reporter assay. g, L1 retrotransposition rates were increased in MPP8 KO relative to control (sgNT) AML cells, and inhibited by 10 µM of 3TC treatment after Dox-induced MPP8 KO. Results are mean ± SD (N = 5 independent experiments) and analyzed by a two-way ANOVA with Dunnett’s test. h, Inhibition of L1 retrotransposition by 3TC abrogated the cell growth defects of MPP8-deficient AML cells. Results are mean ± SD (N = 3 independent experiments) and analyzed by a two-way ANOVA with Dunnett’s test. P values are shown in Supplementary Table 7. *P < 0.05, **P < 0.01, ***P < 0.001, ****P < 0.0001.
Figure 4 |
Figure 4 |. Silencing of LINE-1 retrotransposons in myeloid leukemia.
a, Expression of L1Hs (red lines) and other L1s (black lines) was downregulated in human CD34+ MDS and AML cells relative to normal CD34+ HSPCs. y-axis shows the log2 normalized mRNA expression (read counts) of annotated L1s. P value by a two-sided paired t test (N = 131 annotated L1s in 8 normal and 82 MDS, or 10 normal and 9 AML samples). Boxes show median of data and quartiles, and whiskers extend to 1.5× of interquartile range. b, Expression of L1Hs and other L1s was downregulated in human CD34+CD38 AML LSCs relative to blasts. P value by a two-sided paired t test (N = 131 L1s in 8 LSCs and 8 blasts). c, L1s were downregulated in LSChigh relative to LSClow AML samples. Samples derived from BM or PB were grouped. P values by a two-sided paired t test (N = 131 L1s in 13 LSClow and 3 LSChigh BM samples, or 5 LSClow and 3 LSChigh PB samples). d, L1s were downregulated in relapsed relative to diagnosis AML samples. P values by a two-sided paired t test (N = 131 L1s in 10 diagnosis and 10 relapse samples in GSE128603, or 19 diagnosis and 19 relapse samples in phs001027.v2.p1). e, Lower L1 expression is associated with poor survival in TCGA AML cohorts (N = 134 samples). L1Hs-high (top 50%) and L1Hs-low (bottom 50%) samples were compared. P value by a log-rank Mantel-Cox test. f, L1s were downregulated by AML oncogenes in LSK cells. P values by a paired t test (N = 2 DNMT3A+/+ and 4 DNMT3A+/m, 2 TET2 WT and 2 KO, 2 TET2 WT and 2 mutant, 3 WT and 3 NRASG12DTET2KO, or 3 WT and 4 NRASG12DEZH2KO). g, L1s were downregulated by AE9a or MLL-AF9 in LSK or GMP cells, and further downregulated in transplanted recipient mouse BM or spleen (SPL). L1s were also downregulated in human CD34+ HSPCs upon expression of AE9a or MLL-AF9 relative to empty vector (control) or un-transduced cells. Results are mean ± SD (N = 4 experiments) and analyzed by a one-way ANOVA with Dunnett’s or Tukey’s test.
Figure 5 |
Figure 5 |. Reactivation of L1 retrotransposition impairs AML in vitro and in vivo.
a, Schematic of CRISPR-mediated activation (CRISPRa) of endogenous L1s. sgRNAs were designed against the promoter (5’UTR) region of L1Hs. b, Expression of young L1s was upregulated in MOLM-13 cells upon CRISPRa-mediated activation by multiplexed targeting of L1 promoters with the triple-sgRNA combinations (sg278 or sg457). Results are mean ± SD (N = 3 independent experiments) and analyzed by a two-way ANOVA with Dunnett’s test. c, L1 retrotransposition rates were determined in MOLM-13 and OCI-AML3 cells upon CRISPRa-mediated L1 activation. 3TC treatment (10 µM) abrogated L1 retrotransposition. Cells stably expressing the retrotransposition-deficient JM111 reporter were analyzed as controls. Results are mean ± SD (N = 5 independent experiments) and analyzed by a two-way ANOVA with Dunnett’s test. d, Kaplan-Meier survival curves of NSG mice xenografted with control (sgNT) or L1-reactivated MOLM-13 cells. N = 5 per group. P values by a log-rank Mantel-Cox test. e, Schematic of activating L1 retrotransposition during leukemia development using the L1-EGFP transgenic mouse. f, Activated L1 retrotransposition as determined by GFP+ cells in BM lineage-negative cells of L1-EGFP mice. C57BL/6 WT mice were analyzed as controls. N = 4 WT and 4 L1-EGFP. P value by a two-sided t test. g, Kaplan-Meier survival curves of recipient mice upon transplantation of AE9a-transformed cells from WT or L1-EGFP mice. N = 8 WT and 8 L1-EGFP mice. P value by a log-rank Mantel-Cox test. Quantification of leukemia burden in PB, BM and spleen at day 60 is shown. Results are mean ± SD (N = 5 mice per genotype) and analyzed by a two-way ANOVA with Bonferroni’s test. h, Kaplan-Meier survival curves of recipient mice after transplantation of MLL-AF9-transformed cells. N = 5 WT and 9 L1-EGFP mice. P value by a log-rank Mantel-Cox test. Leukemia burden in PB, BM and spleen at day 38 post-transplantation is shown. Results are mean ± SD (N = 5 mice per genotype) and analyzed by a two-way ANOVA with Bonferroni’s test.
Figure 6 |
Figure 6 |. MPP8 suppresses L1s to safeguard genome stability in myeloid leukemia.
a, MPP8 loss increased γH2A.X foci (green) relative to control (sgNT) in AML cells, whereas 3TC treatment (10 µM for 3 days) abrogated the DNA damage response. b, Quantification of γH2A.X foci in control and MPP8-deficient AML cells with vehicle or 10 µM of 3TC. Results are mean ± SD (N = 20 cells over 3 independent experiments) and analyzed by a two-way ANOVA with Dunnett’s test. c, L1 reactivation increased γH2A.X foci in AML cells, which were abrogated by 3TC treatment (10 µM for 3 days). d, Quantification of γH2A.X in control and L1-reactivated AML cells. Results are mean ± SD (N = 20 cells over 3 experiments) and analyzed by a two-way ANOVA with Dunnett’s test. e, MPP8 loss increased p21 expression in MOLM-13 and OCI-AML3 cells 3 days after Dox-induced MPP8 KO. f, L1 reactivation increased p21 expression in AML cells 3 days after transduction of sgRNAs. g, Quantification of γH2A.X by intracellular staining of MLL-AF9-transformed AML cells. The mean % of γH2A.X-positive cells from 3 independent mice is shown. P values by a two-sided t test. h, Quantification of p21 by intracellular staining. The mean % of p21-positive cells from 3 independent mice is shown. P values by a two-sided t test. i, Kaplan-Meier survival curves of recipient mice after transplantation of AE9a-transformed BM lineage-negative cells from WT (N = 7), MPP8−/− (N = 9), or MPP8−/−p21−/− (N = 7) mice. P values by a log-rank Mantel-Cox test. Leukemia burden in PB, BM and spleen at day 60 post-transplantation is shown. Results are mean ± SEM (N = 5 mice) and analyzed by a two-way ANOVA with Tukey’s test. j, Kaplan-Meier survival curves of recipients engrafted with AE9a-transformed AML cells. N = 7, 10, and 7 WT, Mx1-Cre+;MPP8f/f, and Mx1-Cre+;MPP8f/f;p21−/− mice, respectively. P values by a log-rank Mantel-Cox test. Leukemia burden at day 90 is shown. Results are mean ± SEM (N = 5 mice) and analyzed by a two-way ANOVA with Tukey’s test. k, Schematic of the working model.

Comment in

  • Retrotransposons: Jump to Cancer?
    Wu Y, Wu X, Li S. Wu Y, et al. Trends Cancer. 2021 Jul;7(7):577-579. doi: 10.1016/j.trecan.2021.04.004. Epub 2021 May 13. Trends Cancer. 2021. PMID: 33992534

References

    1. Kazazian HH Jr. & Moran JV The impact of L1 retrotransposons on the human genome. Nat Genet 19, 19–24 (1998). - PubMed
    1. Kazazian HH Jr. & Moran JV Mobile DNA in Health and Disease. N Engl J Med 377, 361–370 (2017). - PMC - PubMed
    1. Burns KH Transposable elements in cancer. Nat Rev Cancer 17, 415–424 (2017). - PubMed
    1. Huang CR, Burns KH & Boeke JD Active transposition in genomes. Annu Rev Genet 46, 651–75 (2012). - PMC - PubMed
    1. Lander ES et al. Initial sequencing and analysis of the human genome. Nature 409, 860–921 (2001). - PubMed

Methods-only References

    1. Miura H, Quadros RM & Gurumurthy CB Easi-CRISPR for creating knock-in and conditional knockout mouse models using long ssDNA donors. Nature Protocols 13, 195–215 (2018). - PMC - PubMed
    1. Labun K et al. CHOPCHOP v3: expanding the CRISPR web toolbox beyond genome editing. Nucleic Acids Res 47, W171–w174 (2019). - PMC - PubMed
    1. Chen B et al. Dynamic imaging of genomic loci in living human cells by an optimized CRISPR/Cas system. Cell 155, 1479–91 (2013). - PMC - PubMed
    1. Li K et al. Interrogation of enhancer function by enhancer-targeting CRISPR epigenetic editing. Nat Commun 11, 485 (2020). - PMC - PubMed
    1. Premsrirut PK et al. A rapid and scalable system for studying gene function in mice using conditional RNA interference. Cell 145, 145–58 (2011). - PMC - PubMed

Publication types