. 2021 Apr;3(4):571-585.
doi: 10.1038/s42255-021-00374-y. Epub 2021 Apr 8.

Mitochondrial NADP+ is essential for proline biosynthesis during cell growth

Affiliations

Mitochondrial NADP+ is essential for proline biosynthesis during cell growth

Diem H Tran et al. Nat Metab. 2021 Apr.

Abstract

Nicotinamide adenine dinucleotide phosphate (NADP+) is vital to produce NADPH, a principal supplier of reducing power for biosynthesis of macromolecules and protection against oxidative stress. NADPH exists in separate pools, in both the cytosol and mitochondria; however, the cellular functions of mitochondrial NADPH are incompletely described. Here, we find that decreasing mitochondrial NADP(H) levels through depletion of NAD kinase 2 (NADK2), an enzyme responsible for production of mitochondrial NADP+, renders cells uniquely proline auxotrophic. Cells with NADK2 deletion fail to synthesize proline, due to mitochondrial NADPH deficiency. We uncover the requirement of mitochondrial NADPH and NADK2 activity for the generation of the pyrroline-5-carboxylate metabolite intermediate as the bottleneck step in the proline biosynthesis pathway. Notably, after NADK2 deletion, proline is required to support nucleotide and protein synthesis, making proline essential for the growth and proliferation of NADK2-deficient cells. Thus, we highlight proline auxotrophy in mammalian cells and discover that mitochondrial NADPH is essential to enable proline biosynthesis.


Conflict of interest statement

Competing interests

R.J.D. is an advisor for Agios Pharmaceuticals and Vida Ventures. All other authors declare no competing interests.

Figures
Extended Data Fig. 1 |
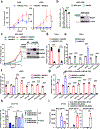
Extended Data Fig. 1 |. NADK2-deficient cells require proline for cell proliferation.
a, A549 and K562 ΔNADK2 cells stably reconstituted with either empty vector (Vec) or NADK2 were injected subcutaneously into athymic nude mice. Tumour growth curves are shown as average of all tumours from the data shown in Fig. 1c,d. Data are presented as mean ± SEM from 7 tumors (A549) or 3 or 4 tumours (K562). *P < 0.05 for pairwise comparisons calculated using a one-sided Student’s t-test. b, Immunoblots and cell proliferation of wild-type or single cell-derived knockout cells of NADK in HEK-293E cells grown in DMEM with 10% serum. Proliferation rate was assessed 72 h post-plating and normalized to Day 0. c, Relative proliferation rate was assessed in three consecutive days from wild-type or isogenic ΔNADK2 cells stably expressing either empty vector, NADK2 or NADK. Immunoblots for NADK, NADK2 and β-actin are shown. d, Relative proliferation rate as in (b) from isogenic ΔNADK2 HeLa cells stably expressing either empty vector or NADK2. Cells were grown in 10% dialyzed serum or supplemented with oleate (0.1 mM). e, Relative proliferation rate as in (b) from wild-type or ΔNADK2 HeLa cells. Cells were grown in 10% dialyzed serum for 72 hours or supplemented with NAC (5 mM), nucleosides (inosine 0.1 mg/ml uridine, 0.1 mg/ml), non-essential amino acid (NEAA) mixture (1X), pyruvate (10 mM) or aspartate (10 mM). f, Relative proliferation rate as in (b) from isogenic ΔNADK2 K562 cells stably expressing either empty vector or NADK2 and supplemented with the indicated individual non-essential amino acids at concentration present in human plasma-like medium (HPLM). g, Relative proliferation rate as in (b) from isogenic ΔNADK2 HEK-293E cells stably expressing either empty vector or NADK2, and supplemented with the indicated individual non-essential amino acids at 10X concentration present in human plasma-like medium (HPLM). Related to Fig. 1f. h, Relative proliferation rate as in (b) from HCT116 cells with stable shRNA-mediated knockdown of NADK2 grown in the presence or absence of proline (2 mM). i, Normalized peak areas of mitochondrial NAD + (M + 4), NADP + (M + 4) and NADPH (M + 4) from labeling with 13C3-15N-nicotinamide are shown. ΔNADK2 HEK293E cells stably expressing HA-Mito were stably reconstituted with either empty vector or NADK2. HEK-293E cells expressing (Myc-Mito) were used as a negative control (1-Ctrl). HA-tagged mitochondria were isolated from equal amount of protein for each condition and metabolites were analyzed by targeted LC-MS/MS. Data are presented as the mean ± SD (b-i) from n = 4 of biologically independent samples for (b), n = 3 for (c,g,h,i), n = 12 for (d), n = 3–9 for (e), n = 3–5 for (f) and are representative of at least two independent experiments. *P < 0.05, **P < 0.01, ***P < 0.001 for comparisons calculated using a two-sided Student’s t-test for (b) and with one-way ANOVA test and Tukey’s post-hoc test for (c-i).
Extended Data Fig. 2 |
Extended Data Fig. 2 |. NADK2-deficient tumors display reduced proline levels.
a,b, Immunoblots and peak areas of proline and other amino acid are shown from A549 (a) and K562 (b) xenograft tumours that are NADK2-deficient (blue) or that express NADK2 from tumors in Fig. 1c,d. Each condition represents four tumors, and levels of NADK2 are assessed by immunoblotting and shown below the graphs. Data are presented as the mean ± SD from n = 4 of biologically independent samples. **P < 0.01 for comparisons was calculated using a two-sided Student’s t-test.
Extended Data Fig. 3 |
Extended Data Fig. 3 |. Glutamine-dependent proline synthesis is dependent on NADK2 (Data supporting Fig. 5).
a, Schematic of 13C5-glutamine labelling. b, Fractional abundance (%) of glutamine (M + 5) from experiment presented in Fig. 5b. c, Fractional abundance (%) of glutamine (M + 5) from experiment presented in Fig. 5c. d, Fractional abundance (%) of glutamine (M + 5), glutamate (M + 5) and proline (M + 5) from isogenic ΔNADK2 A549 cells stably expressing either empty vector (−) or NADK2 cDNA and labeled for 3 hours with 13C5-glutamine. Wildtype counterparts of each cell line are shown as controls. e, Fractional abundance (%) of glutamine (M + 5), glutamate (M + 5) and proline (M + 5) from isogenic ΔNADK2 K562 cells stably expressing either empty vector (−) or NADK2 cDNA and labeled for 3 hours with 13C5-glutamine. Wildtype counterparts of each cell line are shown as controls. f, Immunoblots from HCT116 cells stably expressing a control shRNA (Ctrl), NADK2 shRNA, or two shRNAs against P5CS. g, Fractional abundance (%) of glutamine (M + 5), glutamate (M + 5) and proline (M + 5) from HCT116 cells stably expressing a control shRNA (Ctrl) or two shRNAs against P5CS. Immunoblots are shown in (f). h, Fractional abundance (%) of glutamine (M + 5), glutamate (M + 5) and proline (M + 5) from HCT116 cells stably expressing a control shRNA (Ctrl) or an shRNA against NADK2. Immunoblots are shown in (f). Data are presented as the mean ± SD from n = 4 of biologically independent samples for (b-e) and n = 3 or 4 for (g,h) and are representative of at least two independent experiments. *P < 0.05, **P < 0.01, ***P < 0.001 for comparisons was calculated using a two-sided Student’s t-test for (h) and with one-way ANOVA test and Tukey’s post-hoc test for (b-e,g).
Extended Data Fig. 4 |
Extended Data Fig. 4 |. NADK2 regulated proline synthesis for cell growth. Data supporting Fig. 5.
a, Immunoblots of NADK2 and proline biosynthesis genes shown for wild-type or isogenic ΔNADK2 HEK293E cells stably expressing either empty vector or NADK2 grown in DMEM supplemented with 10% serum in the presence or absence of proline (0.2 mM). Data are representative of at least two independent experiments. b, Immunoblots as in (a) for wild-type or isogenic ΔNADK2 A549 cells stably expressing either empty vector or NADK2 grown in DMEM supplemented with 10% serum in the presence or absence of proline (0.2 mM). Data are representative of at least two independent experiments. c, Immunoblot and fractional abundance (%) of glutamine (M + 5) from experiment presented in Fig. 2d. d, Schematic showing the sequence conservation of D161 among NADK2 orthologs across different species. e, Fractional abundance (%) of glutamine (M + 5) from experiment presented in Fig. 5e. f, Fractional abundance (%) of glutamine (M + 5) from experiment presented in Fig. 5f. g, Relative proliferation rate as in (Fig. 5g), but from isogenic ΔNADK2 HEK293E cells stably expressing either empty vector or NADK2. Cells were grown in 10% dialyzed serum for 72 hours or supplemented with ornithine (0.5 mM), dimethyl α-ketoglutarate (0.25 mM), or with ornithine (0.5 mM) and dimethyl α-ketoglutarate (0.25 mM). h, Normalized peak areas of ornithine (M + 7) from 3 hours labeling with 13C5-15N2-ornithine are shown from experiment presented in Fig. 5i. Data are presented as the mean ± SD from n = 4 of biologically independent samples for (c), n = 3 for (e-h) and are representative of at least two independent experiments. *P < 0.05, **P < 0.01 for comparisons calculated using a two-sided Student’s t-test for (c,h) and with one-way ANOVA test and Tukey’s post-hoc test for (e-g).
Extended Data Fig. 5 |
Extended Data Fig. 5 |. Proline does not affect the NADK2-dependent regulation of ROS levels.
a, Relative proliferation in ΔNADK2 HeLa cells cultured in DMEM with 10% dialyzed serum for 72 hours in the presence or absence of proline (2 mM) or PRODH inhibitor L-THFA (5 mM). Data is normalized to cells grown in the presence of proline. b, Relative proliferation as in (a) in HeLa ΔNADK2 cells reconstituted with NADK2. c, Schematic of putative functions of proline axis mediating ATP generation or defense against ROS. d,e, Mean fluorescence intensity for CellRox Green staining (ROS) in ΔNADK2 HeLa (d) or HEK-293E (e) cells stably expressing either empty vector or NADK2 cultured in 10% dialyzed serum in the presence or absence of proline (2 mM). f,g, GSH, GSSG and GSH/GSSG ratio quantified from ΔNADK2 HeLa (d) or HEK-293E (e) cells cultured in 10% dialyzed serum in the presence or absence of proline (2 mM). h,i, Extracellular Acidification Rate (ECAR) for ΔNADK2 HeLa (e) or HEK-293E (f) cells stably expressing either empty vector or NADK2 cultured in the presence or absence of proline (2 mM). Wildtype counterparts are shown (Supporting Fig. 6). Data are presented as the mean ± SD from n = 3 of biologically independent samples for (a,b), n = 4 for (d,e,f,g), n = 11 or 12 for (h), and n = 9–11 for (i), and are representative of at least two independent experiments. **P < 0.01, ***P < 0.001 for comparisons calculated using a two-sided Student’s t-test for (f,g) and with one-way ANOVA test and Tukey’s post-hoc test for (a,b,d,e,h,i).
Extended Data Fig. 6 |
Extended Data Fig. 6 |. NADK2 loss results in impairment of cell cycle progression.
a, Cell cycle profiles (histograms) at indicated time points after release from G1 phase arrest induced by double-thymidine block, from ΔNADK2 HeLa cells stably expressing either empty vector or WT NADK2, cultured in the presence or absence of proline (0.2 mM) as indicated. Data are analyzed using the FlowJo’s Watson Pragmatic cell cycle platform algorithm and are representative of at least two independent experiments performed in duplicates or tripicates. b, Cell cycle profiles from asynchronous ΔNADK2 HeLa cells stably expressing either empty vector or WT NADK2, cultured in the presence or absence of proline (0.2 mM) as indicated. Biological duplicates are shown. Data are analyzed using the FlowJo’s Watson Pragmatic cell cycle platform algorithm and are representative of at least two independent experiments performed in duplicates or triplicates.
Extended Data Fig. 7 |
Extended Data Fig. 7 |. NADK2 regulates nucleotide synthesis (Data supporting Fig. 7).
a, Schematic of 13C6-glucose labelling. b, Schematic of 3-13C-serine labeling. c, Fractional abundance (%) of Serine (M + 1), 10-Formyl-THF (M + 1), and dTMP (M + 1) from isogenic ΔNADK2 HEK-293E cells stably expressing either empty vector or NADK2 cDNA and labeled for 6 hours with 3-13C-serine. d, Relative incorporation of radiolabel from 14C-glycine, 14C-aspartate, or 3H-uridine (6 hours labelling) from isogenic ΔNADK2 HEK-293E cells stably expressing either empty vector (−) or NADK2 cDNA grown in the presence or absence of proline (0.2 mM). e, Relative incorporation of radiolabel from 3H-uridine (6 hours labelling) from isogenic ΔNADK2 HeLa, or K562 cells stably expressing either empty vector or NADK2 cDNA grown in the presence or absence of proline (0.2 mM). Performed in parallel with experiment shown in Fig. 7c (HeLa) and Fig. 7d (K562). Data are presented as the mean ± SD from n = 3–4 of biologically independent samples (c,d,e) and are representative of at least two independent experiments. **P < 0.01, ***P < 0.001 for comparisons calculated using a two-sided Student’s t-test for (c) and with one-way ANOVA test and Tukey’s post-hoc test for (d,e). f, Immunoblots of pentose pathway enzymes (TKT, TALDO, PGD, G6PD) and nucleotide biosynthesis genes (PPAT, GART) shown for isogenic ΔNADK2 HeLa, K562 or HEK-293E cells stably expressing either empty vector or NADK2, grown in DMEM supplemented with 10% serum in the presence or absence of proline (0.2 mM) for 48 hours. Data are representative of two independent experiments.
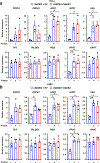
Extended Data Fig. 8 |
Extended Data Fig. 8 |. Proline availability regulates transcript levels of multiple nucleotide biosynthesis genes. (Data supporting Fig. 7).
a,b, Transcript levels are shown for the indicated nucleotide biosynthesis genes from isogenic ΔNADK2 HeLa (a), or K562 (b) cells stably expressing either empty vector or NADK2 grown in DMEM supplemented with 10% serum in the presence or absence of proline (0.2 mM). Data are presented as the mean ± SEM from =3 of biologically independent samples that were each measured in technical triplicates. *P < 0.05, **P < 0.01 for comparisons calculated using one-way ANOVA test and Tukey’s post-hoc test.
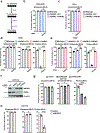
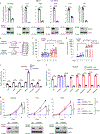
Fig. 1 |
Fig. 1 |. Loss of NADK2 renders cells dependent on proline for cell proliferation.
a, Cell proliferation and immunoblots of wild-type (WT) or single-cell-derived knockout cells of NADK2 (ΔNADK2) in HEK293E, HeLa, K562, A549, T47D and A375 grown in DMEM with 10% serum. Relative proliferation rate was assessed 72 h after plating and normalized to day 0. n = 3 biologically independent replicates for HEK293E, HeLa, K562 and A549 and n = 5 for T47D and A375. b, Experimental design of the tumour study. c, A549 ΔNADK2 cells stably reconstituted with either empty vector (Vec) or NADK2 were injected subcutaneously into athymic nude mice (n = 7 biologically independent animals). Tumour growth was monitored after tumour onset over time. Data are presented as the mean ± s.e.m. *P < 0.05 for comparisons were calculated using a one-sided Student’s t-test. d, K562 ΔNADK2 cells stably reconstituted with either empty vector or NADK2 were injected subcutaneously into athymic nude mice (n = 3 or 4 biologically independent animals). Tumour growth was monitored as in c. Data are presented as the mean ± s.e.m. *P < 0.05 for comparisons were calculated using a one-sided Student’s t-test. e, Relative proliferation rate as in a from WT or ΔNADK2 HEK293E cells. Cells were grown in 10% dialysed serum for 72 h or supplemented with NAC (5 mM), nucleosides (inosine, 0.1 mg ml−1; uridine, 0.1 mg ml−1), NEAA mixture (1×), pyruvate (10 mM) or aspartate (10 mM). n = 3–9 biologically independent samples. f, Relative proliferation rate as in e from isogenic ΔNADK2 HEK293E cells stably expressing either empty vector or NADK2 and supplemented with the indicated NEAAs at their concentrations in HPLM. n = 3 biologically independent samples. g, Relative proliferation rate in the presence or absence of proline (0.2 mM) was assessed in HEK293E, HeLa and K562 cells in three consecutive days. n = 3 biologically independent samples. Data are presented as the mean ± standard deviation (s.d.) and are representative of at least two independent experiments (a and e–g). ***P < 0.001 for comparisons were calculated using a two-sided Student’s t-test (a) and one-way analysis of variance (ANOVA) test and Tukey’s post hoc test (eg).
Fig. 2 |
Fig. 2 |. NADK2 is required for anchorage-independent cell growth.
ac, Quantification and representative images from ΔNADK2 HEK293E, T47D and K562 cells stably expressing either empty vector or WT NADK2 grown as spheroids (anchorage-independent growth) and cultured in the presence or absence of proline (0.2 mM). Quantification of the spheroid size from 4–6 independent images for each cell line. Data are the mean ± s.d. from n = 5 or 6 biologically independent samples for a, n = 4–6 for b and n = 6 for c, representative of at least two independent experiments. ***P < 0.001 for multiple comparisons were calculated using one-way ANOVA and Tukey’s post hoc test (ac).
Fig. 3 |
Fig. 3 |. NADK2 is required for the maintenance of proline levels.
a, Steady-state metabolite profiles from isogenic ΔNADK2 HEK293E cells stably expressing either empty vector or NADK2 grown in DMEM supplemented with 10% serum. Intracellular metabolites from four independent samples per condition were profiled by LC–MS/MS and shown as row-normalized heat maps. IMP, inosine-5′-monophosphate; UDP, uridine 5′-diphosphate. b, Peak areas are shown for glutamate and proline from a. c,d, Intracellular concentration of glutamate and proline are shown for NADK2-deficient and NADK2-expressing HEK293E (c) and K562 (d) cells after withdrawal of proline for 24 h. The concentrations (nmol mg−1) were calculated by LC–MS/MS using the indicated standards for glutamate and proline (Methods). Data are the mean ± s.d. from n = 4 biologically independent samples for a and n = 3 or 4 for c and d, and are representative of at least two independent experiments. *P < 0.05 and ***P < 0.001 for comparisons were calculated using a two-sided Student’s t-test (b) and one-way ANOVA test and Tukey’s post hoc test (c and d).
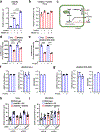
Fig. 4 |
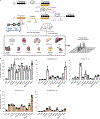
Fig. 4 |. In vivo infusions with 13C isotopes reveal that proline synthesis occurs mainly in the pancreas.
a, Schematic of the proline biosynthesis pathway, showing the enzymes and key steps that require reducing cofactors in the form of NAD(P)H or FADH2. Parentheses (P) indicate the ability of enzymes to use either NADH or NADPH. In vivo tracing with [13C5]glutamine and [13C5]proline in mice and the tissues extracted for metabolite analysis by mass spectrometry are indicated. b, Fractional abundance (%) of glutamine (M + 5), glutamate (M + 5) and proline (M + 5) across tissues following intravenous infusion with [13C5]glutamine (5 h). Fed WT mice were used, and each dot represents data from one mouse. Data are presented as the mean ± s.d. from n = 5 biologically independent animals. c, Fractional abundance (%) of proline (M + 5) and glutamate (M + 5) across tissues after intravenous infusion with [13C5]proline (3 h). Fed WT mice were used, and each dot represents data from one mouse. Data are presented as the mean ± s.d. from n = 5 biologically independent animals. Images of organs adapted from Servier Medical Art (https://smart.servier.com) under a Creative Commons Attribution 3.0 Unported License (https://creativecommons.org/licenses/by/3.0/).
Fig. 5 |
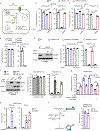
Fig. 5 |. NADK2 activity is required for glutamine-dependent proline biosynthesis.
a, Schematic of the proline biosynthesis pathway. b,c, Fractional abundance (%) of glutamate (M + 5) and proline (M + 5) from isogenic ΔNADK2 HEK293E (b) or HeLa (c) cells stably expressing either empty vector or NADK2 and labelled for 3 h with [13C5]glutamine. WT counterparts of each cell line are shown as controls. d, Fractional abundance (%) of glutamate (M + 5) and proline (M + 5) from WT and NADK2-deficient primary patient-derived fibroblasts labelled with [13C5]glutamine as in b. e, Immunoblots and fractional abundance (%) of glutamate (M + 5) and proline (M + 5) shown as in c from ΔNADK2 HEK293E cells transiently expressing empty vector (−), WT NADK2 or catalytically dead NADK2 mutant (D161A). WT counterparts are shown. f, Immunoblots and fractional abundance (%) of glutamate (M + 5) and proline (M + 5) from NADK2 and NNT double-knockout (ΔNADK2 + ΔNNT) HEK293E cells transiently expressing empty vector, NADK2, NNT or both NADK2 and NNT. g, Relative proliferation rate as in Fig. 1a from isogenic ΔNADK2 HeLa cells stably expressing either empty vector or NADK2. Cells were grown in 10% dialysed serum for 72 h or supplemented with ornithine (0.5 mM), dimethyl α-ketoglutarate (DMKG; 0.25 mM), proline (0.2 mM) and a mixture of polyamines (1×). h, Normalized peak areas of ornithine and proline from ΔNADK2 HeLa cells stably expressing either empty vector or NADK2 and grown for 36 h in the presence or absence of ornithine (0.5 mM). i, Normalized peak areas of proline from ΔNADK2 HeLa cells stably expressing either empty vector or NADK2 and labelled for 3 h with [13C5-15N2]ornithine. Left, schematic of [13C5-15N2]ornithine (M + 7) tracing experiment, indicating 13C-labelled carbon atoms (grey) or 15N-labelled nitrogen atoms (blue) present in ornithine and proline. Data are the mean ± s.d. from n = 4 biologically independent samples for bd and n = 3 for ei, and are representative of at least two independent experiments. *P < 0.05, **P < 0.01 and ***P < 0.001 for comparisons were calculated using a two-sided Student’s t-test (d and i) and one-way ANOVA and Tukey’s post hoc test (b, c and eh).
Fig. 6 |
Fig. 6 |. Proline levels do not alter the NADK2-dependent regulation of mitochondrial respiration.
ad, OCR for ΔNADK2 HeLa (a), HEK293E (b), K562 (c) and A549 (d) cells stably expressing either empty vector or NADK2 cultured in the presence or absence of proline (2 mM). WT counterparts are shown. OCR values were normalized to optical density from crystal violet assays (Methods). e, Schematic of [13C5]glutamine tracing into TCA cycle intermediates. α-KG, α-ketoglutarate; OAA, oxaloacetate. f, Fractional abundance (%) of the indicated TCA cycle intermediates from isogenic ΔNADK2 HeLa cells stably expressing either empty vector (−) or NADK2 cDNA and labelled for 3 h with [13C5]glutamine and cultured in the presence or absence of proline. Data are presented as the mean ± s.d. and are representative of at least two independent experiments. n = 11 or 12 biologically independent samples for a and d, n = 3–12 for b, n = 7–12 for c and n = 3 or 4 for f. *P < 0.05, **P < 0.01 and ***P < 0.001 for multiple comparisons were calculated using one-way ANOVA with Tukey’s post hoc test.
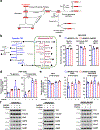
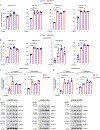
Fig. 7 |
Fig. 7 |. Proline becomes limiting for nucleotide synthesis in NADK2-deficient cells.
a,b, Fractional abundance (%) of 13C-labelled intermediates of purine (AMP (M + 5) and GMP (M + 5)) and pyrimidine (CMP (M + 5) and UDP (M + 5)) synthesis, measured by targeted LC–MS/MS, from isogenic ΔNADK2 HeLa (a) or K562 (b) cells stably expressing either empty vector or NADK2, grown in the presence or absence of proline (0.2 mM) and labelled for 3 h with [13C6]glucose. c,d, Relative incorporation of radiolabel from [14C]glycine or [14C]aspartate (6 h of labelling) from isogenic ΔNADK2 HeLa (c) or K562 (d) cells, stably expressing either empty vector or NADK2 and grown in the presence or absence of proline (0.2 mM). n = 3 biologically independent samples. e, Immunoblots of nucleotide biosynthesis genes and NADK2 shown for isogenic ΔNADK2 HeLa, K562 or HEK293E cells stably expressing either empty vector or NADK2, grown in DMEM supplemented with 10% serum in the presence or absence of proline (0.2 mM) for 48 h. Data are representative of two independent experiments. Data are the mean ± s.d. from n = 4 biologically independent samples for a, n = 3 or 4 for b and n = 3 for c and d, and are representative of at least two independent experiments. *P < 0.05, **P < 0.01 and ***P < 0.001 using a one-way ANOVA with Tukey’s post hoc test for ad.
Fig. 8 |
Fig. 8 |. NADK2 loss inhibits protein synthesis and triggers activation of the GCN2–eIF2α–ATF4 pathway.
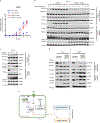
a, Relative protein synthesis rate presented as the percentage of RFP over a 12-h period from isogenic ΔNADK2 HeLa cells stably expressing either empty vector or NADK2 and transiently transfected with mScarlet RFP. Cells were grown in the absence or presence of proline (0.2 mM). Data are presented as the mean ± s.d. from n = 2 biologically independent samples and are representative of two independent experiments. b, Time course of proline dropout (withdrawal) from ΔNADK2 HeLa cells stably expressing either empty vector or WT NADK2. Activation of markers of the GCN2–eIF2α–ATF4 pathway, but not mTORC1, is observed in ΔNADK2 HeLa cells within 12 h of proline withdrawal. Data are representative of two independent experiments. c, Time course (as indicated) of amino acid withdrawal (−AA) in WT HeLa cells showing inhibition of mTORC1 signalling and activation of the GCN2–eIF2α–ATF4 pathway. Data are representative of two independent experiments. d, Activation of the GCN2–eIF2α–ATF4 pathway and inhibition of mTORC1 signalling in ΔNADK2 HeLa and K562 cells stably expressing either empty vector or WT NADK2 cultured for 48 h in the presence or absence of proline (0.2 mM). Data are representative of two independent experiments. e, Model of NADK2 controlling proline biosynthesis, which sustains nucleotide and protein synthesis for cell growth and proliferation.

References

    1. DeBerardinis RJ & Chandel NS Fundamentals of cancer metabolism. Sci. Adv 2, e1600200 (2016). - PMC - PubMed
    1. Pollak N, Dölle C. & Ziegler M. The power to reduce: pyridine nucleotides–small molecules with a multitude of functions. Biochem. J 402, 205–218 (2007). - PMC - PubMed
    1. Hosios AM & Vander Heiden MG The redox requirements of proliferating mammalian cells. J. Biol. Chem 293, 7490–7498 (2018). - PMC - PubMed
    1. Hoxhaj G. & Manning BD The PI3K–AKT network at the interface of oncogenic signalling and cancer metabolism. Nat. Rev. Cancer 20, 74–88 (2020). - PMC - PubMed
    1. Xiao W, Wang R-S, Handy DE & Loscalzo J. NAD(H) and NADP(H) redox couples and cellular energy metabolism. Antioxid. Redox Signal 28, 251–272 (2018). - PMC - PubMed

Publication types