. 2021 Apr;3(4):558-570.
doi: 10.1038/s42255-021-00378-8. Epub 2021 Apr 8.

Respiratory complex and tissue lineage drive recurrent mutations in tumour mtDNA

Affiliations

Respiratory complex and tissue lineage drive recurrent mutations in tumour mtDNA

Alexander N Gorelick et al. Nat Metab. 2021 Apr.

Abstract

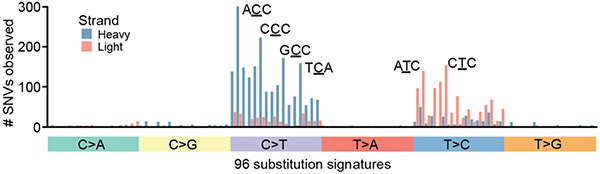
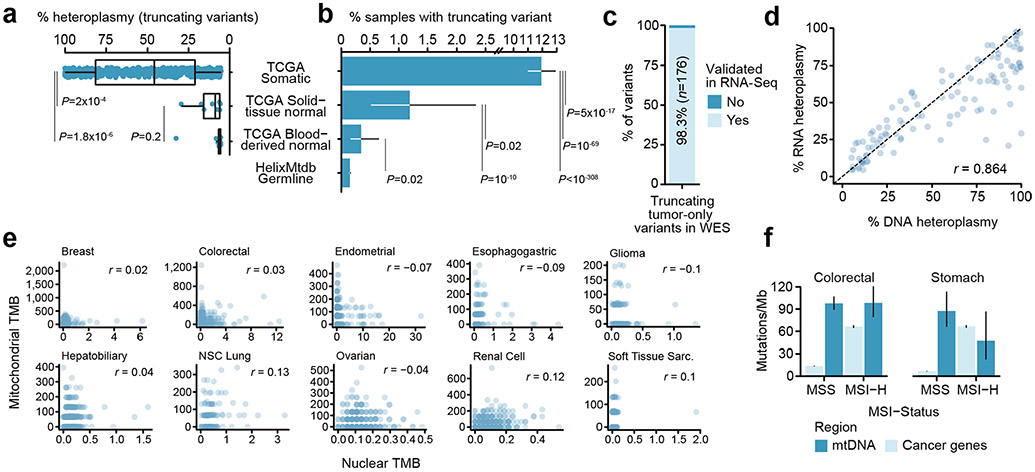
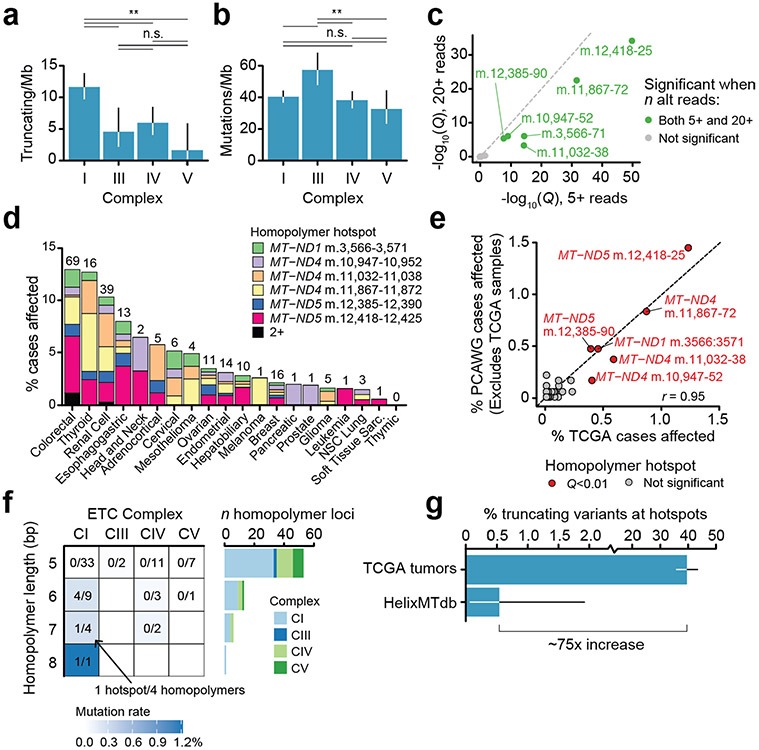
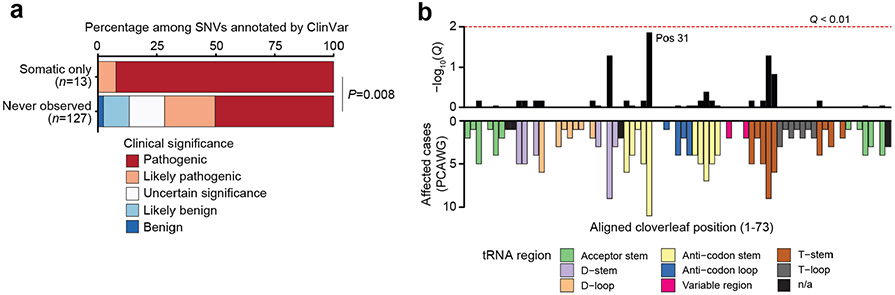
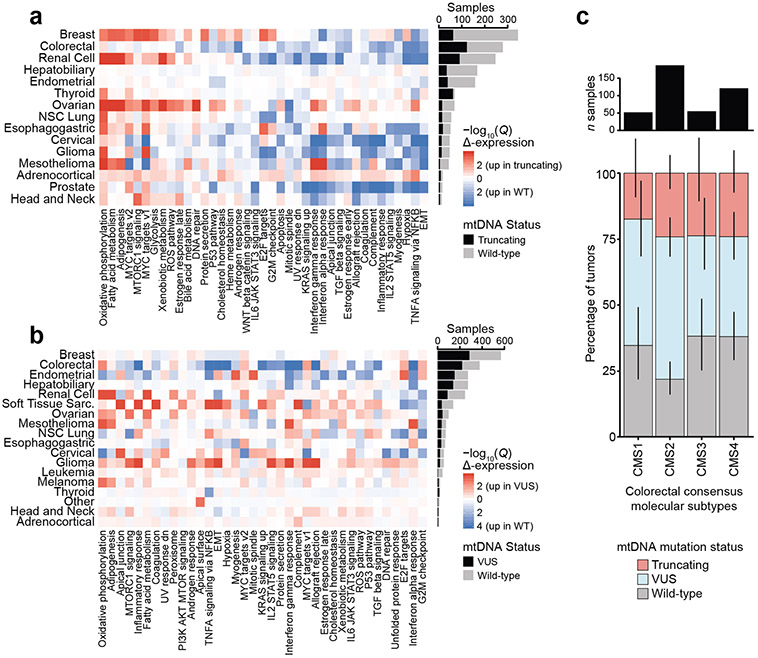
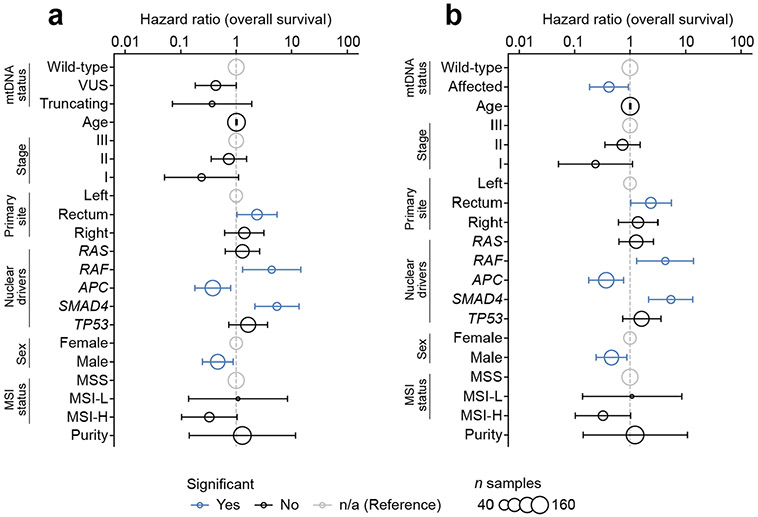
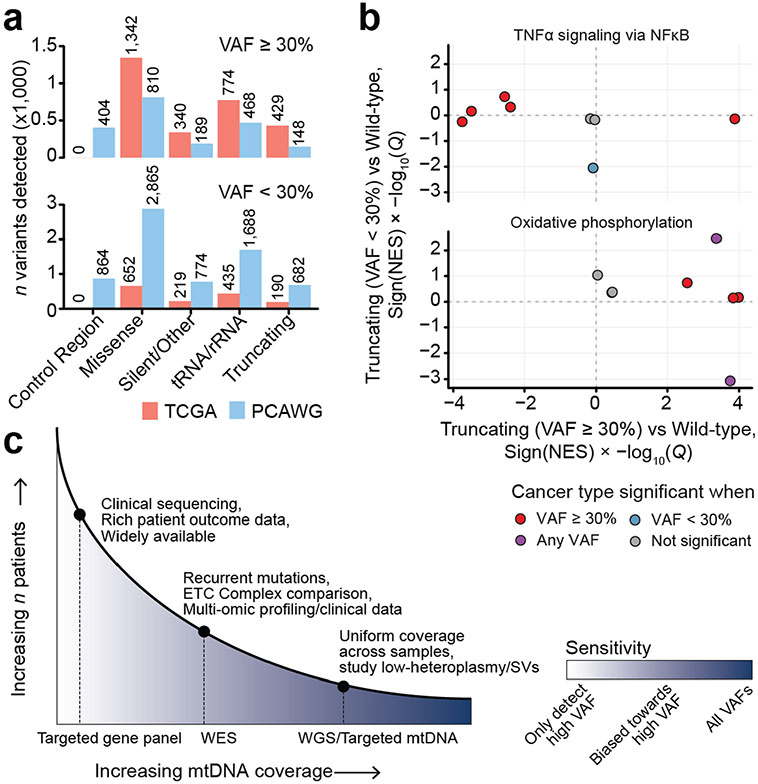
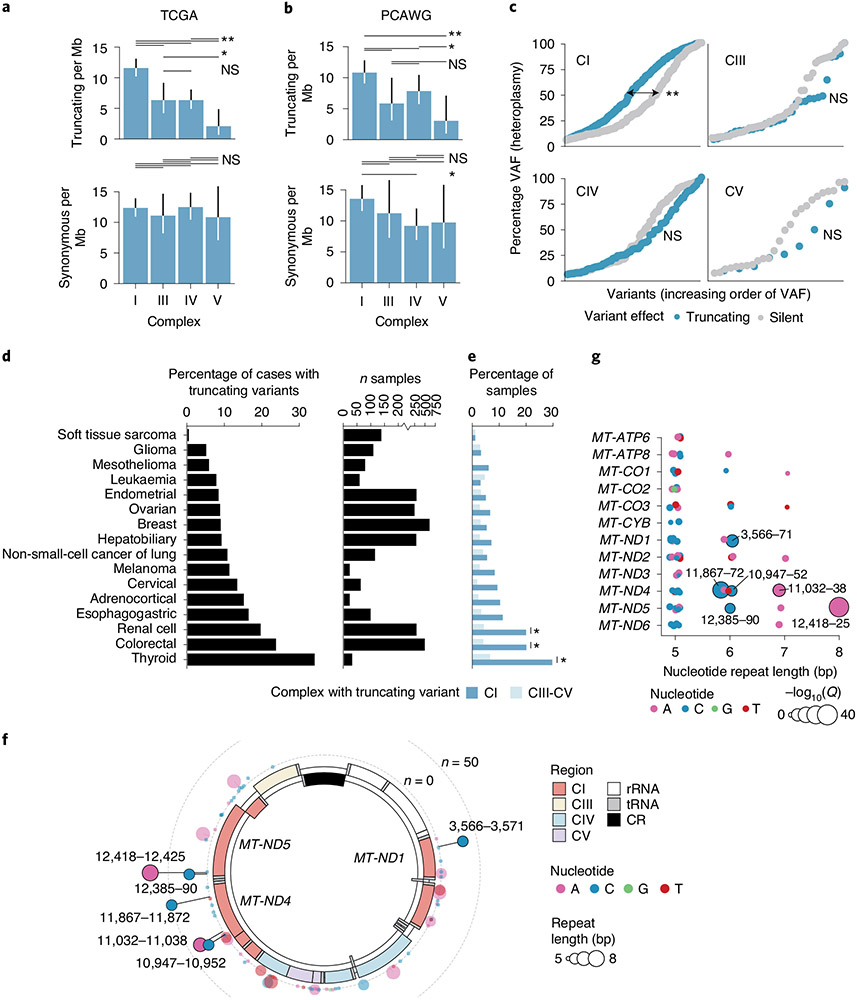
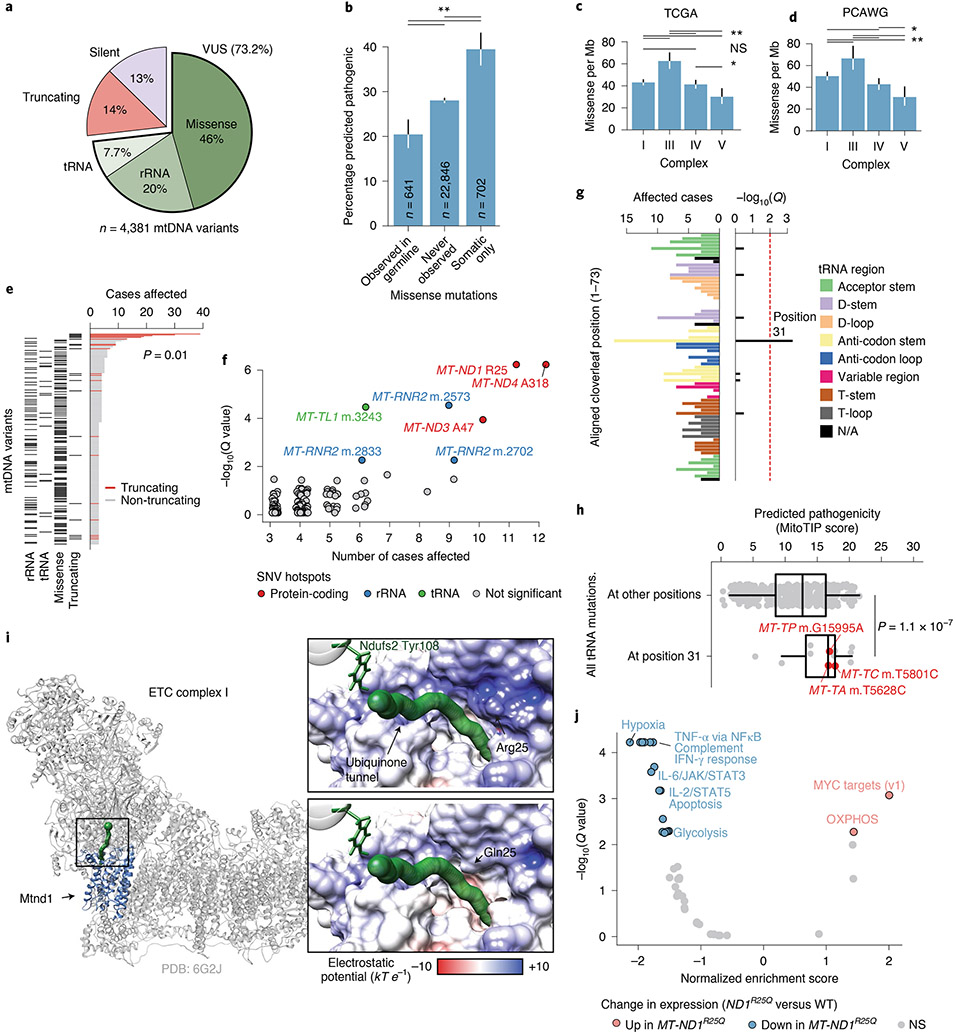
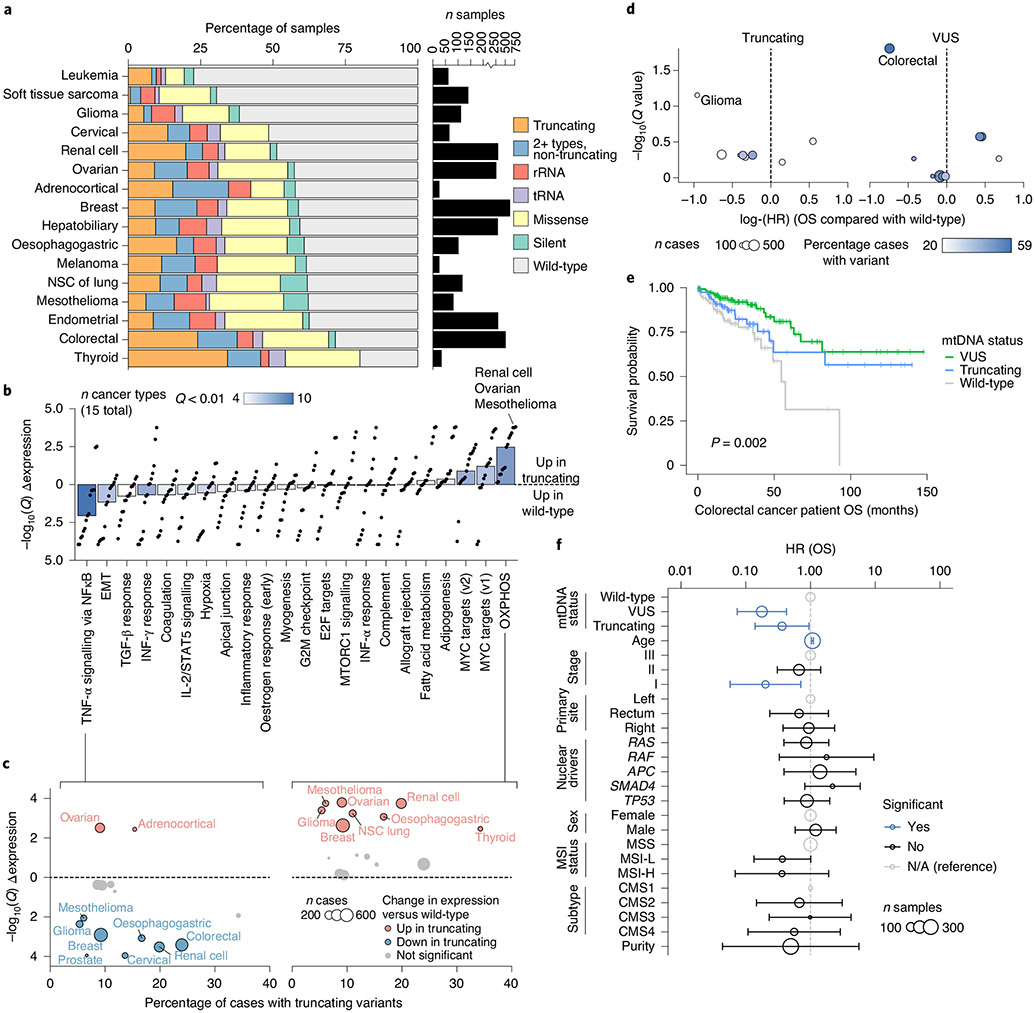
Mitochondrial DNA (mtDNA) encodes protein subunits and translational machinery required for oxidative phosphorylation (OXPHOS). Using repurposed whole-exome sequencing data, in the present study we demonstrate that pathogenic mtDNA mutations arise in tumours at a rate comparable to those in the most common cancer driver genes. We identify OXPHOS complexes as critical determinants shaping somatic mtDNA mutation patterns across tumour lineages. Loss-of-function mutations accumulate at an elevated rate specifically in complex I and often arise at specific homopolymeric hotspots. In contrast, complex V is depleted of all non-synonymous mutations, suggesting that impairment of ATP synthesis and mitochondrial membrane potential dissipation are under negative selection. Common truncating mutations and rarer missense alleles are both associated with a pan-lineage transcriptional programme, even in cancer types where mtDNA mutations are comparatively rare. Pathogenic mutations of mtDNA are associated with substantial increases in overall survival of colorectal cancer patients, demonstrating a clear functional relationship between genotype and phenotype. The mitochondrial genome is therefore frequently and functionally disrupted across many cancers, with major implications for patient stratification, prognosis and therapeutic development.


Figures

Extended Data Fig. 1 ∣
Extended Data Fig. 1 ∣. Baseline demographics of cohort and aspects of sequencing coverage.
a, The demographic distributions of patient age, race, gender, mtDNA somatic mutation status, history of neoadjuvant treatment, mtDNA coverage, and tumor sample type for each of the cancer types included in our analysis. Somatic mutation status is annotated among the subset of samples with ≥90% paired tumor-normal mtDNA sequencing coverage (see Methods: classifying sample mtDNA variant status); mtDNA status distributions are shown for cancer types >10 such samples. Cancer types are ordered by increasing proportions of samples with VUS or truncating mtDNA mutations. b, Cancer type mtDNA coverage variation based on sequencing center. Center, the average percentage of mtDNA (among regions considered in our study) with sufficient coverage for calling mutations, compared between different cancer types in our cohort. Dot color indicates the sequencing center from which the exome sequencing data originate. Top, density histograms of the average % mtDNA coverage for each sequencing center. Samples sequenced at the Broad Institute are uniquely depleted for mtDNA off-target coverage. c, mtDNA coverage from off-target reads at each position. The number of samples for which the given mtDNA position was sequenced to at least 5 reads (top, the depth threshold used in our analyses) and 20 reads (bottom, for comparison). Red, the number of samples using unpaired tumor-only data, applicable only for protein-truncating variants which were always assumed to be of somatic origin; blue, the number using only matched-normal samples; green, the number of samples with coverage in both tumor and matched-normal samples at the given position (applicable for all non-truncating variants which required evidence that the variant was absent in the matched normal to be classified as somatic). Purple, the number of whole-genome sequenced samples available from ICGC/PCAWG for comparison. d, Proportion of samples with detectable mutations is not biased by cancer type sequencing coverage. There is no correlation between the fraction of well-covered samples in a cancer type and the proportion of well-covered samples with a detectable somatic mtDNA mutation. Cancer types with ≥30 well-covered samples shown, P-value and 95% confidence intervals from linear regression.
Extended Data Fig. 2 ∣
Extended Data Fig. 2 ∣. Strand-specific mutational signatures in our dataset.
The frequency of somatic SNVs on the light or heavy mtDNA strand with each of the 96 possible mutational signatures with trinucleotide contexts (among n = 3,872 SNVs). Blue bars indicate the prevalence of mutational signatures for heavy-strand encoded SNVs (substitutions at C or T central nucleotides); red bars indicate those for light-strand encoded SNVs (substitutions at G or T nucleotides, which were standardized to their C or T complementary nucleotide). The most prevalent mutational signatures are labeled. The underlined central position is mutated with the single nucleotide substitution labeled in the tile below.
Extended Data Fig. 3 ∣
Extended Data Fig. 3 ∣. Analysis of mutation burden in normal tissues and of tumor mtDNA mutation burden with nuclear mutagenic processes.
a, Comparison of heteroplasmies between truncating variants detected in tumor tissue, adjacent normal tissue, and blood. P-values from two-sided Wilcoxon-rank sum test. Boxes are centered at the median and extended to from 25th-percentile to 75th-percentile; whiskers extend from 25/75th-percentiles to the largest value within 1.5 × IQR (interquartile range, 75th-percentile - 25th-percentile. b, Rate of truncating variants in TCGA tumors compared to matched non-malignant tissue, matched blood, and unmatched saliva samples from HelixMTdb. Truncating variants arise at 10-80-fold higher rate in tumors relative to normal tissues. Error bars are exact binomial 95% confidence intervals. P-values are from two-sided two-sample z-tests. c, The percentage of rescued truncating variants in TCGA that are recapitulated in orthogonal RNA sequencing from the same tumor sample. d, Correlation between heteroplasmies of rescued truncating variants in DNA and orthogonal RNA sequencing. Pearson correlation coefficient as shown. e, Mitochondrial and nuclear tumor mutation burdens (TMB, mutations/Mb) are shown for each well-covered tumor, among cancer types with n ≥ 100 samples. Nuclear TMBs are calculated based on mutations to 468 cancer-associated genes and their total exonic-sequence length. Pearson correlation coefficients r indicate no linear correlation between mitochondrial and nuclear TMBs were observed for any cancer type tested. f, TMBs for somatic mtDNA mutations and mutations to cancer-associated genes are compared between microsatellite stable (MSS) and microsatellite unstable (MSI-High) tumors, for both (n colorectal cancer: MSI=65, MSS=318; n stomach adenocarcinomas: MSI=75, MSS=256). Although MSI-High tumors have elevated TMB for nuclear cancer genes, there is no effect on mtDNA TMB. Moreover, mtDNA TMB is similar to (or exceeds) that of nuclear cancer associated genes in both cancer types. Error bars are 95% exact Poisson confidence intervals.
Extended Data Fig. 4 ∣
Extended Data Fig. 4 ∣. Age- and tumor stage-associations of somatic mtDNA mutations across cancer types.
Heatmap shows tumor mutation burden (total mutations/total covered Mbps) for samples of each tumor type (a) combined across varying patient age at time of diagnosis and (b) tumor pathologic stage. Gray tiles indicate cancer type/age combinations with fewer than 3 patients; cancer types shown had at least 2 non-gray tiles. Right column: Spearman correlation coefficient r indicating correlation between age or pathologic stage and tumor mutation burden. Asterisks denote statistically significant correlations based on FDR-corrected P-values from a Student’s t-distribution.
Extended Data Fig. 5 ∣
Extended Data Fig. 5 ∣. Molecular features of truncating variants at homopolymeric loci.
a,b, Enrichment for truncating variants in CI and non-truncating in CIII when restricted to mutations with 20+ reads supporting the alternate allele. Error bars are 95% Poisson exact confidence intervals; P-values from two-sided Poisson tests. c, Comparison of frameshift indel homopolymer hotspots detected among indels supported by a minimum of 20 alt-reads (Y-axis) to those with a minimum support of 5 alt-reads (X-axis). d, Percentage of cases per cancer type with truncating frameshift indels at any of 6 indel hotspot loci. Plotted cancer types had ≥ 20 well-covered samples (n=4,432 paired tumor and matched-normal samples total). Bar height indicates the fraction of samples with any indels at homopolymer hotspot out of the total number of well-covered samples for the given cancer type; numbers above bars indicate the total number of cases. e, Validation of homopolymeric indel hotspot loci. The proportion of samples in TCGA (X-axis) or PCAWG (excluding samples also in TCGA, Y-axis) with frameshift indels at 73 homopolymeric regions. The 6 indel hotspot loci are colored red and labeled. y=x is shown as a dashed line. Pearson correlation coefficient r as indicated. f, Breakdown of homopolymer loci and their hotspot incidence rates by mitochondrial complex. Heatmap tile shading indicates overall mutation rate (total number of mutants across homopolymer loci divided by the total number of samples with sufficient sequencing coverage). Fractions in tile labels are the number of homopolymer hotspots divided by the total number of homopolymer loci. Right, histogram of the total number of loci with each homopolymer length. g, The percentage of all truncating variants which arose at 6 homopolymer hotspot loci in TCGA tumor samples and in saliva-derived normal samples from HelixMTdb. Error bars are 95% binomial confidence intervals.
Extended Data Fig. 6 ∣
Extended Data Fig. 6 ∣. Homopolymer hotspots for frameshift indels in TCGA and MSK-IMPACT cohorts.
a, Analysis of 73 homopolymer loci for enrichment of protein-truncating indels in TCGA samples in shown on X-axis, and in MSK-IMPACT samples on Y-axis. 5 out of 6 originally reported hotspot loci are enriched in both TCGA and MSK-IMPACT (green), while 1 was only enriched in TCGA samples (orange). Two additional candidate hotspot loci are unique to the MSK-IMPACT dataset (recurrently observed in TCGA, but not reaching statistical significance). b, Heatmap indicates the proportion of truncating indels at each of the 8 homopolymer hotspots to affect samples of different cancer types (that is rows are proportion of samples with indels at a given homopolymer summing to 1; clustered by hierarchical clustering). Right, histogram of the total number of affected samples in TCGA and MSK-IMPACT data. Note that the CIV hotspot discovered in MSK-IMPACT data preferentially arises in lung and prostate cancers.
Extended Data Fig. 7 ∣
Extended Data Fig. 7 ∣. Validation of VUS pathogenicity and tRNA mutation recurrence.
a, VUSs only observed in tumors are more likely to be pathogenic. Bars compare the clinical significance (annotated by ClinVar) of SNVs observed somatically in tumors but never in patients’ matched-normal samples against SNVs never observed in either tumor or matched-normal samples. P-value from a two-sided Cochran-Armitage trend test. b, Validation of tRNA structural hotspots in PCAWG. The number of samples with SNVs in tRNAs at the indicated cloverleaf structural position, bottom; top, the statistical enriched of the given position for mutations. Position 31 Q-value=0.014, n=196 tRNA mutations among 1,951 PCAWG samples.
Extended Data Fig. 8 ∣
Extended Data Fig. 8 ∣. mtDNA mutations produce transcriptional phenotypes.
a,b, Transcriptional dysregulation attributed to truncating (a) and VUS (b) mtDNA variants. Heatmaps shows directional significance of dysregulation of a given geneset in tumors with truncating or VUS mtDNA variants among the given cancer type; −log10(Q-value) > 2 indicates significant up-regulation in mutated compared to wild-type samples, < −2 indicates significant down-regulation. Histograms on the right show the number of wild-type samples and mutated samples used in calculating differentially expressed genes and dysregulated genesets. c, Difference in mtDNA mutation status between colorectal cancer consensus molecular subtypes. Left, the proportion of samples with wild-type mtDNA (that is no somatic mutations), VUS (any non-truncating) or truncating variants among colorectal tumors with each consensus molecular subtype (CMS) is shown. Right, histogram of the number of well-covered colorectal tumors. There was a statistically significant difference in mtDNA mutation status between different CMS classifications (P=0.03, Chi-squared test, n=415 samples total, error bars are 95% exact binomial confidence intervals).
Extended Data Fig. 9 ∣
Extended Data Fig. 9 ∣. mtDNA mutations are protective in colorectal cancer patients in the MSK-IMPACT cohort.
a, Multivariate survival analysis based on Cox proportional hazards regression demonstrating the effect of VUS or truncating mtDNA mutations (relative to wild-type) on colorectal cancer patient overall survival in the MSK-IMPACT cohort. b, Same as in (a) but treating VUS and truncating mtDNA mutations as a single class compared to wild-type. Error bars are 95% confidence intervals from Cox proportional-hazards regression, n=172 MSK-IMPACT patients.
Extended Data Fig. 10 ∣
Extended Data Fig. 10 ∣. Repurposing whole-exome and clinical sequencing data optimizes sample size at the expense of sensitivity for low-heteroplasmy variants.
a, The number of different classes of mtDNA variants detected from either repurposed TCGA samples using our approach, or using only whole-genome sequenced tumors from PCAWG, stratified by heteroplasmy < 30% or ≥ 30%. Labels above bars indicate the exact number. b, Comparison of the difference in gene expression between (1) high-heteroplasmy truncating mutations and wild-type tumors (X-axis) and (2) low-heteroplasmy truncating mutations and wild-type tumors (Y-axis). c, Strengths and use-cases of three common tumor DNA sequencing modalities for mtDNA mutation analysis. WGS-based approaches are optimal for studying low-heteroplasmy variants and identifying structural variants and mtDNA copy number, while whole-exome and targeted gene-panel-based approaches optimize sample size, detection of recurrent variants, and clinical associations.
Fig. 1 ∣
Fig. 1 ∣. MtDNA mutations are among the most frequent genomic alterations in cancer.
a, Schematic of OXPHOS system and project workflow. Top row: CI–CV and their reactions; centre row: mtDNA genomic regions encoding protein subunits of the associated OXPHOS complex; bottom row: overview of project workflow, in which somatic mutations in mtDNA genes are used to explore intercomplex differences, mutational recurrence and transcriptional phenotype associated with mitochondrial dysfunction. b, Average number of tumours with sufficient coverage to call variants at a mtDNA position. Truncating mutations were assumed to be somatic and therefore allowed for tumour-only variant calling (dark blue), whereas non-truncating (protein-coding, non-truncating tRNA and rRNA mutations) required sufficient coverage in both tumour and matched-normal samples (light blue). Grey shows the number of WGS samples from PCAWG for comparison. c, The percentages of variants called from off-target reads, which were validated in either RNA-seq or WGS data from the same tumours. d, The correlation between variant heteroplasmy as observed in RNA- and DNA-seq (n = 2,575 mutations with coverage ≥30 reads in both DNA and RNA). e, The correlation between TMB (mutations per Mb) among mtDNA (y axis) and nuclear-encoded, cancer-associated genes (referred to simply as cancer genes; x axis), (n = 3,624 well-covered pan-cancer tumours). f, Mutation rates (mutations per Mb) of individual mtDNA-encoded genes (blue) and nuclear-encoded, cancer-associated genes (grey). Inset plot: mutation rates among 504 genes with mtDNA genes highlighted. Outer plot: close-up of the inset plot in the region containing all 37 mtDNA genes; commonly mutated nuclear cancer genes in this region are labelled for reference. g, Comparison of truncating mutation rates (truncating variants per Mb) between 13 mtDNA-encoded protein-coding genes and 185 nuclear-encoded TSGs. The P value was from a two-sided, Wilcoxon’s rank-sum test. h, Same as in g but comparing non-truncating mutation rate (non-synonymous, non-truncating variants per Mb) between 13 mtDNA protein-coding genes and 168 nuclear oncogenes. i, Percentage of patients with truncating mtDNA variants either somatically (in TCGA tumour samples) or germline (among ~200,000 normal samples). Error bars are 95% binomial CIs; the P value is from a two-sided, two-sample z-test.
Fig. 2 ∣
Fig. 2 ∣. Truncating variants preferentially target CI.
a, Comparison of truncating mutation rate (truncating variants per Mb) across OXPHOS complexes CI, CIII, CIV and CV. Synonymous mutation rates are shown below for comparison (truncating mutations, n = 352; synonymous mutations, n = 475). The P values are from two-sided Poisson’s exact test. *P < 0.1; **P < 0.01; NS, not significant. b, Validation of analysis in a using data from n = 1,951 WGS tumours from ICGC/PCAWG after removing samples that are also in TCGA (truncating mutations, n = 198; synonymous mutations, n = 263; P values as in a). c, Distributions of truncating and silent mutation heteroplasmy (estimated by VAF) among variants in OXPHOS CI, CIII, CIV or CV. The difference in heteroplasmy between truncating and silent mutations is calculated by two-sided Wilcoxon’s rank-sum test (CI, P = 1 × 10⁻⁶, not significant for other complexes). d, Percentage of tumours with truncating mtDNA variants per cancer type, among well-covered samples. Right: number of well-covered samples per cancer type. e, Percentage of samples per cancer type with truncating variants affecting OXPHOS CI or CIII–CV. The asterisk indicates cancer types with enriched truncating variants targeting CI compared with CIII–CV (Q < 0.01, two-sided McNemar’s test). f, Circular mtDNA genome annotated with 73 homopolymer repeat loci ≥5 bp in length. Dot height from the circular mtDNA genome indicates the number of affected samples, dot colour indicates the identity of the repeated nucleotide (A, C, G, T) and dot width indicates the length of the repeat region (5–8 bp). It includes putatively somatic truncating variants with tumour-only sequencing coverage. The six solid-colour homopolymer loci highlighted were found to be statistically enriched hotspots for frameshift indels in tumours. g, The 73 homopolymer repeat loci arranged by gene and repeat size. Dot width indicates −log10(Q value) for enriched frameshift indels in tumours. The six hotspot loci are labelled.
Fig. 3 ∣
Fig. 3 ∣. Non-truncating mtDNA mutations arise as rare recurrent alleles in protein-coding and RNA elements.
a, The proportion of truncating, synonymous and VUS somatic mtDNA mutations in the present study (VUSs further classified by gene type). b, The percentage of unique VUSs predicted to be pathogenic by APOGEE, among variants that: (1) were ever germline variants among ~200,000 normal samples from HelixMTdb; (2) were never observed somatically mutated in tumours; or (3) were observed only as somatic mutations (P values from two-sided, two-sample z-tests (top to bottom): 5 × 10⁻¹¹, 6 × 10⁻¹⁴, 3 × 10⁻⁵). c, Comparison of missense mutation rate across OXPHOS CI, CIII, CIV and CV (n = 1,718 missense mutations; P values from two-sided Poisson’s exact tests; *P < 0.1; **P < 0.01; NS, not significant). d, Validation of a among n = 1,951 WGS tumours from ICGC/PCAWG after removing samples also in TCGA (n = 1,073 missense mutations; P values and asterisks as in a). e, Top: number of samples with each unique mutation arising in three or more tumours. Bottom: variant consequence. f, Individual positions in mtDNA with SNVs in three or more tumours, and their enrichment (statistical test described in Methods). Positions with Q < 0.01 are coloured by gene type. g, The number of samples with SNVs at the equivalent position of the tRNA’s folded-cloverleaf structure across all tRNAs (left), and the position’s statistical enrichment (right; statistical test described in Methods). N/A, not available. h, Predicted pathogenicity (based on MitoTIP) of position 31 variants compared with all possible mutations at other positions (only 5% are shown to reduce image size). Variants affecting three or more tumours are highlighted (P value from a two-sided Wilcoxon’s rank-sum test calculated using all mutations). i, The structure of mammalian CI (grey) highlighting Mtnd1 (blue), and the ubiquinone-binding tunnel (green); the black box indicates a close-up region. Close-ups: the predicted surface electrostatic potential of Mtnd1 wild-type (top) and Arg25Gln mutant (bottom) samples, leading to its binding site at Ndufs2 Tyr108. j, Differentially expressed mSigDB Hallmark genesets between colorectal tumours with MT-ND1R25Q and those without non-silent somatic mtDNA variants (that is, wild-type (WT)). Normalized enrichment score and adjusted P values based on gene set enrichment analysis using the fgsea R package. IFN, interferon.
Fig. 4 ∣
Fig. 4 ∣. Mitochondrial genotypes associated with transcriptional and clinical phenotypes.
a, Percentage of well-covered tumours with different types of somatic mtDNA variants per cancer type. Right: number of well-covered samples per cancer type. NSC, non-small-cell cancer. b, Differential expression of mSigDB Hallmarks genesets, between samples with truncating mtDNA variants and those with no non-synonymous somatic mutations (that is, wild-type samples). Differential expression is quantified by directional −log10(Q value): >0 denotes upregulation in samples with truncating variants; <0 denotes downregulation. Each dot is a single cancer type’s level of dysregulation. Bars show the median level of dysregulation across 15 cancer types; bar shading shows the number of cancer types with significant dysregulation (Q < 0.01) in either direction. IFN, interferon; TGF, transforming growth factor. c, Differential expression of TNF-α via NFκB signalling (left) and OXPHOS (right) genesets in individual cancer types. The x axis: percentage of samples with truncating variants; y axis matches the y axis in b. Dot width denotes number of well-covered samples. d, Effect size and statistical significance of mtDNA truncating variants (left) and VUSs (right) on OS among individual cancer types. Effect sizes (quantified as log(hazard ratios)) are from univariate Cox proportional hazards models run for each cancer type independently. The Q values are adjusted P values from the model coefficients for each cancer type. e, Kaplan–Meier plot showing difference in OS among n = 344 TCGA colorectal cancer patients with somatic VUSs (n = 152), truncating variants (n = 84) or no non-synonymous mutations (that is, wild-type, n = 108). f, Multivariate analysis of the effect of mtDNA variants on OS among n = 344 TCGA colorectal cancer patients (stages 1–3). Truncating variants and VUSs are each compared with wild-type samples, while controlling for known prognostic clinical and genomic covariates using Cox proportional hazards model. Hazard ratios are shown on a log scale and error bars are 95% CIs from Cox proportional hazards regression. Point size indicates the number of samples with the associated covariate value (except for age, which was coded as a continuous variable, and therefore the size corresponds to the total number of samples). Blue points are statistically significant (P < 0.05); black points are not significant; grey points are reference categories. EMT, epithelial-to-mesenchymal transition.

References

    1. Hornshøj H et al. Pan-cancer screen for mutations in non-coding elements with conservation and cancer specificity reveals correlations with expression and survival. NPJ Genom. Med 3, 1 (2018). - PMC - PubMed
    1. Ju YS et al. Origins and functional consequences of somatic mitochondrial DNA mutations in human cancer. eLife 3, e02935 (2014). - PMC - PubMed
    1. Yuan Y et al. Comprehensive molecular characterization of mitochondrial genomes in human cancers. Nat. Genet 52, 342–352 (2020). - PMC - PubMed
    1. Stewart JB et al. Simultaneous DNA and RNA mapping of somatic mitochondrial mutations across diverse human cancers. PLoS Genet. 11, e1005333 (2015). - PMC - PubMed
    1. Grandhi S et al. Heteroplasmic shifts in tumor mitochondrial genomes reveal tissue-specific signals of relaxed and positive selection. Hum. Mol. Genet 26, 2912–2922 (2017). - PMC - PubMed

Publication types