

Chlorogenic Acid Inhibits Human Glioma U373 Cell Progression via Regulating the SRC/MAPKs Signal Pathway: Based on Network Pharmacology Analysis
- PMID: 33833498
- PMCID: PMC8020054
- DOI: 10.2147/DDDT.S296862
Chlorogenic Acid Inhibits Human Glioma U373 Cell Progression via Regulating the SRC/MAPKs Signal Pathway: Based on Network Pharmacology Analysis
Abstract
Introduction: Chlorogenic acid (CGA) is a type of polyphenolic substance that is widely extracted from many traditional Chinese medicines (eg, Lonicera japonica Thunb, Eucommia ulmoides Oliver) and exhibits a wide range of anti-tumor effects. However, the potential molecular mechanisms of CGA in glioma U373 cells remain unclear.
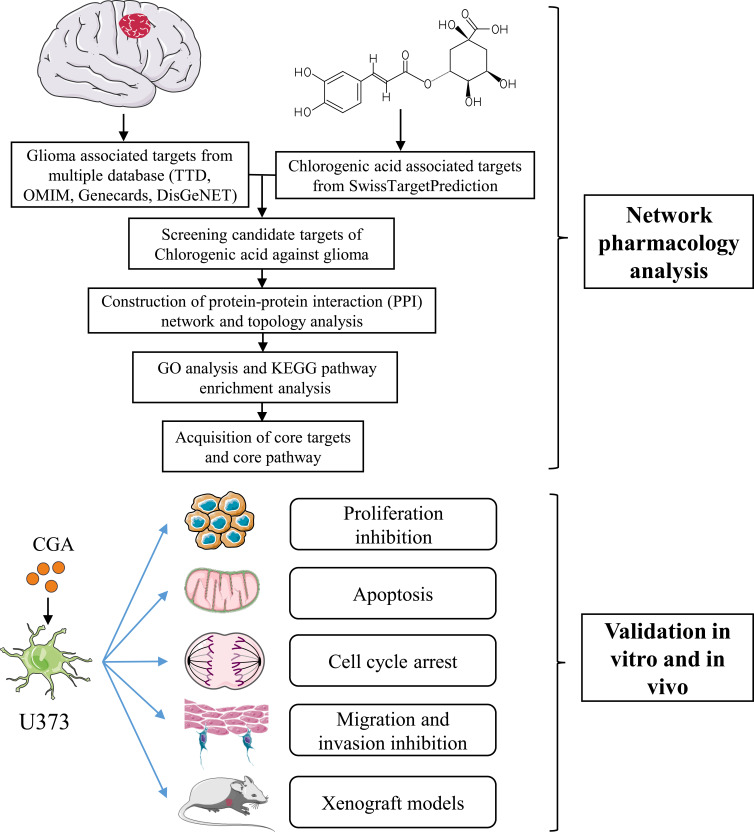
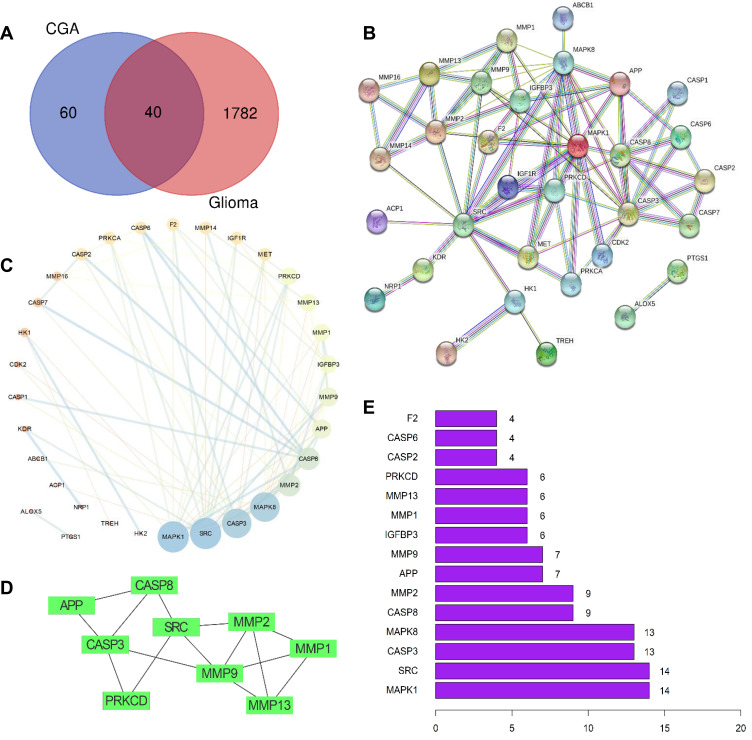
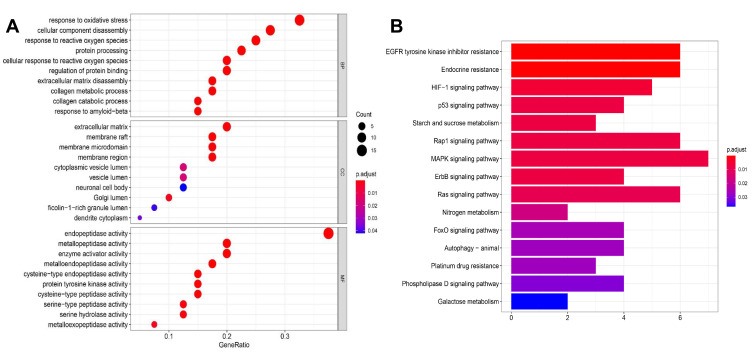
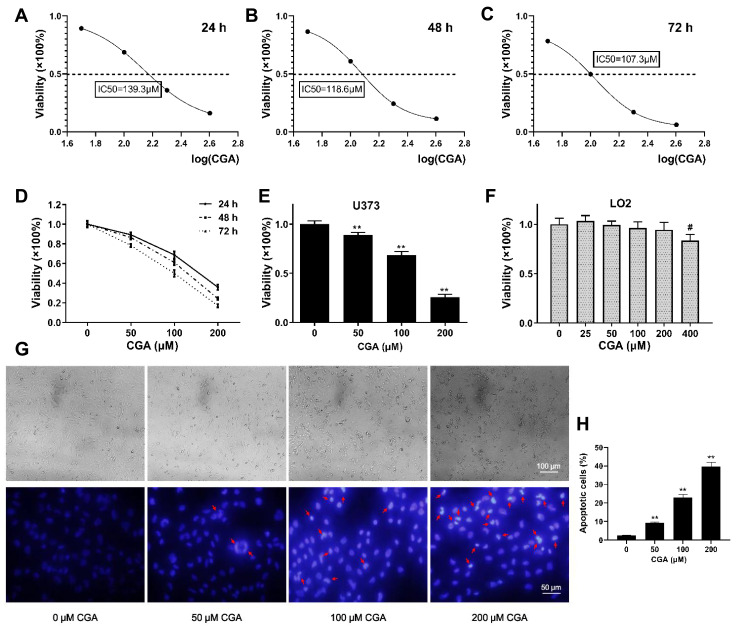
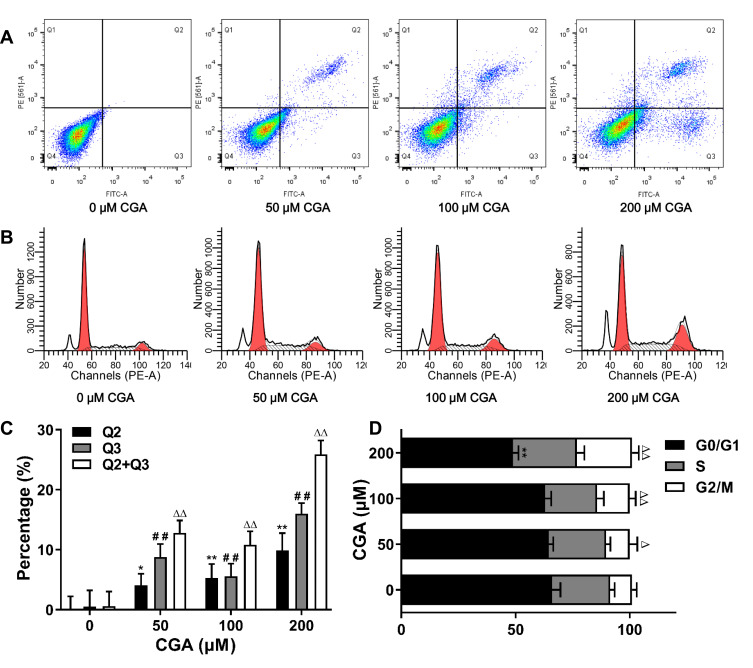
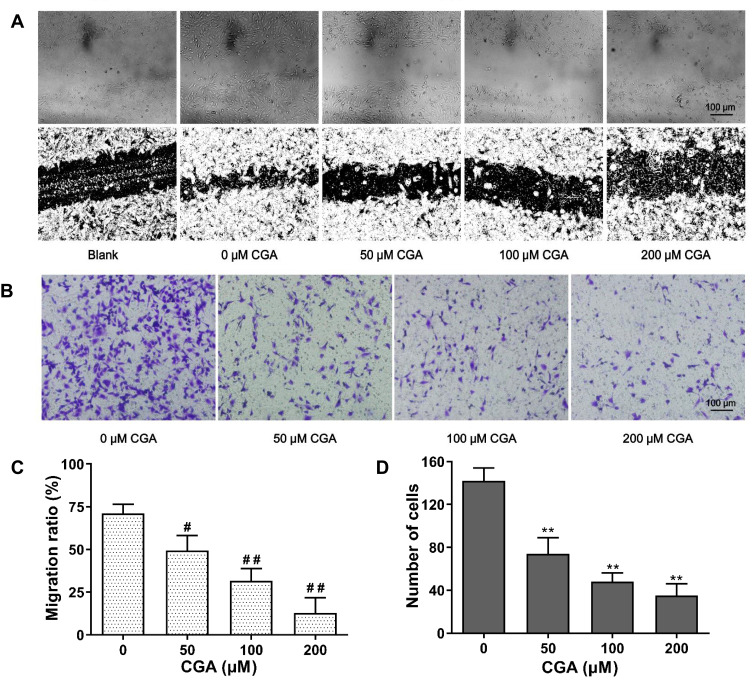
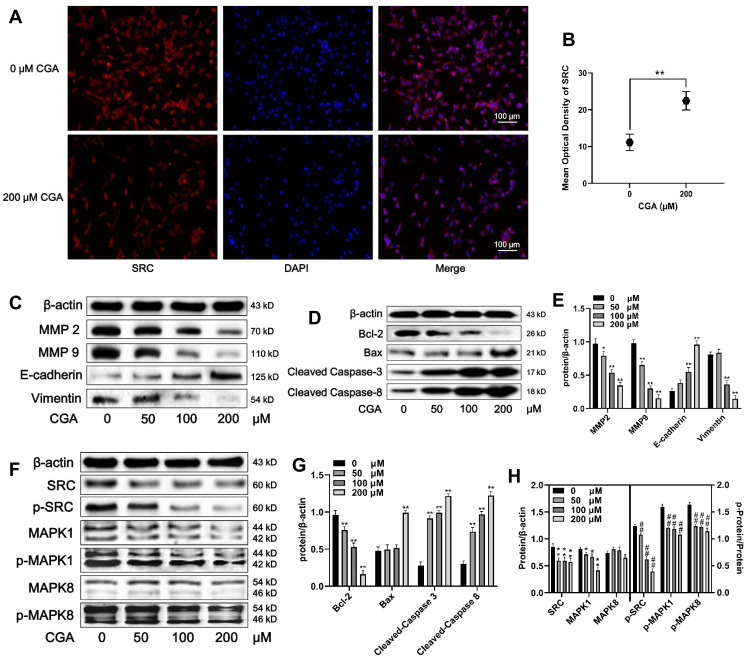
Methods: Network pharmacology analysis was used to explore the potential therapeutic targets of CGA in glioma. Human glioma U373 cells were treated with different concentrations of CGA for 24 h. CCK-8 assays were used to detect the inhibitory rate of cell growth. Annexin V-FITC/PI staining and Hoechst 33342 staining were used to detect apoptosis. PI staining was used to investigate cell-cycle progression. Wound healing assays and transwell assays were used to detect the cell migration and invasion, respectively. Western blotting and immunohistochemistry were used to measure protein levels in vitro and in vivo.
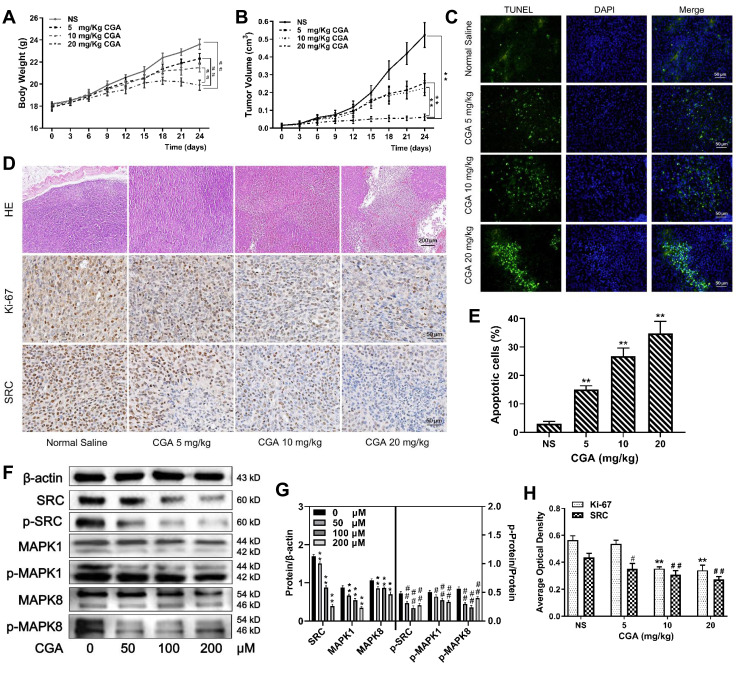
Results: The proliferation of U373 cells was significantly inhibited by CGA in a dose- and time-dependent manner. CGA significantly arrested the cell cycle of U373 cells in the G2/M phase and induced apoptosis. Moreover, CGA significantly suppressed the migration and invasion of U373 cells. Additionally, we found that CGA inhibited the growth of U373 cells in vivo. Furthermore, network pharmacology analysis suggested that the anti-tumor effects of CGA on U373 cells were associated with the down-regulation of the SRC/MAPKs signaling pathway.
Discussion: The present study indicated that CGA had anti-glioma effects on U373 cells by down-regulating SRC/MAPKs signal pathway.
Keywords: SRC/MAPKs signal pathway; apoptosis; chlorogenic acid; migration and invasion; network pharmacology.
© 2021 Zhou et al.
Conflict of interest statement
The authors declare no potential conflicts of interest.
Figures
Similar articles
-
Chlorogenic acid inhibits hypoxia-induced pulmonary artery smooth muscle cells proliferation via c-Src and Shc/Grb2/ERK2 signaling pathway.Eur J Pharmacol. 2015 Mar 15;751:81-8. doi: 10.1016/j.ejphar.2015.01.046. Epub 2015 Feb 7. Eur J Pharmacol. 2015. PMID: 25666384
-
Chlorogenic acid inhibits proliferation in human hepatoma cells by suppressing noncanonical NF-κB signaling pathway and triggering mitochondrial apoptosis.Mol Biol Rep. 2021 Mar;48(3):2351-2364. doi: 10.1007/s11033-021-06267-3. Epub 2021 Mar 18. Mol Biol Rep. 2021. PMID: 33738723
-
Root extract of Hemsleya amabilis Diels suppresses renal cell carcinoma cell growth through inducing apoptosis and G2/M phase arrest via PI3K/AKT signaling pathway.J Ethnopharmacol. 2024 Jan 10;318(Pt B):117014. doi: 10.1016/j.jep.2023.117014. Epub 2023 Aug 7. J Ethnopharmacol. 2024. PMID: 37557938
-
Chlorogenic acid induces apoptosis, inhibits metastasis and improves antitumor immunity in breast cancer via the NF‑κB signaling pathway.Oncol Rep. 2021 Feb;45(2):717-727. doi: 10.3892/or.2020.7891. Epub 2020 Dec 9. Oncol Rep. 2021. PMID: 33416150 Free PMC article.
-
Chlorogenic acid and intestinal health: mechanistic insights and therapeutic applications.Food Funct. 2025 Jun 3;16(11):4257-4277. doi: 10.1039/d5fo00853k. Food Funct. 2025. PMID: 40357998 Review.
Cited by
-
Network Pharmacology Study on the Mechanisms of Panax Notoginseng in the Treatment of Diabetic Retinopathy and Cataract.Appl Bionics Biomech. 2025 May 11;2025:6687606. doi: 10.1155/abb/6687606. eCollection 2025. Appl Bionics Biomech. 2025. PMID: 40391004 Free PMC article.
-
Chlorogenic Acid Alleviates the Inflammatory Stress of LPS-Induced BV2 Cell via Interacting with TLR4-Mediated Downstream Pathway.Comput Math Methods Med. 2022 May 18;2022:6282167. doi: 10.1155/2022/6282167. eCollection 2022. Comput Math Methods Med. 2022. Retraction in: Comput Math Methods Med. 2022 Dec 4;2022:9860352. doi: 10.1155/2022/9860352. PMID: 35633920 Free PMC article. Retracted.
-
Optineurin restrains CCR7 degradation to guide type II collagen-stimulated dendritic cell migration in rheumatoid arthritis.Acta Pharm Sin B. 2025 Mar;15(3):1626-1642. doi: 10.1016/j.apsb.2025.02.004. Epub 2025 Feb 11. Acta Pharm Sin B. 2025. PMID: 40370566 Free PMC article.
-
Novel prognostic features and personalized treatment strategies for mitochondria-related genes in glioma patients.Front Endocrinol (Lausanne). 2023 Apr 5;14:1172182. doi: 10.3389/fendo.2023.1172182. eCollection 2023. Front Endocrinol (Lausanne). 2023. PMID: 37091853 Free PMC article.
-
Dietary Factors and Risk of Glioma in Adults: A Systematic Review and Dose-Response Meta-Analysis of Observational Studies.Front Nutr. 2022 Feb 14;9:834258. doi: 10.3389/fnut.2022.834258. eCollection 2022. Front Nutr. 2022. PMID: 35237646 Free PMC article.
References
MeSH terms
Substances
LinkOut - more resources
Full Text Sources
Other Literature Sources
Research Materials
Miscellaneous
