. 2021 Mar 31;24(1):24-31.
doi: 10.3831/KPI.2021.24.1.24.

Antioxidant, Cytotoxicity and Cytoprotective Potential of Extracts of Grewia Flava and Grewia Bicolor Berries

Affiliations

Antioxidant, Cytotoxicity and Cytoprotective Potential of Extracts of Grewia Flava and Grewia Bicolor Berries

Kabo Masisi et al. J Pharmacopuncture. .

Abstract

Objectives: Accumulation of cellular reactive oxygen species (ROS) leads to oxidative stress. Increased production of ROS, such as superoxide anion, or a deficiency in their clearance by antioxidant defences, mediates cellular pathology. Grewia Spp fruits are a source of bioactive compounds and have notable antioxidant activity. Although the antioxidant capacity of Grewia Spp has been studied, there is very limited evidence that links the antioxidant activities of Grewia bicolor and Grewia flava to the inhibition of free radical formation associated with damage in biological systems.

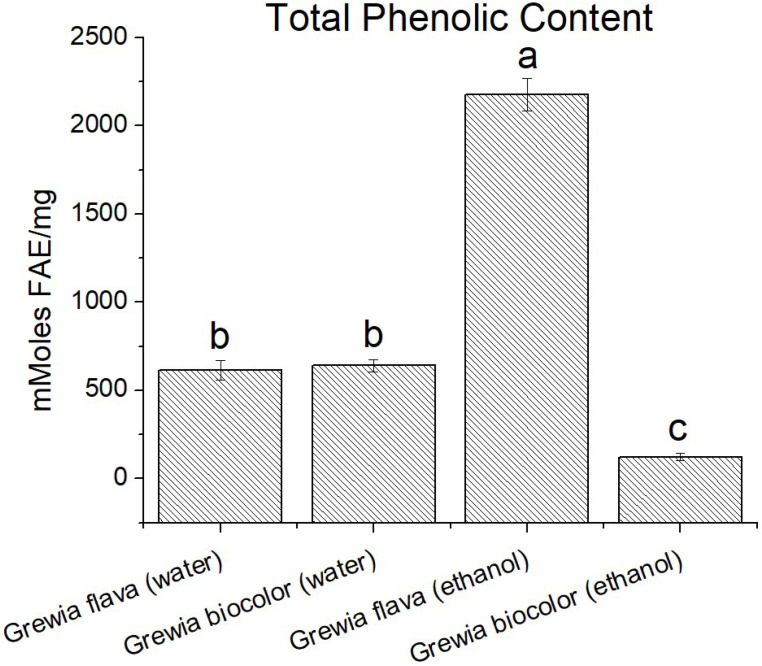
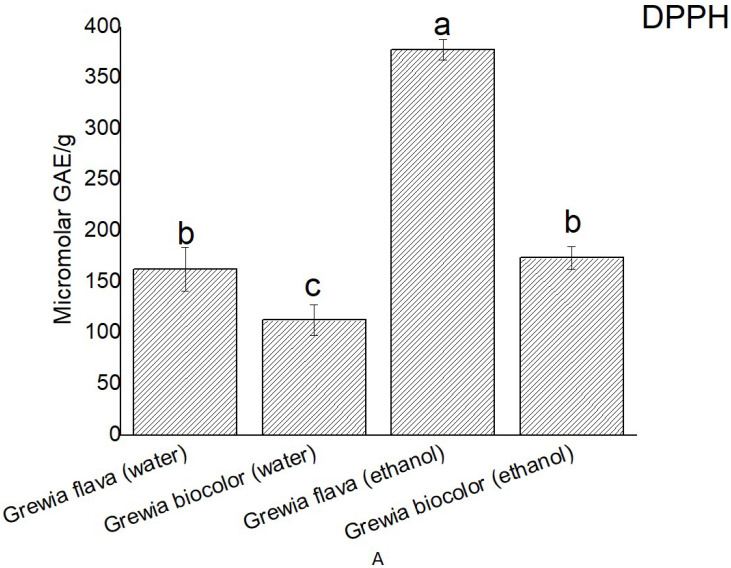
Methods: This study evaluated the protective effects of Grewia bicolor and Grewia flava extracts against free radical-induced oxidative stress and the resulting cytotoxicity effect using HeLa cells. Antioxidant properties determined using 2,2-diphenyl-1-picrylhydrazyl (DPPH) and total phenolic content (TPC) assays showed significantly higher (p < 0.05) antioxidant activity in Grewia flava (ethanol extract) than Grewia flava (water extract) and Grewia bicolor (ethanol and water extracts).

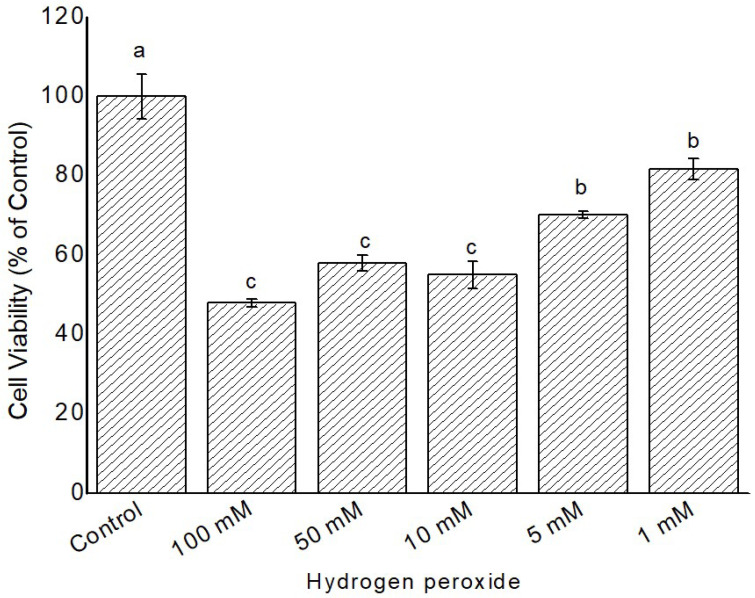
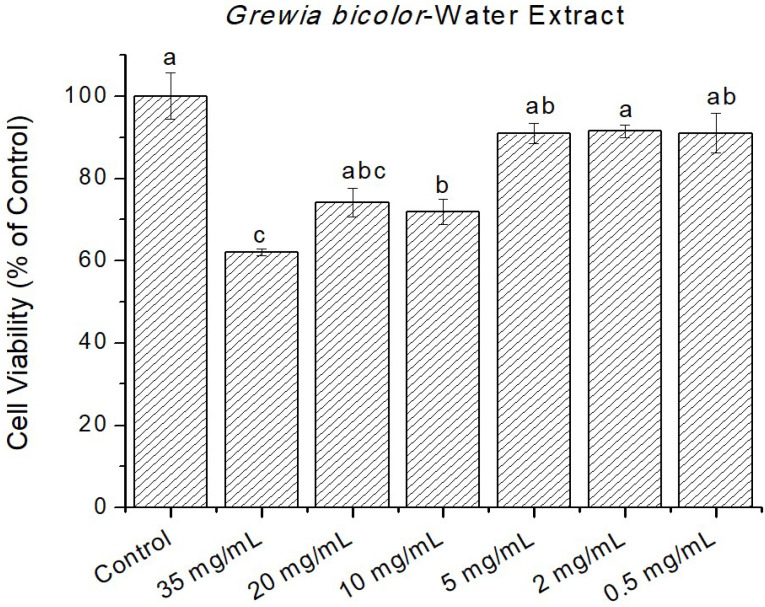
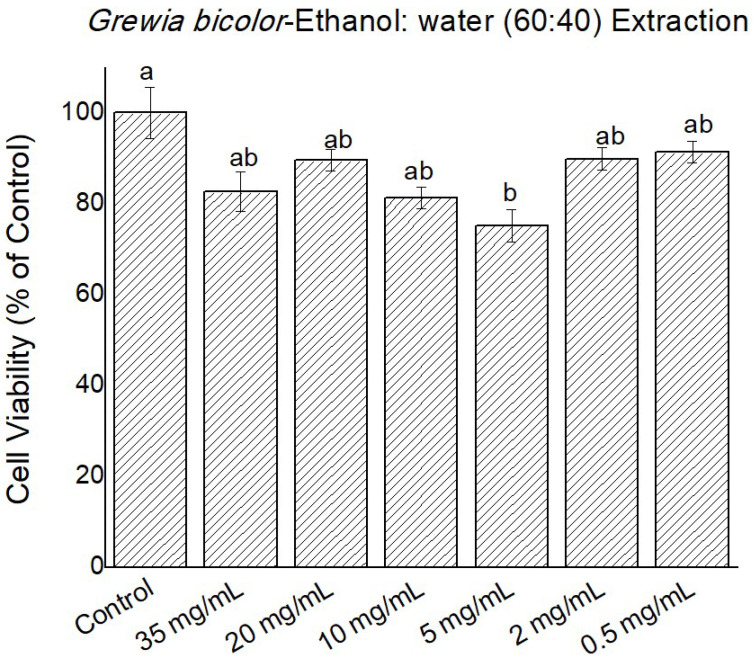
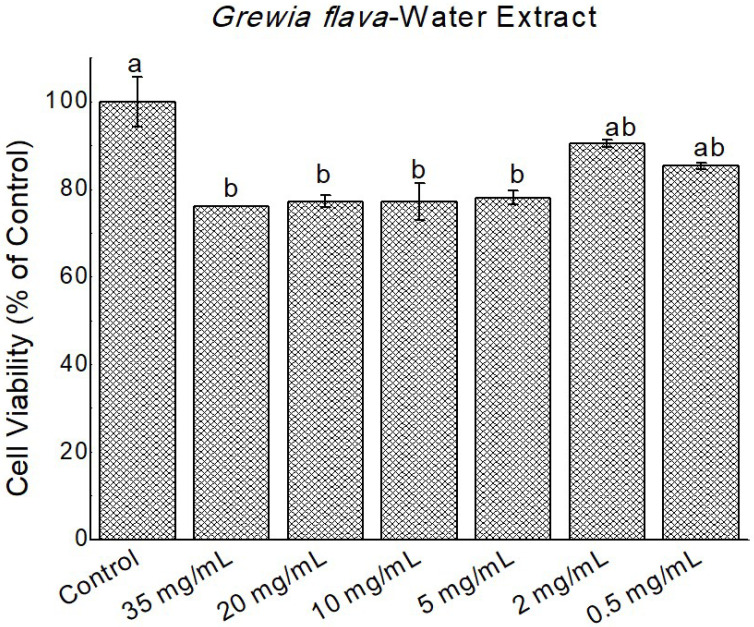
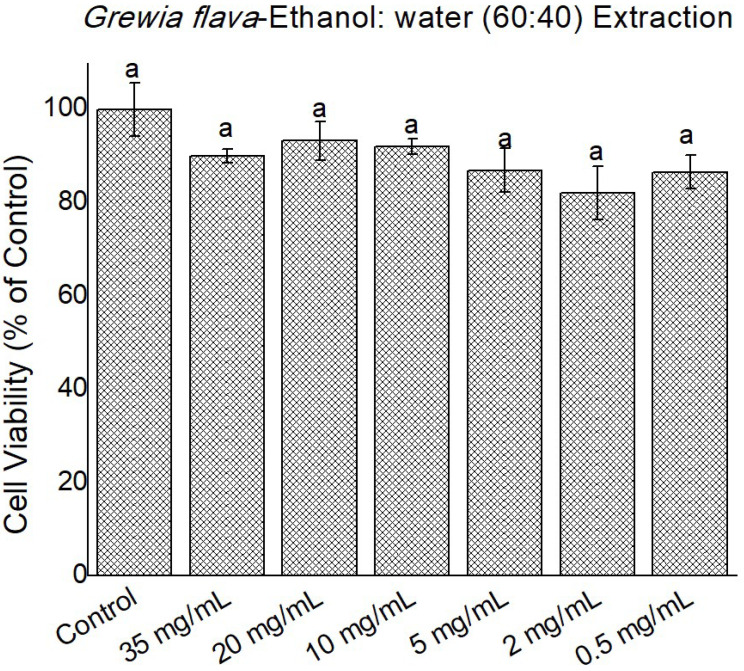
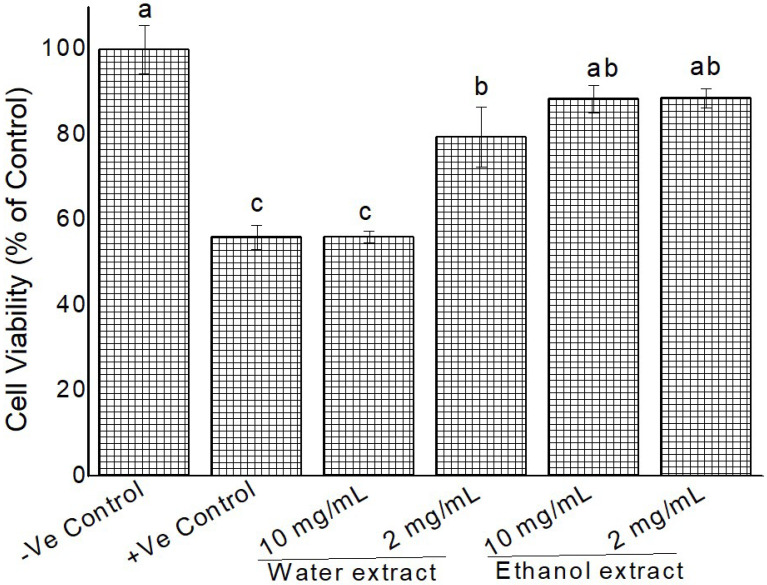
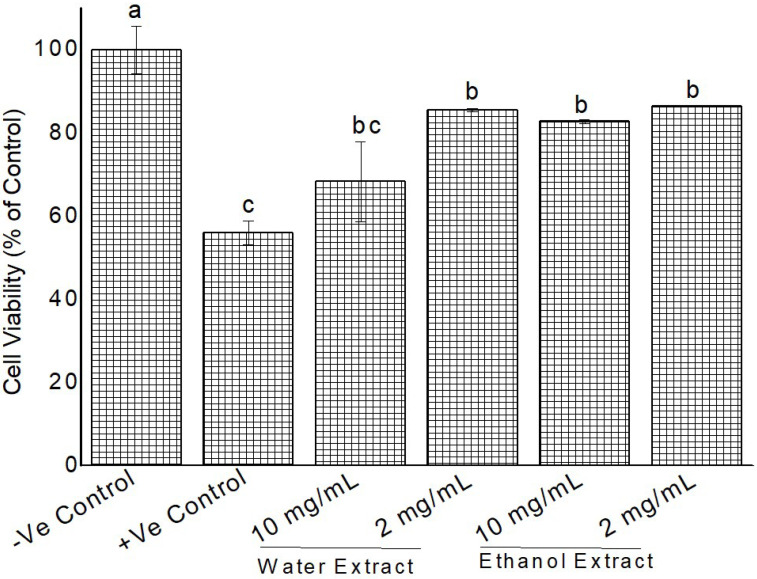
Results: Using 3-(4,5-dimethylthiazol-2-yl)-2,5diphenyltetrazolium bromide or MTT assay, cytotoxicity results showed that extracts of Grewia bicolor and Grewia flava were less toxic to HeLa cells at tested concentrations compared to the untreated control. This confirmed the low toxicity of these edible fruits at the tested concentrations in HeLa cells. Furthermore, hydrogen peroxide (H2O2)-induced cell loss was effectively reduced by pre-incubating HeLa cells with Grewia bicolor and Grewia flava extracts, with Grewia flava (ethanol extract) revealing better protection.

Conclusion: The effect was speculated to be associated with the higher antioxidant activity of Grewia flava (ethanol extract). Additional studies will warrant confirmation of the mechanism of action of such effects.

Keywords: antioxidant; cytoprotective; cytotoxicity; grewia bicolor; grewia flava; reactive oxygen species.


Conflict of interest statement

CONFLICTS OF INTEREST All authors declare no conflict of interest.

Figures

Figure 1
Figure 1
The total phenolic content (mM ferulic acid equivalent) per 0.7 g of wet samples of ethanolic extract and water extracts of Grewia flava and Grewia bicolor and standards by TPC method. Values are mean ± standard error (n = 3). Significant differences among the extracts are indicated by different letters (p < 0.05, Tukey-Kramer’s range test).
Figure 2
Figure 2
DPPH scavenging activity (μM gallic acid equivalent) per 0.7 g of wet samples of ethanolic extract and water extracts of Grewia flava and Grewia bicolor and standards by DPPH method. Values are mean ± standard error (n = 3). Significant differences among the extracts are indicated by different letters (p < 0.05, Tukey-Kramer’s range test).
Figure 3
Figure 3
Cytotoxicity induced by H2O2 at 1 to 100 mM in confluent HeLa cells was measured by MTT assay. Untreated cells at 100% cell viability were the control. Values are mean ± standard error (n = 3). Significant differences among the concentrations are indicated by different letters (p < 0.05, Tukey-Kramer’s range test).
Figure 4
Figure 4
Cytotoxicity of Grewia bicolor extracts (water extracts) at 0 to 35 mg/mL in confluent HeLa cells determined by MTT assay. Untreated cells at 100% cell viability were the control. Values are mean ± standard error (n = 3). Significant differences among the concentrations are indicated by different letters (p < 0.05, Tukey-Kramer’s range test).
Figure 5
Figure 5
Cytotoxicity of Grewia bicolor extracts (ethanol, 60: water, 40 extracts) at 0 to 35 mg/mL in confluent HeLa cells determined by MTT assay. Untreated cells at 100% cell viability were the control. Values are mean ± standard error (n = 3). Significant differences among the concentrations are indicated by different letters (p < 0.05, Tukey-Kramer’s range test).
Figure 6
Figure 6
Cytotoxicity of Grewia flava extracts (water extracts) at 0 to 35 mg/mL in confluent HeLa cells determined by MTT assay. Untreated cells at 100% cell viability were the control. Values are mean ± standard error (n = 3). Significant differences among the concentrations are indicated by different letters (p < 0.05, Tukey-Kramer’s range test).
Figure 7
Figure 7
Cytotoxicity of Grewia flava extracts (ethanol, 60: water, 40 extracts) at 0 to 35 mg/mL in confluent HeLa cells determined by MTT assay. Untreated cells at 100% cell viability were the control. Values are mean ± standard error (n = 3). Significant differences among the concentrations are indicated by different letters (p < 0.05, Tukey-Kramer’s range test).
Figure 8
Figure 8
Cytoprotective activity of Grewia bicolor extracts against H2O2 induced oxidation (100 mM) in confluent HeLa cells measured by MTT assay. Negative control were untreated cells at 100% cell viability and positive control was treated cells with 100 mM H2O2. Values are mean ± standard error (n = 3). Significant differences among the concentrations are indicated by different letters (p < 0.05, Tukey-Kramer’s range test).
Figure 9
Figure 9
Cytoprotective activity of Grewia flava extracts against H2O2 induced oxidation (100 mM) in confluent HeLa cells measured by MTT assay. Negative control were untreated cells at 100% cell viability and positive control was treated cells with 100 mM H2O2. Values are mean ± standard error (n = 3). Significant differences among the concentrations are indicated by different letters (p < 0.05, Tukey-Kramer’s range test).

Similar articles

Cited by

References

    1. Hayakawa M, Kuzuya F. [Free radicals and diabetes mellitus] Nihon Ronen Igakkai Zasshi. 1990;27(2):149–54. Japanese. - PubMed
    1. Meydani M, Lipman RD, Han SN, Wu D, Beharka A, Martin KR, et al. The effect of long-term dietary supplementation with antioxidants. Ann N Y Acad Sci. 1998;854(1):352–60. doi: 10.1111/j.1749-6632.1998.tb09915.x. - DOI - PubMed
    1. Simonian NA, Coyle JT. Oxidative stress in neurodegenerative diseases. Annu Rev Pharmacol Toxicol. 1996;36:83–106. doi: 10.1146/annurev.pa.36.040196.000503. - DOI - PubMed
    1. Halliwell B, Gutteridge JM. The definition and measurement of antioxidants in biological systems. Free Radic Biol Med. 1995;18(1):125–6. doi: 10.1016/0891-5849(95)91457-3. - DOI - PubMed
    1. Wang SY, Jiao H. Scavenging capacity of berry crops on superoxide radicals, hydrogen peroxide, hydroxyl radicals, and singlet oxygen. J Agric Food Chem. 2000;48(11):5677–84. doi: 10.1021/jf000766i. - DOI - PubMed

LinkOut - more resources