. 2021 Feb 17;10(1):1056.
doi: 10.4102/ajlm.v10i1.1056. eCollection 2021.

Performance of International AIDS Vaccine Initiative African clinical research laboratories in standardised ELISpot and peripheral blood mononuclear cell processing in support of HIV vaccine clinical trials

Affiliations

Performance of International AIDS Vaccine Initiative African clinical research laboratories in standardised ELISpot and peripheral blood mononuclear cell processing in support of HIV vaccine clinical trials

Robert K Langat et al. Afr J Lab Med. .

Abstract

Background: Standardisation of procedures for performing cellular functional assays across laboratories participating in multicentre clinical trials is key for generating comparable and reliable data.

Objective: This article describes the performance of accredited laboratories in Africa and Europe on testing done in support of clinical trials.

Methods: For enzyme-linked immunospot assay (ELISpot) proficiency, characterised peripheral blood mononuclear cells (PBMCs) obtained from 48 HIV-negative blood donors in Johannesburg, South Africa, were sent to participating laboratories between February 2010 and February 2014. The PBMCs were tested for responses against cytomegalovirus, Epstein Barr and influenza peptide pools in a total of 1751 assays. In a separate study, a total of 1297 PBMC samples isolated from healthy HIV-negative participants in clinical trials of two prophylactic HIV vaccine candidates in Kenya, Uganda, Rwanda and Zambia were analysed for cell viability, cell yield and cell recovery from frozen PBMCs.

Results: Most (99%) of the 1751 ELISpot proficiency assays had data within acceptable ranges with low responses to mock stimuli. No significant statistical difference were observed in ELISpot responses at the five laboratories actively conducting immunological analyses. Of the 1297 clinical trial PBMCs processed, 94% had cell viability above 90% and 96% had cell yield above 0.7 million per mL of blood in freshly isolated cells. All parameters were within the predefined acceptance criteria.

Conclusion: We demonstrate that multiple laboratories can generate reliable, accurate and comparable data by using standardised procedures, having regular training, having regular equipment maintenance and using centrally sourced reagents.

Keywords: ELISpot; PBMC processing; clinical trials; good clinical laboratory practice; peripheral blood mononuclear cells; proficiency testing.


Conflict of interest statement

The authors have declared that no competing interests exist.

Figures

FIGURE 1
FIGURE 1
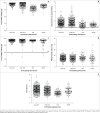
Distribution of ELISpot responses across laboratories in Kenya, Uganda, Rwanda, Zambia, South Africa and the United Kingdom, 2010–2014. Responses against mock, cytomegalovirus and cytomegalovirus, Epstein-Barr virus, and influenza virus stimuli from a panel of six peripheral blood mononuclear cells tested over 6 months, (a) first 24 months and (b) second 24 months. Box plots represent the quartiles, horizontal line the median and whiskers the maximum and minimum values. Each point represents average spot-forming cells per 106 peripheral blood mononuclear cells from replicates per donor at each laboratory. The laboratories are color-coded as follows: Kenya AIDS Vaccine Initiative-Institute of Clinical Research (red); Uganda Virus Research Institute (blue); Projet San Francisco (green); Zambia EMORY HIV Research Project (purple); Kenya Medical Research Institute Centre for Geographical Medicine Research Coast (yellow); Clinical Laboratory Services (cyan); Human Immunology Laboratory (black).
FIGURE 1
FIGURE 1
Distribution of ELISpot responses across laboratories in Kenya, Uganda, Rwanda, Zambia, South Africa and the United Kingdom, 2010–2014. Responses against mock, cytomegalovirus and cytomegalovirus, Epstein-Barr virus, and influenza virus stimuli from a panel of six peripheral blood mononuclear cells tested over 6 months, (a) first 24 months and (b) second 24 months. Box plots represent the quartiles, horizontal line the median and whiskers the maximum and minimum values. Each point represents average spot-forming cells per 106 peripheral blood mononuclear cells from replicates per donor at each laboratory. The laboratories are color-coded as follows: Kenya AIDS Vaccine Initiative-Institute of Clinical Research (red); Uganda Virus Research Institute (blue); Projet San Francisco (green); Zambia EMORY HIV Research Project (purple); Kenya Medical Research Institute Centre for Geographical Medicine Research Coast (yellow); Clinical Laboratory Services (cyan); Human Immunology Laboratory (black).
FIGURE 2
FIGURE 2
Comparison of ELISpot responses across laboratories in Kenya, Uganda, Rwanda, Zambia, South Africa and the United Kingdom, 2010–2014. The graphs show which site pairs are significantly different (blue lines) and which are not (red lines). For each comparison, a line segment, centred at the least-squares-means in the pair, is drawn. The segment length corresponds to the projected width of a confidence interval for the least-squares mean difference. Each line corresponds to the pair of labs with reference lines that cross at the midpoint. Shown here are the pair-wise least-squares means and their statistical significance, on a natural log scale, for mock, cytomegalovirus, Epstein-Barr virus, and influenza virus and cytomegalovirus stimuli. Differences for alpha = 0.05 (Bonferroni Adjustment); Red line denotes not significant while blue line denotes significant. (a) Mock, (b) cytomegalovirus, Epstein-Barr virus, and influenza virus and (c) Cytomegalovirus.
FIGURE 3
FIGURE 3
Comparison of inter-operator ELISpot responses from three operators at Kenya AIDS Vaccine Initiative-Institute of Clinical Research, Kenya, 2010–2014. The graphs show which operators are significantly different (blue lines) and which are not (red lines). Shown here are the pair-wise least-squares means and their statistical significance, on a natural log scale, for mock, cytomegalovirus, Epstein-Barr virus, and influenza virus and cytomegalovirus stimuli. For each comparison, a line segment, centred at the least-squares means in the pair, is drawn. The length of the segment corresponds to the projected width of a confidence interval for the least-squares mean difference. Segments that fail to cross the 45° reference line correspond to significant least-squares mean differences. None of the pairs of operators is significantly different (all lines cross the 45° reference line). Differences for alpha = 0.05 (Bonferroni Adjustment); Red line denotes not significant while blue line denotes significant. (a) Mock, (b) cytomegalovirus, Epstein-Barr virus, and influenza virus and (c) Cytomegalovirus.
FIGURE 4
FIGURE 4
Performance of laboratories in peripheral blood mononuclear cell (PBMC) processing, Kenya, Uganda, Rwanda, Zambia, 2010–2014. (a) The percentage cell viability of freshly isolated PBMC, (b) cell yield per mL of blood, (c) percentage cell viability from frozen PBMCs, (d) cell recovery of frozen PBMC (PBMCs were cryopreserved at a final concentration of 10–15 m cells per mL; here data were normalised to 10 m cells), and (e) duration of PBMC processing (in hours). Each dot represents a sample and the horizontal line represents the median with interquartile range. The long horizontal line shows the acceptance cut-off.

References

    1. Gilmour JW, Stevens WS, Gray C, De Souza M. Laboratory expansion to large-scale international HIV preventive vaccine trials. Curr Opin HIV AIDS. 2007;2(3):201–206. 10.1097/COH.0b013e3280eec77a - DOI - PubMed
    1. Kublin JG, Morgan CA, Day TA, et al. . HIV vaccine trials network: Activities and achievements of the first decade and beyond. Clin Investig. 2012;2(3):245–254. 10.4155/cli.12.8 - DOI - PMC - PubMed
    1. Muyanja E, Ssemaganda A, Ngauv P, et al. . Immune activation alters cellular and humoral responses to yellow fever 17D vaccine. J Clin Investig. 2014;124(7):3147–3158. 10.1172/JCI75429 - DOI - PMC - PubMed
    1. Schmidt C, Jaoko W, Omosa-Manyonyi G, et al. . Long-term follow-up of study participants from prophylactic HIV vaccine clinical trials in Africa. Hum Vaccines Immunother. 2014;10(3):714–723. 10.4161/hv.27559 - DOI - PMC - PubMed
    1. Mwangoka G, Ogutu B, Msambichaka B, et al. . Experience and challenges from clinical trials with malaria vaccines in Africa. Malar J. 2013;12(1):86. 10.1186/1475-2875-12-86 - DOI - PMC - PubMed

LinkOut - more resources