. 2021 Mar 23:11:620688.
doi: 10.3389/fonc.2021.620688. eCollection 2021.

Immunosuppressive Microenvironment Revealed by Immune Cell Landscape in Pre-metastatic Liver of Colorectal Cancer

Affiliations

Immunosuppressive Microenvironment Revealed by Immune Cell Landscape in Pre-metastatic Liver of Colorectal Cancer

Dongqiang Zeng et al. Front Oncol. .

Abstract

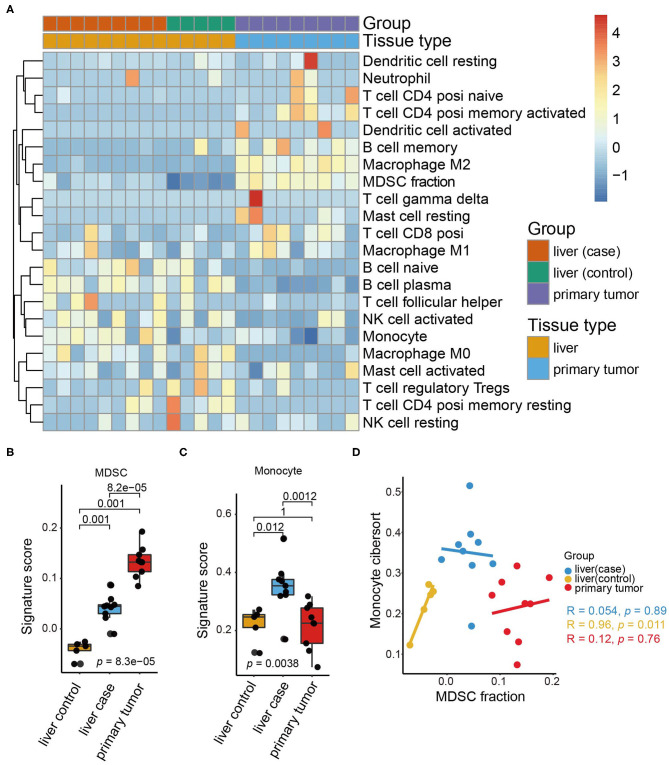
Background: Colorectal cancer, the fourth leading cause of cancer mortality, is prone to metastasis, especially to the liver. The pre-metastatic microenvironment comprising various resident stromal cells and immune cells is essential for metastasis. However, how the dynamic evolution of immune components facilitates pre-metastatic niche formation remains unclear. Methods: Utilizing RNA-seq data from our orthotopic colorectal cancer mouse model, we applied single sample gene set enrichment analysis and Cell type Identification By Estimating Relative Subsets Of RNA Transcripts to investigate the tumor microenvironment landscape of pre-metastatic liver, and define the exact role of myeloid-derived suppressor cells (MDSCs) acting in the regulation of infiltrating immune cells and gene pathways activation. Flow cytometry analysis was conducted to quantify the MDSCs levels in human and mice samples. Results: In the current work, based on the high-throughput transcriptome data, we depicted the immune cell infiltration pattern of pre-metastatic liver and highlighted MDSCs as the dominant altered cell type. Notably, flow cytometry analysis showed that high frequencies of MDSCs, was detected in the pre-metastatic liver of orthotopic colorectal cancer tumor-bearing mice, and in the peripheral blood of patients with stage I-III colorectal cancer. MDSCs accumulation in the liver drove immunosuppressive factors secretion and immune checkpoint score upregulation, consequently shaping the pre-metastatic niche with sustained immune suppression. Metabolic reprogramming such as upregulated glycolysis/gluconeogenesis and HIF-1 signaling pathways in the primary tumor was also demonstrated to correlate with MDSCs infiltration in the pre-metastatic liver. Some chemokines were identified as a potential mechanism for MDSCs recruitment. Conclusion: Collectively, our study elucidates the alterations of MDSCs during pre-metastatic niche transformation, and illuminates the latent biological mechanism by which primary tumors impact MDSC aggregation in the targeted liver.

Keywords: MDSC; colorectal cancer; immunosuppressive microenvironment; metabolism; pre-metastatic niche.


Conflict of interest statement

The authors declare that the research was conducted in the absence of any commercial or financial relationships that could be construed as a potential conflict of interest.

Figures

Figure 1
Figure 1
Immune cell landscape of pre-metastatic liver in the orthotopic CRC mouse model. (A) The expression of immune cells in our orthotopic colorectal mice models as quantified by CIBERSORT and shown by a heatmap. The tissue group and tissue type are shown as annotations. (B) The MDSC signature scores in the liver (control), liver (case), and primary tumor (case). The scattered dots represent the values of different samples. The thick line represents the median value, and the bottom line and top line of the boxes indicate the 25 and 75% values. The statistical difference between tissue groups was compared through the Kruskal–Wallis test. P-values are shown. (C) Monocyte signature scores in the liver (control), liver (case), and primary tumor. The statistical difference of tissue groups was compared through the Kruskal–Wallis test. P-values are shown. (D) Scatter plots depicting the correlation between the MDSC signature and monocyte signature of the liver (control), liver (case), and primary tumor, respectively. The colored dots represent the tissue groups (liver (control): yellow; liver (case): blue; primary tumor: red). Spearman correlation between the MDSC signature and monocyte signature is shown (liver (control): p = 0.011; liver (case): p = 0.89; primary tumor: p = 0.76).
Figure 2
Figure 2
MDSCs accumulation may facilitate tumor metastasis with an immunosuppressive microenvironment. (A) Immune checkpoint scores in the liver (control), liver (case), and primary tumor (case). The statistical difference among tissue groups was compared by the Kruskal–Wallis test. P-values are shown. (B) Heatmap showing the expression profiles of immune checkpoint genes and immunosuppressive genes in the liver (control) and liver (case). (C) Expression of immunosuppressive genes in the liver (control) and liver (case). Yellow and blue represent the liver (case) and liver (control), respectively. The statistical differences between the liver (control) and liver (case) were compared by the Wilcoxon test. The box plots represent the median value and interquartile range. P-values are indicated. (D) Comparisons of the predictive accuracy of the MDSC fraction, CD8+ T cell fraction and GEP in the GSE91061 cohort. (E) Comparisons of the predictive accuracy of the MDSC fraction, CD8+ T cell fraction and GEP in the GSE123728 cohort.
Figure 3
Figure 3
MDSCs accumulated in the pre-metastatic liver in an orthotopic CRC mouse model. (A) The percentage of PMN-MDSCs and M-MDSCs in the liver, bone marrow, spleen, kidney, blood of tumor-bearing mice, and sham-operation mice by flow cytometric analysis. Mouse MDSCs are classified as PMN-MDSCs (CD11b+Ly6ClowLy6G+) and M-MDSCs (CD11b+Ly6ChighLy6G). Left figures represent the sham-operation group, and right figures represent the tumor-bearing group. n = 4 – 5 organ samples in each group. (B) Quantification of total MDSCs proportions from liver, bone marrow, spleen, kidney, blood in each treatment group. Total MDSCs are defined as the sum of PMN-MDSCs and M-MDSCs. The statistical differences between the sham-operation group and tumor-bearing group of each organ were compared by the Wilcoxon test. The box plots indicate the median value and interquartile range. *P < 0.05, ***P < 0.001, ns indicates no significance.
Figure 4
Figure 4
High MDSC infiltration indicated poor prognosis in CRC patients. (A) Representative Fluorescence activated Cell Sorting (FACs) plots showing the percentage of PMN-MDSCs and M-MDSCs in healthy volunteers and in patients with stage I–III colorectal cancer. The gating strategy of the human MDSCsubpopulation is based on CD14 and CD15 markers after the selection of CD11b and HLA-DR. (B) Quantification of total human MDSCs proportions in healthy volunteers and in patients with stage I-III colorectal cancer. Total MDSCs are defined as the sum of PMN-MDSCs and M-MDSCs. The statistical differences between healthy volunteers and stage I–III were compared by the Wilcoxon test. The box plots indicate the median value and interquartile range. P-values are shown. (C) Kaplan–Meier curves for high MDSC and low MDSC groups in the TCGA-COAD-READ cohort (p = 0.0087, Hazard Ratio = 1.74, 95% CI: 1.15 – 2.64).
Figure 5
Figure 5
The primary tumor induced MDSC accumulation in the distant liver via metabolic reprogramming and chemotactic mechanisms. (A) KEGG enrichment analysis of genes correlated with MDSCs. The size of the circles represents the number of genes from each KEGG pathway. (B) The network showing the genes and their corresponding KEGG terms. (C) Correlation of the MDSC fraction from the pre-metastatic liver and hypoxia score of the primary tumor (Spearman test, p = 0.011, r = 0.817). (D) Correlation of the MDSC fraction in the metastatic liver and hypoxia score of the primary tumor in GSE49355 dataset (Spearman, p = 0.012, r = 0.681). (E) Correlation of the MDSC fraction in the metastatic liver and hypoxia score of the primary tumor in GSE14297 dataset (Spearman, p = 0.056, r = 0.459). (F) The expression of chemokines related to MDSCs in the liver (control) and liver (case). Yellow and blue represent the liver (case) and liver (control), respectively. Statistical differences between the liver (control) and liver (case) were compared by the Wilcoxon test. Box plots represent the median value and interquartile range. P-values are indicated. (G) The relationship between fraction of MDSC in pre-metastatic liver and chemokines (Ccl28) and HIF1 pathway genes (Pgk1 and Pfkl) in primary tumor of mouse model (Spearman, Ccl28: r = 0.9, p = 2.0e−03; Pgk1: r = 0.97, p = 1.7e−04; Pfkl: r = 0.93, p = 7.5e−04).

Similar articles

Cited by

References

    1. Jemal A, Siegel R, Ward E, Hao Y, Xu J, Murray T, et al. . Cancer statistics, 2008. CA. (2008) 58:71–96. 10.3322/CA.2007.0010 - DOI - PubMed
    1. Jones RP, Kokudo N, Folprecht G, Mise Y, Unno M, Malik HZ, et al. . Colorectal liver metastases: a critical review of state of the art. Liver Cancer. (2016) 6:66–71. 10.1159/000449348 - DOI - PMC - PubMed
    1. Doglioni G, Parik S, Fendt S-M. Interactions in the (Pre)metastatic niche support metastasis formation. Front Oncol. (2019) 9:219. 10.3389/fonc.2019.00219 - DOI - PMC - PubMed
    1. Guo Y, Ji X, Liu J, Fan D, Zhou Q, Chen C, et al. . Effects of exosomes on pre-metastatic niche formation in tumors. Mol Cancer. (2019) 18:39. 10.1186/s12943-019-0995-1 - DOI - PMC - PubMed
    1. Peinado H, Zhang H, Matei IR, Costa-Silva B, Hoshino A, Rodrigues G, et al. . Pre-metastatic niches: organ-specific homes for metastases. Nat Rev Cancer. (2017) 17:302–17. 10.1038/nrc.2017.6 - DOI - PubMed