Peptidoglycan Recognition Peptide 2 Aggravates Weight Loss in a Murine Model of Chemotherapy-Induced Gastrointestinal Toxicity
- PMID: 33833993
- PMCID: PMC8021894
- DOI: 10.3389/fonc.2021.635005
Peptidoglycan Recognition Peptide 2 Aggravates Weight Loss in a Murine Model of Chemotherapy-Induced Gastrointestinal Toxicity
Abstract
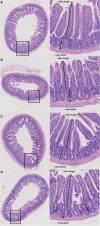
Introduction: Chemotherapy-induced gastrointestinal toxicity (CIGT) is a frequent, severe and dose-limiting side effect. Few treatments have proven effective for CIGT. CIGT is characterized by activation of the nuclear factor kappa B pathway which, leads to upregulation of proinflammatory cytokines. The innate immune protein peptidoglycan recognition peptide 2 (PGLYRP2) binds to and hydrolyzes microbial peptidoglycan. Expression of PGLYRP2 is upregulated in the intestine of chemotherapy-treated piglets. In this experimental study, we investigated the role of Pglyrp2 in the development and severity of murine CIGT. Methods: Pglyrp2 wildtype and Pglyrp2 knockout mice received intraperitoneal injections of chemotherapy (Doxorubicin 20 mg/kg) to induce CIGT. Weight was monitored daily, and animals were euthanized after 2 or 7 days. Expression of proinflammatory cytokines in the jejunum was measured by quantitative real-time polymerase-chain reaction and enzyme-linked immunosorbent assay. Villus height, crypt depth, and histologic inflammation were evaluated on haematoxylin and eosin stained tissue specimens. Results: Chemotherapeutic treatment induced weight loss (p < 0.05), shortening of the small intestine (p < 0.05), elongation of villus height (p < 0.05), increased crypt depth (p < 0.05), and led to elevated mRNA levels of II1β (p < 0.05), II6 (p < 0.05), and Tnf (p < 0.001) at day 2. Protein levels of IL1β, IL6, and TNFα did not change after exposure to chemotherapy. Doxorubicin treated wildtype mice had a more pronounced weight loss compared to knockout mice from day 3 to day 7 (D3-D6: p < 0.05 and D7: p < 0.01). No other phenotypic differences were detected. Conclusion: Pglyrp2 aggravates chemotherapy-induced weight loss but does not induce a specific pattern of inflammation and morphological changes in the small intestine.
Keywords: chemotherapy; gastrointestinal mucositis; inflammation; mice; peptidoglycan recognition peptide 2.
Copyright © 2021 Bech, Nexoe, Dubik, Moeller, Soerensen, Holmskov, Madsen, Husby and Rathe.
Conflict of interest statement
The authors declare that the research was conducted in the absence of any commercial or financial relationships that could be construed as a potential conflict of interest.
Figures


Similar articles
-
FIBCD1 ameliorates weight loss in chemotherapy-induced murine mucositis.Support Care Cancer. 2021 May;29(5):2415-2421. doi: 10.1007/s00520-020-05762-w. Epub 2020 Sep 12. Support Care Cancer. 2021. PMID: 32918133
-
No effect of deleted in malignant brain tumors 1 deficiency on chemotherapy induced murine intestinal mucositis.Sci Rep. 2021 Jul 19;11(1):14687. doi: 10.1038/s41598-021-94076-w. Sci Rep. 2021. PMID: 34282203 Free PMC article.
-
Chemotherapy-induced gastrointestinal toxicity: Pathogenesis and current management.Biochem Pharmacol. 2023 Oct;216:115787. doi: 10.1016/j.bcp.2023.115787. Epub 2023 Sep 4. Biochem Pharmacol. 2023. PMID: 37666434 Review.
-
Predictive model for risk of severe gastrointestinal toxicity following chemotherapy using patient immune genetics and type of cancer: a pilot study.Support Care Cancer. 2015 May;23(5):1233-6. doi: 10.1007/s00520-014-2481-z. Epub 2014 Oct 16. Support Care Cancer. 2015. PMID: 25318697
-
The bidirectional interaction of the gut microbiome and the innate immune system: Implications for chemotherapy-induced gastrointestinal toxicity.Int J Cancer. 2019 May 15;144(10):2365-2376. doi: 10.1002/ijc.31836. Epub 2018 Oct 1. Int J Cancer. 2019. PMID: 30155890 Review.
Cited by
-
PET/CT imaging detects intestinal inflammation in a mouse model of doxorubicin-induced mucositis.Front Oncol. 2022 Dec 15;12:1061804. doi: 10.3389/fonc.2022.1061804. eCollection 2022. Front Oncol. 2022. PMID: 36591502 Free PMC article.
-
Identification of Protein Biomarkers of the Dietary Approaches to Stop Hypertension Diet in Randomized Feeding Studies and Validation in an Observational Study.J Am Heart Assoc. 2023 Apr 4;12(7):e028821. doi: 10.1161/JAHA.122.028821. Epub 2023 Mar 28. J Am Heart Assoc. 2023. PMID: 36974735 Free PMC article. Clinical Trial.
References
LinkOut - more resources
Full Text Sources
Other Literature Sources
Miscellaneous

