Tet1 Deficiency Leads to Premature Ovarian Failure
- PMID: 33834024
- PMCID: PMC8021788
- DOI: 10.3389/fcell.2021.644135
Tet1 Deficiency Leads to Premature Ovarian Failure
Abstract
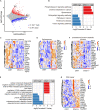
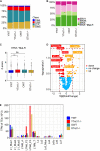
Tet enzymes participate in DNA demethylation and play critical roles in stem cell pluripotency and differentiation. DNA methylation alters with age. We find that Tet1 deficiency reduces fertility and leads to accelerated reproductive failure with age. Noticeably, Tet1-deficient mice at young age exhibit dramatically reduced follicle reserve and the follicle reserve further decreases with age, phenomenon consistent with premature ovarian failure (POF) syndrome. Consequently, Tet1-deficient mice become infertile by reproductive middle age, while age matched wild-type mice still robustly reproduce. Moreover, by single cell transcriptome analysis of oocytes, Tet1 deficiency elevates organelle fission, associated with defects in ubiquitination and declined autophagy, and also upregulates signaling pathways for Alzheimer's diseases, but down-regulates X-chromosome linked genes, such as Fmr1, which is known to be implicated in POF. Additionally, Line1 is aberrantly upregulated and endogenous retroviruses also are altered in Tet1-deficient oocytes. These molecular changes are consistent with oocyte senescence and follicle atresia and depletion found in premature ovarian failure or insufficiency. Our data suggest that Tet1 enzyme plays roles in maintaining oocyte quality as well as oocyte number and follicle reserve and its deficiency can lead to POF.
Keywords: Tet1; aging; epigenetics; oocyte; premature ovarian failure.
Copyright © 2021 Liu, Wang, Xu and Liu.
Conflict of interest statement
The authors declare that the research was conducted in the absence of any commercial or financial relationships that could be construed as a potential conflict of interest.
Figures


Similar articles
-
Tet1 Deficiency Leads to Premature Reproductive Aging by Reducing Spermatogonia Stem Cells and Germ Cell Differentiation.iScience. 2020 Mar 27;23(3):100908. doi: 10.1016/j.isci.2020.100908. Epub 2020 Feb 13. iScience. 2020. PMID: 32114381 Free PMC article.
-
Rictor/mTORC2 pathway in oocytes regulates folliculogenesis, and its inactivation causes premature ovarian failure.J Biol Chem. 2015 Mar 6;290(10):6387-96. doi: 10.1074/jbc.M114.605261. Epub 2015 Jan 6. J Biol Chem. 2015. PMID: 25564616 Free PMC article.
-
Mechanisms of premature ovarian failure.Ann Endocrinol (Paris). 2003 Apr;64(2):87-92. Ann Endocrinol (Paris). 2003. PMID: 12773939 Review.
-
Senataxin: A New Guardian of the Female Germline Important for Delaying Ovarian Aging.Front Genet. 2021 Apr 29;12:647996. doi: 10.3389/fgene.2021.647996. eCollection 2021. Front Genet. 2021. PMID: 33995483 Free PMC article. Review.
-
Resveratrol protects against age-associated infertility in mice.Hum Reprod. 2013 Mar;28(3):707-17. doi: 10.1093/humrep/des437. Epub 2013 Jan 4. Hum Reprod. 2013. PMID: 23293221
Cited by
-
Epigenetic regulation in premature ovarian failure: A literature review.Front Physiol. 2023 Jan 4;13:998424. doi: 10.3389/fphys.2022.998424. eCollection 2022. Front Physiol. 2023. PMID: 36685174 Free PMC article. Review.
-
The landscape of aging.Sci China Life Sci. 2022 Dec;65(12):2354-2454. doi: 10.1007/s11427-022-2161-3. Epub 2022 Sep 2. Sci China Life Sci. 2022. PMID: 36066811 Free PMC article. Review.
-
Genetic and Epigenetic Interactions Involved in Senescence of Stem Cells.Int J Mol Sci. 2024 Sep 7;25(17):9708. doi: 10.3390/ijms25179708. Int J Mol Sci. 2024. PMID: 39273655 Free PMC article. Review.
-
Human Endogenous Retroviruses: Friends and Foes in Urology Clinics.Int Neurourol J. 2022 Dec;26(4):275-287. doi: 10.5213/inj.2244284.142. Epub 2022 Dec 30. Int Neurourol J. 2022. PMID: 36599336 Free PMC article.
-
CRL4DCAF13 E3 ubiquitin ligase targets MeCP2 for degradation to prevent DNA hypermethylation and ensure normal transcription in growing oocytes.Cell Mol Life Sci. 2024 Apr 5;81(1):165. doi: 10.1007/s00018-024-05185-4. Cell Mol Life Sci. 2024. PMID: 38578457 Free PMC article.
References
LinkOut - more resources
Full Text Sources
Other Literature Sources
Molecular Biology Databases

