. 2021 Mar 23:8:659168.
doi: 10.3389/fmolb.2021.659168. eCollection 2021.

Transcriptomic Profiling Identifies DCBLD2 as a Diagnostic and Prognostic Biomarker in Pancreatic Ductal Adenocarcinoma

Affiliations

Transcriptomic Profiling Identifies DCBLD2 as a Diagnostic and Prognostic Biomarker in Pancreatic Ductal Adenocarcinoma

Zengyu Feng et al. Front Mol Biosci. .

Abstract

Background: Accumulating evidence shows that the elevated expression of DCBLD2 (discoidin, CUB and LCCL domain-containing protein 2) is associated with unfavorable prognosis of various cancers. However, the correlation of DCBLD2 expression value with the diagnosis and prognosis of pancreatic ductal adenocarcinoma (PDAC) has not yet been elucidated.

Methods: Univariate Cox regression analysis was used to screen robust survival-related genes. Expression pattern of selected genes was investigated in PDAC tissues and normal tissues from multiple cohorts. Kaplan-Meier (K-M) survival curves, ROC curves and calibration curves were employed to assess prognostic performance. The relationship between DCBLD2 expression and immune cell infiltrates was conducted by CIBERSORT software. Biological processes and KEGG pathway enrichment analyses were adopted to clarify the potential function of DCBLD2 in PDAC.

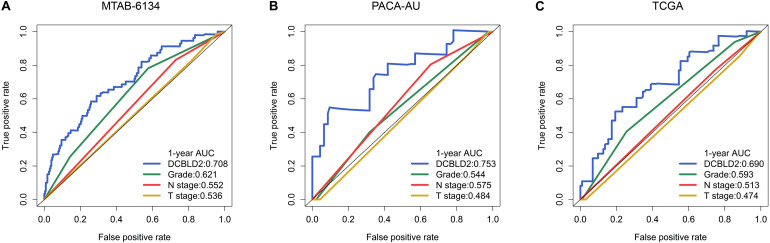
Results: Univariate analysis, K-M survival curves and calibration curves indicated that DCBLD2 was a robust prognostic factor for PDAC with cross-cohort compatibility. Upregulation of DCBLD2 was observed in dissected PDAC tissues as well as extracellular vesicles from both plasma and serum samples of PDAC patients. Both DCBLD2 expression in tissue and extracellular vesicles had significant diagnostic value. Besides, DCBLD2 expression was correlated with infiltrating level of CD8+ T cells and macrophage M2 cells. Functional enrichment revealed that DCBLD2 might be involved in cell motility, angiogenesis, and cancer-associated pathways.

Conclusion: Our study systematically analyzed the potential diagnostic, prognostic and therapeutic value of DCBLD2 in PDAC. All the findings indicated that DCBLD2 might play a considerably oncogenic role in PDAC with diagnostic, prognostic and therapeutic potential. These preliminary results of bioinformatics analyses need to be further validated in more prospective studies.

Keywords: DCBLD2; diagnosis; extracellular vesicles; immune infiltrates; pancreatic ductal adenocarcinoma; prognosis.


Conflict of interest statement

The authors declare that the research was conducted in the absence of any commercial or financial relationships that could be construed as a potential conflict of interest.

Figures

FIGURE 1
FIGURE 1
Overall flowchart study design and data analyses of this study.
FIGURE 2
FIGURE 2
Expression of DCBLD2 in PDAC tissues and its diagnostic value. (A) The expression of DCBLD2 in unpaired PDAC tissues and normal tissues in seven independent PDAC cohorts. (B) Expression profile of DCBLD2 based on the GEPIA database. (C–F) Expression pattern of DCBLD2 in PDAC tissues and matched adjacent normal tissues in four independent PDAC cohorts. (G–J) ROC curves illustrated the value of DCBLD2 in the diagnosis of PDAC in four independent PDAC cohorts. The statistical significance of differential expression was assessed by Wilcoxon test (*p < 0.05, **p < 0.01 and ****p < 0.0001).
FIGURE 3
FIGURE 3
Prognostic validation of DCBLD2 in PDAC. (A–J) K–M curves estimated the OS difference between low- and high-expression groups in ten independent PDAC cohorts. The statistical significance of differential survival was evaluated by log-rank test.
FIGURE 4
FIGURE 4
Prognostic performance of DCBLD2 in PDAC. (A–J) Calibration curves for DCBLD2 in ten independent PDAC cohorts.
FIGURE 5
FIGURE 5
Comparison of predictive accuracy of DCBLD2 and clinical parameters. (A–C) ROC curves compared the predictive abilities of DCBLD2 and clinical parameters for OS in the MTAB-6134, PACA-AU, and TCGA cohorts, respectively.
FIGURE 6
FIGURE 6
Correlation analysis between DCBLD2 expression and immune infiltrates. (A–C) The correlation between DCBLD2 expression and the abundance of macrophage M0, macrophage M2, and CD8+ T cell in MTAB-6134 cohort, respectively. (D–F) The correlation between DCBLD2 expression and the infiltration of macrophage M0, macrophage M2 and CD8+ T cell in TCGA cohort, respectively. The correlation coefficients and p value were derived from Pearson correlation analysis.
FIGURE 7
FIGURE 7
Biological function of DCBLD2. (A,B) Biological process analysis of top 1,000 positively co-expressed genes of DCBLD2. (C,D) KEGG pathway enrichment analysis of top 1,000 positively co-expressed genes of DCBLD2.
FIGURE 8
FIGURE 8
Expression of DCBLD2 in extracellular vesicles from human plasma samples. (A) Boxplots show the distribution of extracellular vesicular DCBLD2 expression in plasma samples from healthy donors, CP patients and PDAC patients. (B) ROC curve showed the diagnostic value of extracellular vesicular DCBLD2 (PDAC vs Normal + CP). The statistical significance in comparing DCBLD2 expression between the two groups was determined by Wilcoxon test.
FIGURE 9
FIGURE 9
Expression of DCBLD2 in extracellular vesicles from human serum samples. (A) NTA analysis and (B) TEM analysis to assess characteristics of extracellular vesicles. (C) Boxplots show the distribution of extracellular vesicular DCBLD2 expression in serum samples from healthy donors, CP patients and PDAC patients. (D) ROC curve showed the diagnostic value of extracellular vesicular DCBLD2 (PDAC vs Normal + CP). The statistical significance in comparing DCBLD2 expression between the two groups was determined by Wilcoxon test. The statistical significance in comparing DCBLD2 expression between the three groups was investigated by Kruskal–Wallis test.

Similar articles

Cited by

References

    1. Ahluwalia P., Kolhe R., Gahlay G. K. (2021). The clinical relevance of gene expression based prognostic signatures in colorectal cancer. Biochim. Biophys. Acta Rev. Cancer 1875:188513. 10.1016/j.bbcan.2021.188513 - DOI - PubMed
    1. Beane J., Spira A., Lenburg M. E. (2009). Clinical impact of high-throughput gene expression studies in lung cancer. J. Thorac. Oncol. 4 109–118. 10.1097/JTO.0b013e31819151f8 - DOI - PMC - PubMed
    1. Bouchard A., Witalis M., Chang J., Panneton V., Li J., Bouklouch Y., et al. (2020). Hippo signal transduction mechanisms in T cell immunity. Immune Netw. 20:e36. 10.4110/in.2020.20.e36 - DOI - PMC - PubMed
    1. Camp R. L., Dolled-Filhart M., Rimm D. L. (2004). X-tile: a new bio-informatics tool for biomarker assessment and outcome-based cut-point optimization. Clin. Cancer Res. 10 7252–7259. 10.1158/1078-0432.Ccr-04-0713 - DOI - PubMed
    1. Chen B., Khodadoust M. S., Liu C. L., Newman A. M., Alizadeh A. A. (2018). Profiling tumor infiltrating immune cells with CIBERSORT. Methods Mol. Biol. 1711 243–259. 10.1007/978-1-4939-7493-1_12 - DOI - PMC - PubMed