

A Note on "Sequential Neighborhood Effects" by Hicks et al. (2018)
- PMID: 33834231
- PMCID: PMC12168049
- DOI: 10.1215/00703370-9000711
A Note on "Sequential Neighborhood Effects" by Hicks et al. (2018)
Abstract
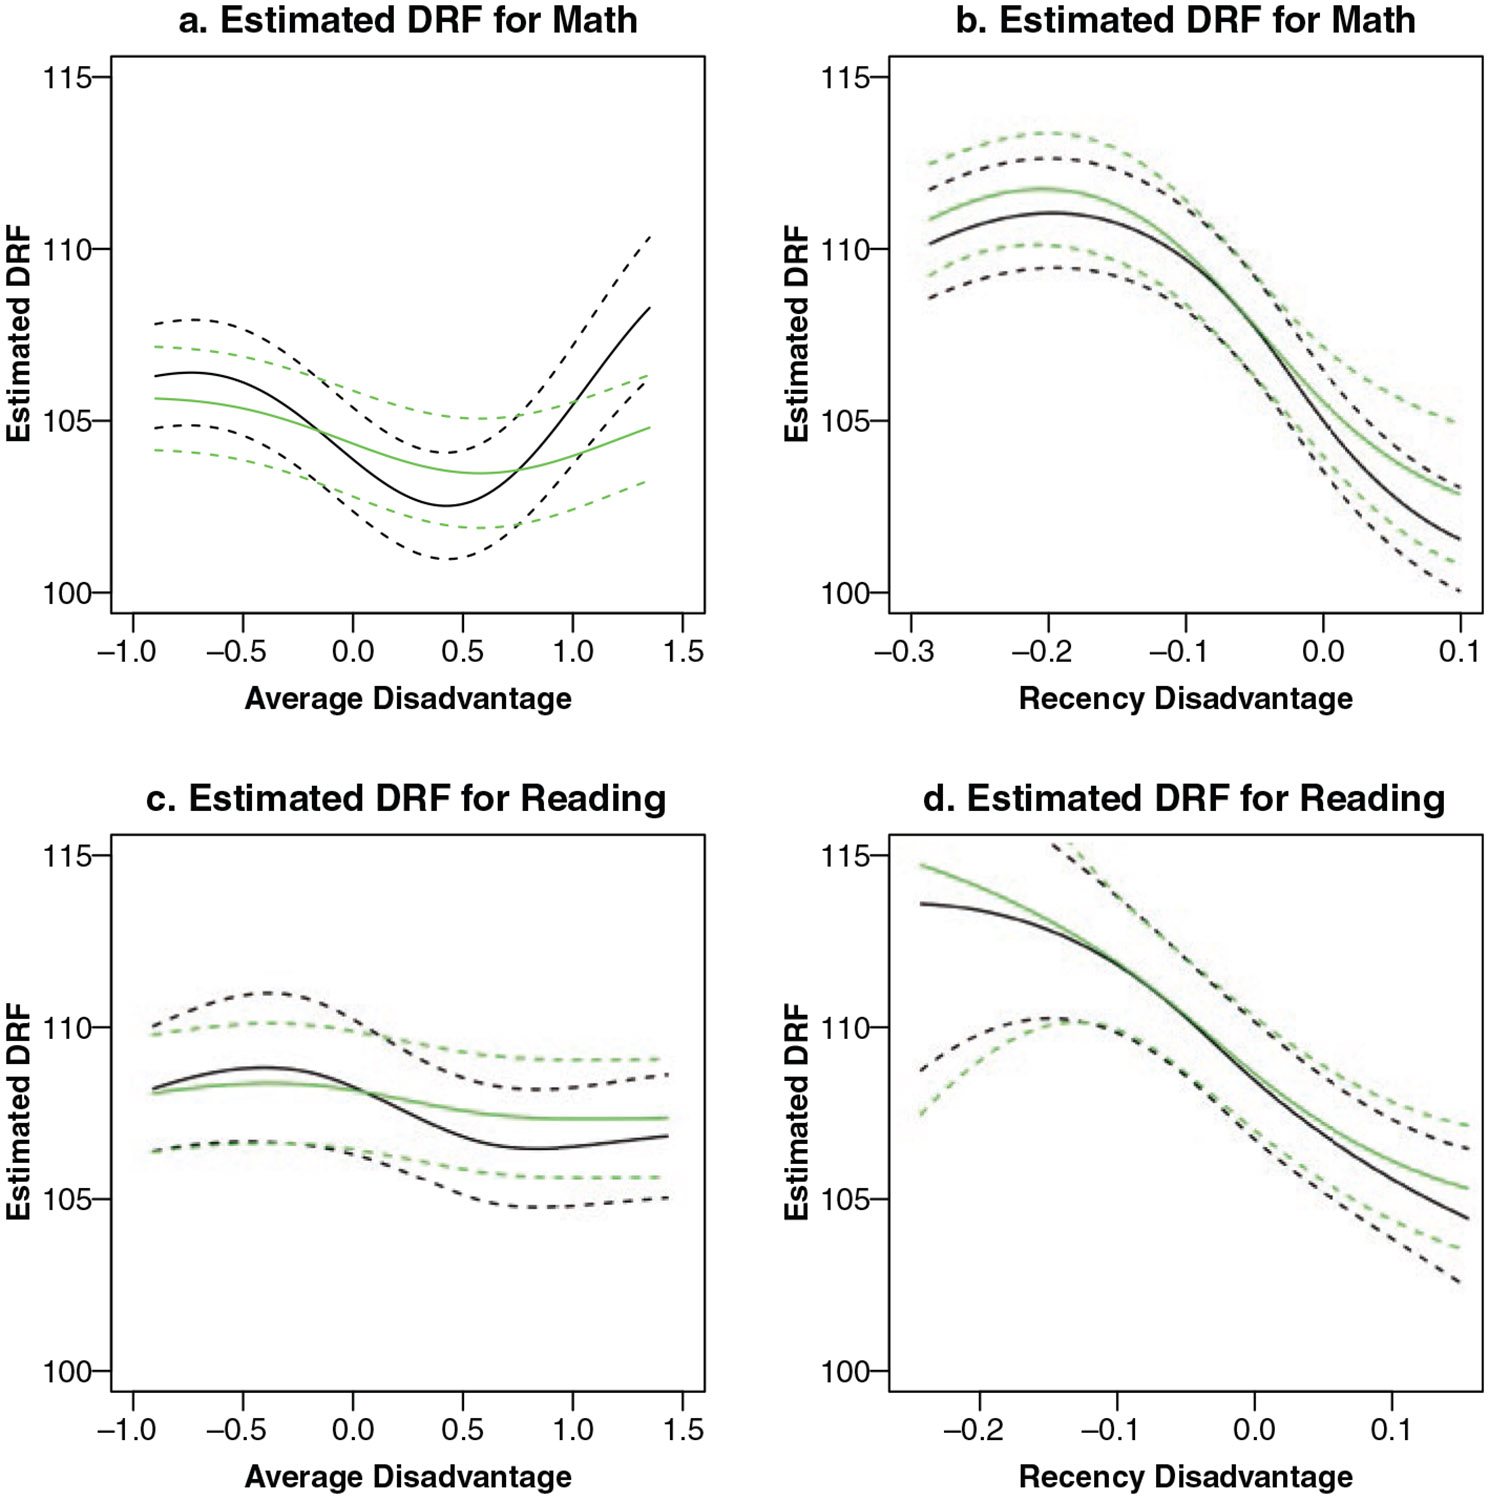
We revisit a novel causal model published in Demography by Hicks et al. (2018), designed to assess whether exposure to neighborhood disadvantage over time affects children's reading and math skills. Here, we provide corrected and new results. Reconsideration of the model in the original article raised concerns about bias due to exposure-induced confounding (i.e., past exposures directly affecting future exposures) and true state dependence (i.e., past exposures affecting confounders of future exposures). Through simulation, we show that our originally proposed propensity function approach displays modest bias due to exposure-induced confounding but no bias from true state dependence. We suggest a correction based on residualized values and show that this new approach corrects for the observed bias. We contrast this revised method with other causal modeling approaches using simulation. Finally, we reproduce the substantive models from Hicks et al. (2018) using the new residuals-based adjustment procedure. With the correction, our findings are essentially identical to those reported originally. We end with some conclusions regarding approaches to causal modeling.
Keywords: Child development; Neighborhood effects; Propensity function models.
Copyright © 2021 The Authors.
Figures
Comment on
-
Sequential Neighborhood Effects: The Effect of Long-Term Exposure to Concentrated Disadvantage on Children's Reading and Math Test Scores.Demography. 2018 Feb;55(1):1-31. doi: 10.1007/s13524-017-0636-5. Demography. 2018. PMID: 29192386 Free PMC article.
References
-
- Imai K, & van Dyk DA (2004). Causal inference with general treatment regimes: Generalizing the propensity score. Journal of the American Statistical Association, 99, 854–866.
-
- Robins JM (1999). Association, causation, and marginal structural models. Synthese, 121, 151–179.
Publication types
MeSH terms
Grants and funding
LinkOut - more resources
Full Text Sources
Other Literature Sources
Miscellaneous