. 2021 Aug;15(8):2203-2218.
doi: 10.1002/1878-0261.12963. Epub 2021 May 2.

BMP9-ID1 signaling promotes EpCAM-positive cancer stem cell properties in hepatocellular carcinoma

Affiliations

BMP9-ID1 signaling promotes EpCAM-positive cancer stem cell properties in hepatocellular carcinoma

Han Chen et al. Mol Oncol. 2021 Aug.

Abstract

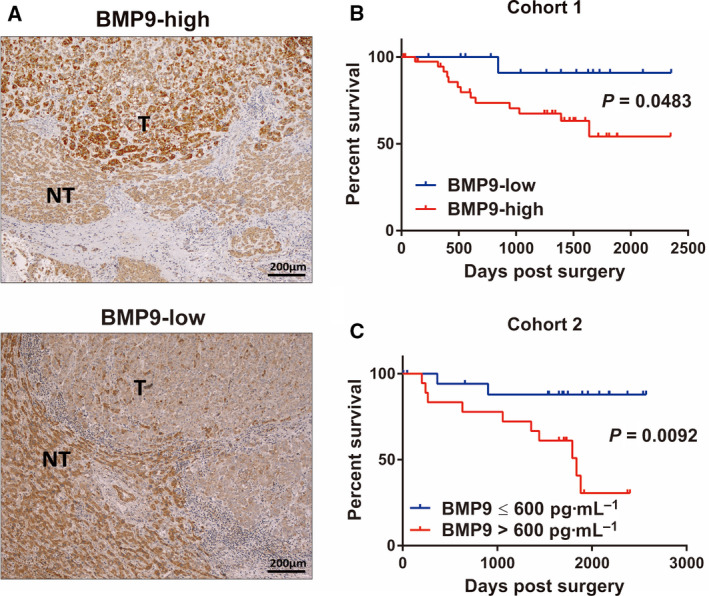
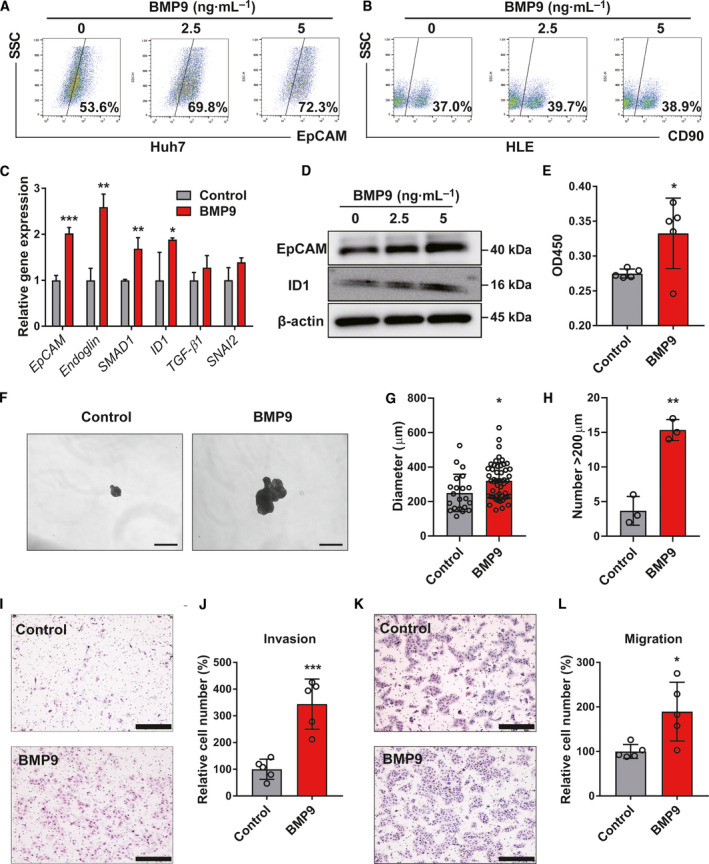
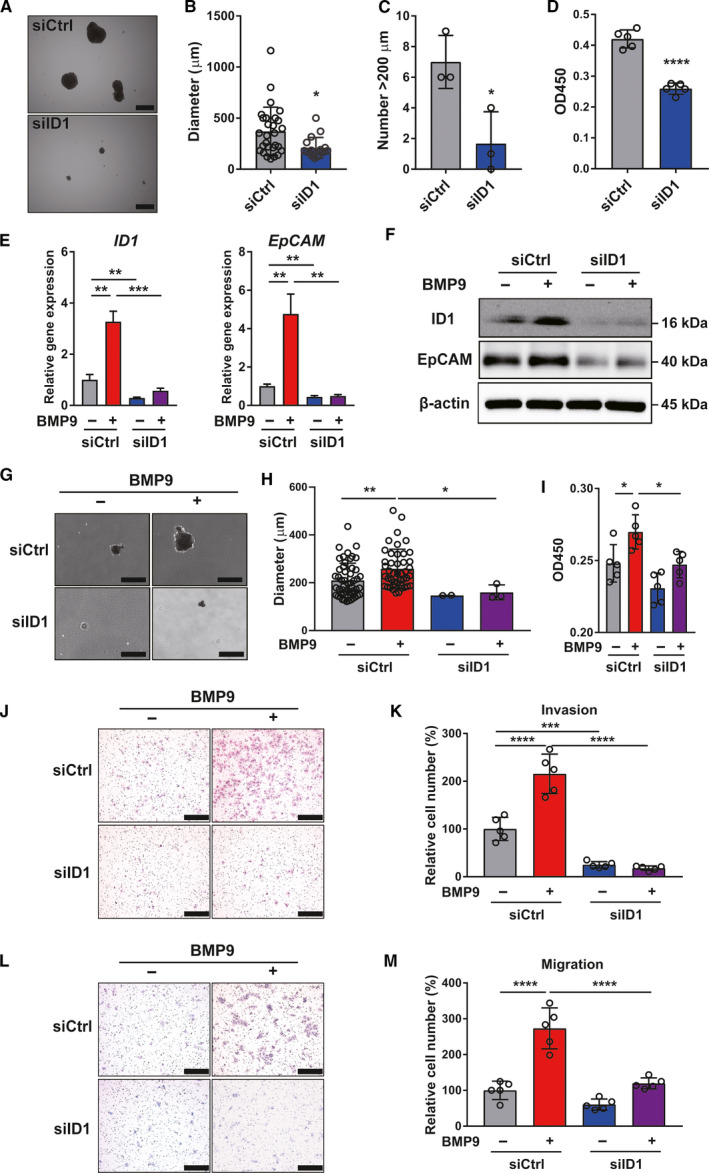
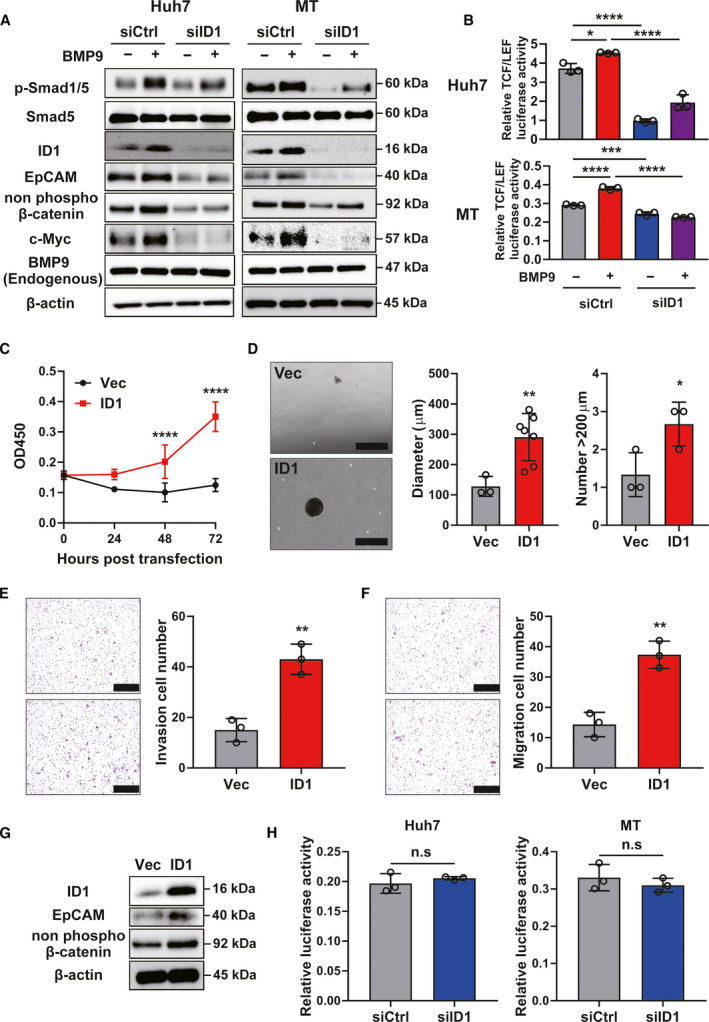
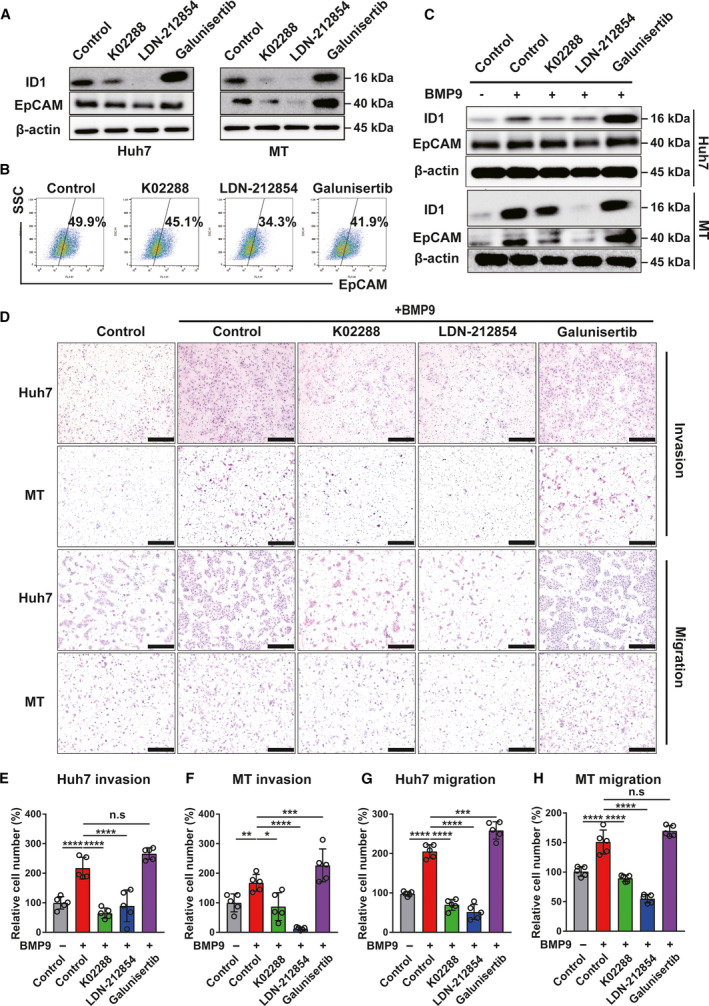
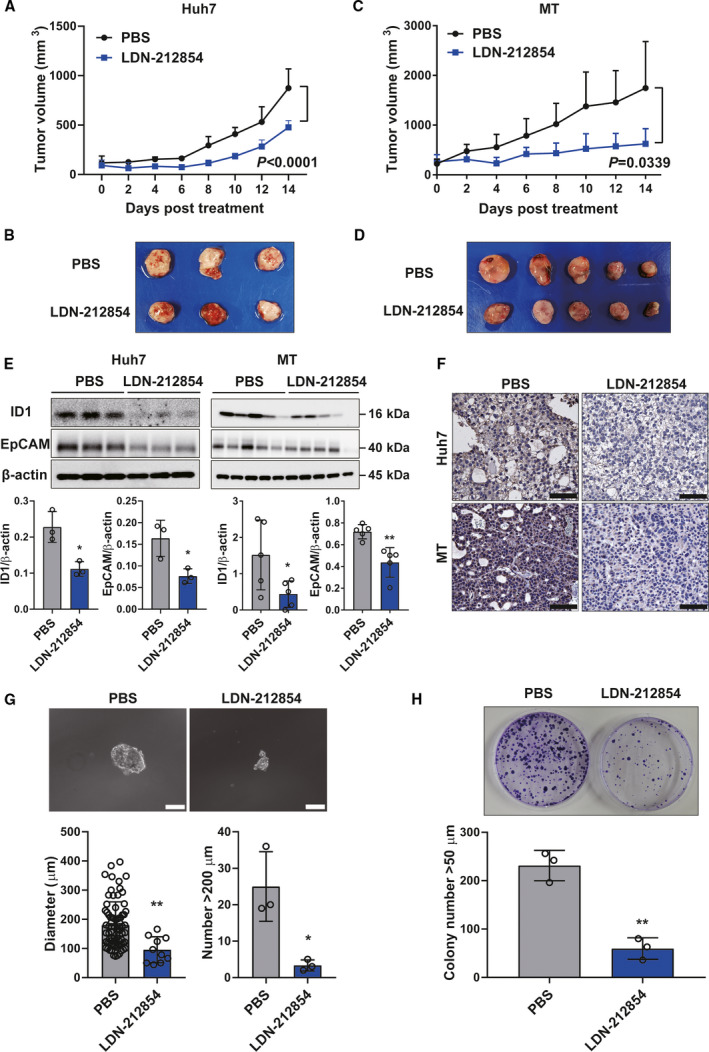
The malignant nature of hepatocellular carcinoma (HCC) is closely related to the presence of cancer stem cells (CSCs). Bone morphologic protein 9 (BMP9), a member of the transforming growth factor-beta (TGF-β) superfamily, was recently reported to be involved in liver diseases including cancer. We aimed to elucidate the role of BMP9 signaling in HCC-CSC properties and to assess the therapeutic effect of BMP receptor inhibitors in HCC. We have identified that high BMP9 expression in tumor tissues or serum from patients with HCC leads to poorer outcome. BMP9 promoted CSC properties in epithelial cell adhesion molecule (EpCAM)-positive HCC subtype via enhancing inhibitor of DNA-binding protein 1 (ID1) expression in vitro. Additionally, ID1 knockdown significantly repressed BMP9-promoted HCC-CSC properties by suppressing Wnt/β-catenin signaling. Interestingly, cells treated with BMP receptor inhibitors K02288 and LDN-212854 blocked HCC-CSC activation by inhibiting BMP9-ID1 signaling, in contrast to cells treated with the TGF-β receptor inhibitor galunisertib. Treatment with LDN-212854 suppressed HCC tumor growth by repressing ID1 and EpCAM in vivo. Our study demonstrates the pivotal role of BMP9-ID1 signaling in promoting HCC-CSC properties and the therapeutic potential of BMP receptor inhibitors in treating EpCAM-positive HCC. Therefore, targeting BMP9-ID1 signaling could offer novel therapeutic options for patients with malignant HCC.

Keywords: BMP receptor inhibitor; BMP9-ID1 signaling; EpCAM; cancer stem cells; hepatocellular carcinoma.


Conflict of interest statement

The authors declare no conflict of interest.

Figures

Fig. 1
Fig. 1
High expression of BMP9 is associated with poor prognosis of HCC patients. (A) Representative IHC staining images of BMP9‐high tumor (upper panel) and BMP9‐low tumor (lower panel) in surgically resected HCC tissue specimens. T, tumor tissue; NT, nontumor tissue. Scale bar = 200 μm. (B) Kaplan–Meier survival curves according to BMP9 expression in HCC tissue specimens (cohort 1, n = 54). BMP9‐high (n = 38), BMP9‐low (n = 16). (C) Kaplan–Meier survival curves according to BMP9 expression in the serum of HCC patients (cohort 2, n = 37). BMP9 > 600 pg·mL−1 (n = 18), BMP9 ≤ 600 pg·mL−1 (n = 19). Survival curves of two groups were compared using the log‐rank test. [Colour figure can be viewed at wileyonlinelibrary.com]
Fig. 2
Fig. 2
BMP9 promotes EpCAM+ CSC properties in HCC cells. (A, B) Flow cytometry analysis of the percentage of EpCAM‐positive cells in Huh7 cells and the percentage of CD90‐positive cells in HLE cells. Cells were treated with dimethyl sulfoxide or BMP9 (2.5 ng·mL−1, 5 ng·mL−1) for 10 days. (C) Relative gene expression levels of EpCAM, Endoglin, SMAD1, ID1, TGF‐β1, and SNAI2 in Huh7 cells treated with BMP9 (2.5 ng·mL−1) for 5 days. (D) Western blot analysis of EpCAM and ID1 expression in Huh7 cells treated with different concentrations of BMP9 for 5 days. (E) Optical density at 450 nm (OD450) in cell proliferation assay of Huh7 cells treated with BMP9 (5 ng·mL−1) for 48 h. (F) Representative spheroid assay images of Huh7 cells treated with or without BMP9 (5 ng·mL−1) for 14 days. BMP9 was added to the medium twice a week. Scale bar = 500 μm. (G) Spheroid diameter of (F). (H) Number of spheroids measuring > 200 µm of (F). (I) Representative invasion assay images of Huh7 cells treated with BMP9 (5 ng·mL−1) for 24 h. Scale bar = 200 μm. (J) Relative cell numbers from invasion assay. (K) Representative migration assay images of Huh7 cells treated with BMP9 (5 ng·mL−1) for 24 h. Scale bar = 200 μm. (L) Relative cell numbers from migration assay. Error bars represent the SD from at least three independent biological replicates. Student's t‐test was used to calculate P values represented as *P < 0.05; **P < 0.01; ***P < 0.001. [Colour figure can be viewed at wileyonlinelibrary.com]
Fig. 3
Fig. 3
Inhibition of ID1 represses BMP9‐induced HCC‐CSC properties. (A) Representative spheroid assay images of Huh7 cells transfected with control siRNA (siCtrl) or ID1 siRNA (siID1). Scale bar = 500 µm. (B) Spheroid diameter of (A). (C) Number of spheroids measuring > 200 µm of (A). (D) OD450 in cell proliferation assay of siCtrl or siID1 transfected Huh7 cells. (E) Relative gene expression levels of ID1 and EpCAM in Huh7 cells treated with or without BMP9 (5 ng·mL−1) for 48 h following siRNA transfection. (F) Western blot analysis of ID1 and EpCAM expression in Huh7 cells treated with or without BMP9 (5 ng·mL−1) for 48 h following siRNA transfection. (G) Representative spheroid assay images of Huh7 cells treated with or without BMP9 (5 ng·mL−1) for 14 days following siRNA transfection. BMP9 was added to the medium twice a week. Scale bar = 500 μm. (H) Spheroid diameter of (G). (I) OD450 in cell proliferation assay of Huh7 cells treated with or without BMP9 (5 ng·mL−1) for 24 h following the siRNA transfection. (J) Representative invasion assay images of Huh7 cells treated with or without BMP9 (5 ng·mL−1) for 24 h following siRNA transfection. Scale bar = 200 μm. (K) Relative cell number from invasion assay. (L) Representative migration assay images of Huh7 cells treated with or without BMP9 (5 ng·mL−1) for 24 h following the siRNA transfection. Scale bar = 200 μm. (M) Relative cell number from migration assay. Error bars represent the SD from at least three independent biological replicates. Student's t‐test was used to calculate P values represented as *P < 0.05, **P < 0.01, ***P < 0.001, ****P < 0.0001. [Colour figure can be viewed at wileyonlinelibrary.com]
Fig. 4
Fig. 4
BMP9‐ID1 cooperatively regulates EpCAM+ HCC‐CSCs through activating Wnt/β‐catenin signaling. (A) Western blot images of ID1 knockdown Huh7/MT cells treated with or without BMP9. (B) Relative TCF/LEF luciferase activity in ID1 knockdown Huh7/MT cells treated with or without BMP9. (C) OD450 in cell proliferation assay of control vector (Vec) or ID1 vector (ID1)‐transfected MT cells. (D) Representative spheroid assay images, spheroid diameter, and number of spheroids (> 200 µm) of MT cells transfected with Vec or ID1. Scale bar = 500 µm. (E) Representative invasion assay images and relative cell numbers from invasion assay of MT cells transfected with Vec or ID1. Scale bar = 200 µm. (F) Representative migration assay images and relative cell numbers from migration assay of MT cells transfected with Vec or ID1. Scale bar = 200 µm. (G) Western blot images of Vec‐ or ID1‐transfected MT cells. (H) Relative luciferase activity in ID1 knockdown Huh7 and MT cells transfected with pGL4.10 containing 2151bp promoter/enhancer fragment of the EpCAM gene. Error bars represent the SD from at least three independent biological replicates. Student's t‐test was used to calculate P values represented as *P < 0.05, **P < 0.01, ***P < 0.001, ****P < 0.0001. n.s, not significant. [Colour figure can be viewed at wileyonlinelibrary.com]
Fig. 5
Fig. 5
BMP receptor inhibitors suppress BMP9‐ID1 signaling‐induced HCC‐CSC phenotypes. (A) Western blot analysis of ID1 and EpCAM expression in Huh7 and MT cells treated with BMP/TGF‐β receptor inhibitors. (B) Flow cytometry analysis of EpCAM‐positive Huh7 cells treated with BMP/TGFβ receptor inhibitors (0.25 μm) for 5 days. The percentage indicates EpCAM‐positive cells. (C) Western blot analysis of ID1 and EpCAM expression in Huh7 cells treated with BMP/TGF‐β receptor inhibitors (0.5 μm) in the presence of BMP9 (5 ng·mL−1) for 48 h. (D) Representative invasion/migration assay images of Huh7 and MT cells treated with BMP/TGF‐β receptor inhibitors (1 μm) in the presence of BMP9 (10 ng·mL−1) for 24 h. Scale bar = 200 μm. (E–H) Relative cell number of invasion/migration assay in Huh7 and MT cells. Error bars represent the SD from five independent biological replicates. One‐way ANOVA was used to calculate P values represented as *P < 0.05, **P < 0.01, ***P < 0.001, ****P < 0.0001. n.s, not significant. [Colour figure can be viewed at wileyonlinelibrary.com]
Fig. 6
Fig. 6
BMP receptor inhibitor LDN‐212854 suppresses tumor growth of HCC xenografts through repression of ID1 in vivo. (A) Effect of LDN‐212854 on growth of Huh7 cells. (B) Xenograft tumors of Huh7 cells treated with PBS (n = 3) or LDN‐212854 (n = 3). (C) Effect of LDN‐212854 on growth of MT cells. (D) Xenograft tumors of MT cells treated with PBS (n = 5) or LDN‐212854 (n = 5). (E) Western blot analysis of ID1 and EpCAM expression in xenograft tumor of Huh7 and MT cells. β‐actin was used as the reference for quantifying the protein expression. (F) Representative IHC staining images of ID1 expression in xenografts of Huh7 and MT cells. Scale bar = 200 µm. (G) Representative spheroid assay images of Huh7 xenografts treated with PBS or LDN‐212854. Scale bar = 200 µm. Spheroid diameter (µm) and number of spheroids measuring > 200 µm in each group were shown. (H) Representative colony formation assay images of Huh7 xenografts treated with PBS or LDN‐212854. The colony numbers measuring > 50 µm in each group were shown. Error bars represent the SD from at least three independent biological replicates. Student's t‐test was used to calculate P values represented as *P < 0.05, **P < 0.01. [Colour figure can be viewed at wileyonlinelibrary.com]

Similar articles

Cited by

References

    1. Elkhenany H, Shekshek A, Abdel‐Daim M & El‐Badri N (2020) Stem cell therapy for hepatocellular carcinoma: future perspectives. Adv Exp Med Biol 1237, 97–119. - PubMed
    1. Visvader JE & Lindeman GJ (2008) Cancer stem cells in solid tumours: accumulating evidence and unresolved questions. Nat Rev Cancer 8, 755–768. - PubMed
    1. Nio K, Yamashita T & Kaneko S (2017) The evolving concept of liver cancer stem cells. Mol Cancer 16, 4. - PMC - PubMed
    1. Tsui YM, Chan LK & Ng IO (2020) Cancer stemness in hepatocellular carcinoma: mechanisms and translational potential. Br J Cancer 122, 1428–1440. - PMC - PubMed
    1. Yamashita T, Honda M, Nakamoto Y, Baba M, Nio K, Hara Y, Zeng SS, Hayashi T, Kondo M, Takatori H et al. (2013) Discrete nature of EpCAM+ and CD90+ cancer stem cells in human hepatocellular carcinoma. Hepatology 57, 1484–1497. - PMC - PubMed

Publication types

MeSH terms

Substances