

Accelerated 3D whole-brain T1, T2, and proton density mapping: feasibility for clinical glioma MR imaging
- PMID: 33835238
- PMCID: PMC8528802
- DOI: 10.1007/s00234-021-02703-0
Accelerated 3D whole-brain T1, T2, and proton density mapping: feasibility for clinical glioma MR imaging
Abstract
Purpose: Advanced MRI-based biomarkers offer comprehensive and quantitative information for the evaluation and characterization of brain tumors. In this study, we report initial clinical experience in routine glioma imaging with a novel, fully 3D multiparametric quantitative transient-state imaging (QTI) method for tissue characterization based on T1 and T2 values.
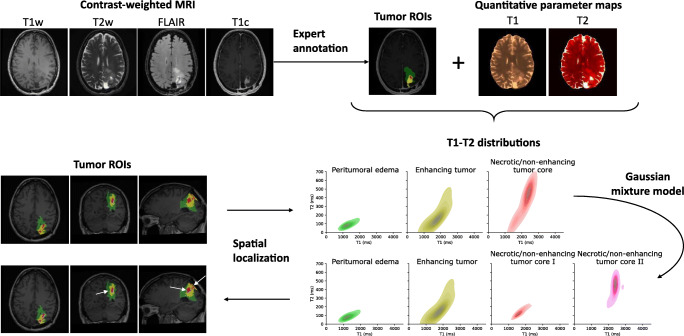
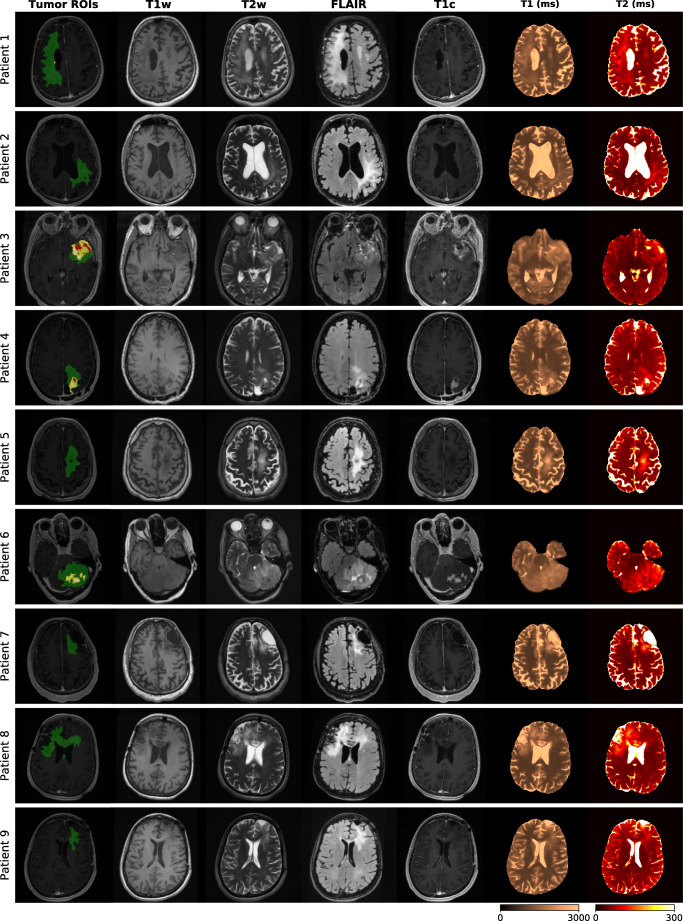
Methods: To demonstrate the viability of the proposed 3D QTI technique, nine glioma patients (grade II-IV), with a variety of disease states and treatment histories, were included in this study. First, we investigated the feasibility of 3D QTI (6:25 min scan time) for its use in clinical routine imaging, focusing on image reconstruction, parameter estimation, and contrast-weighted image synthesis. Second, for an initial assessment of 3D QTI-based quantitative MR biomarkers, we performed a ROI-based analysis to characterize T1 and T2 components in tumor and peritumoral tissue.
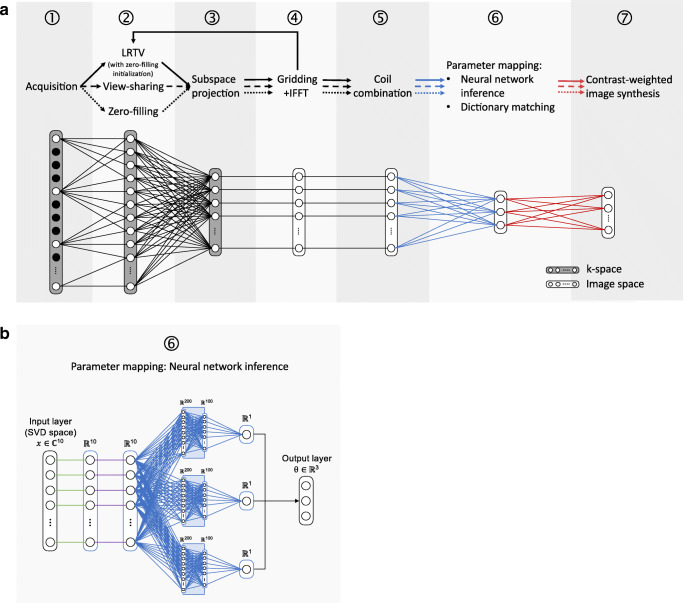
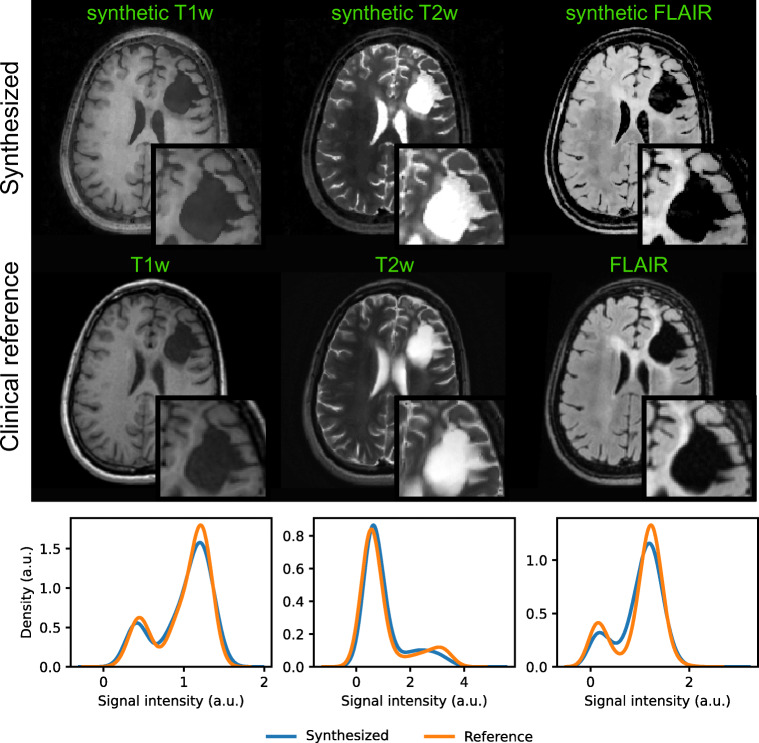
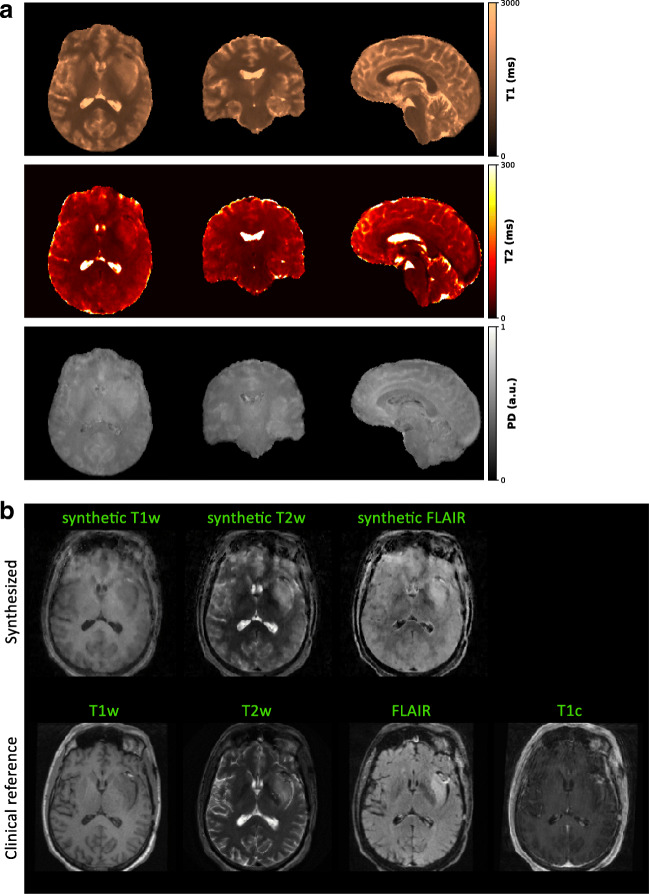
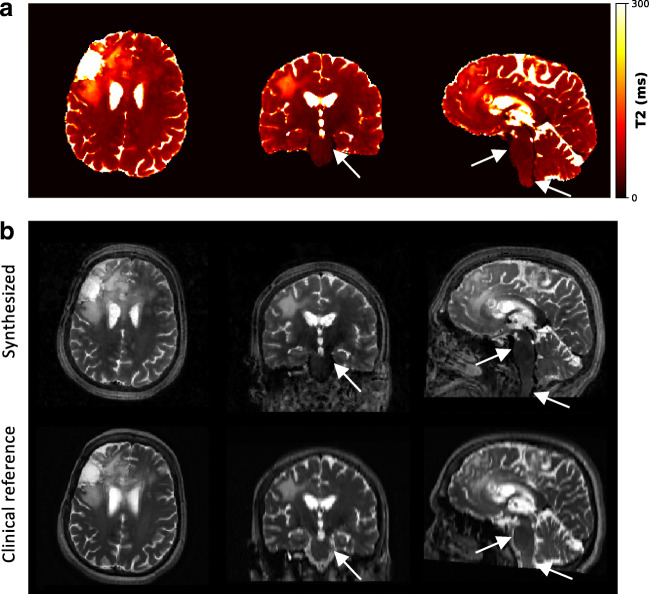
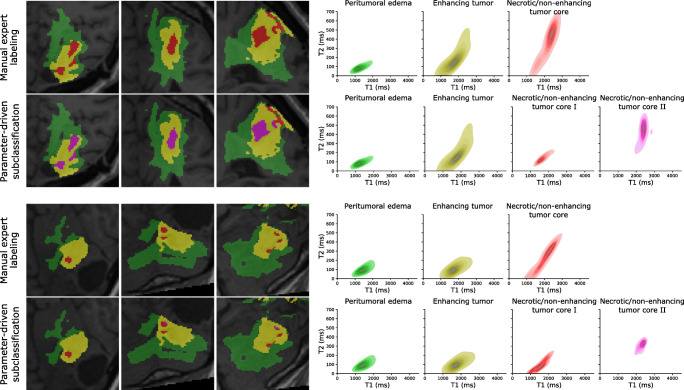
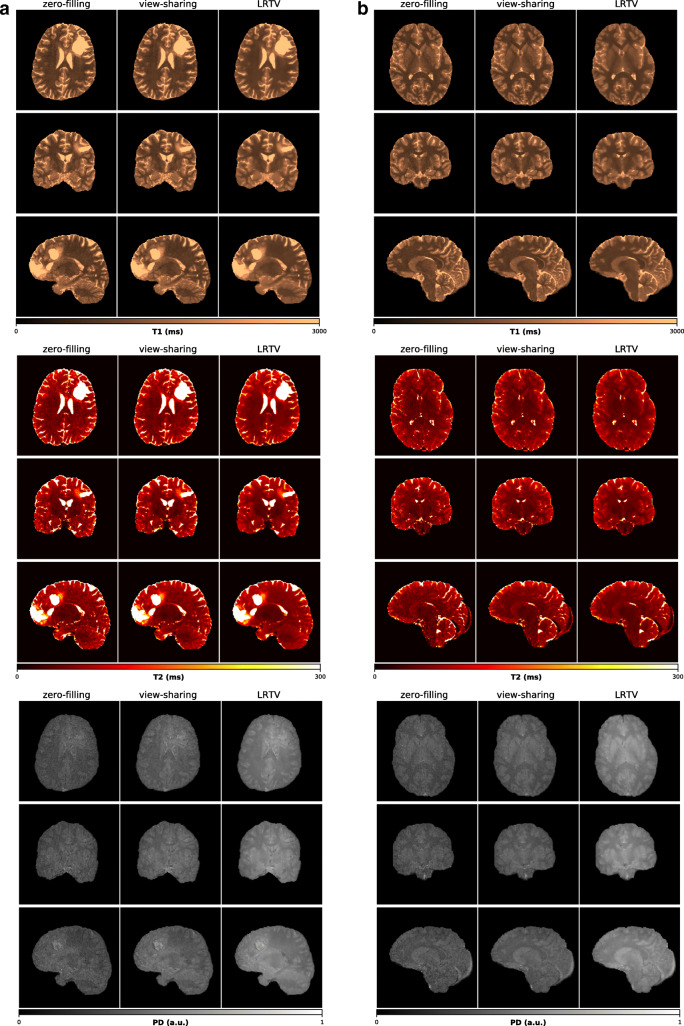
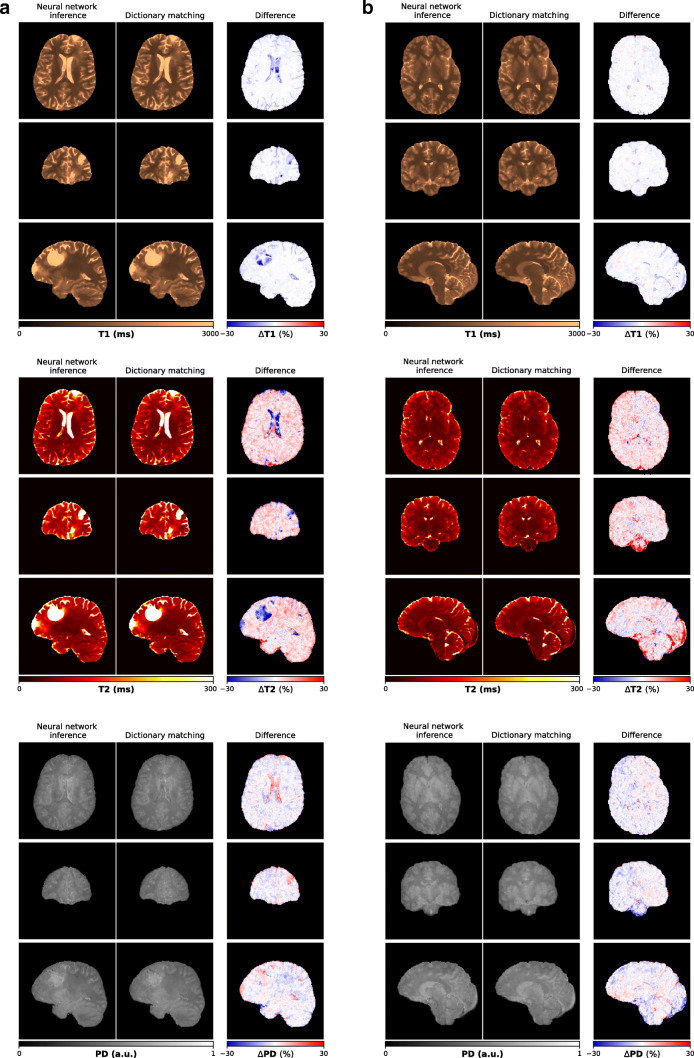
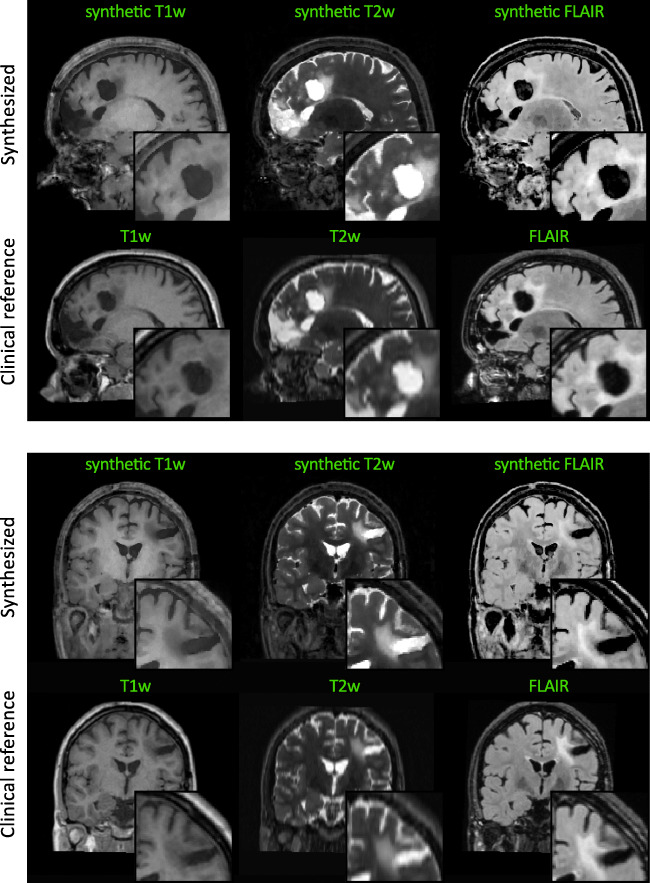
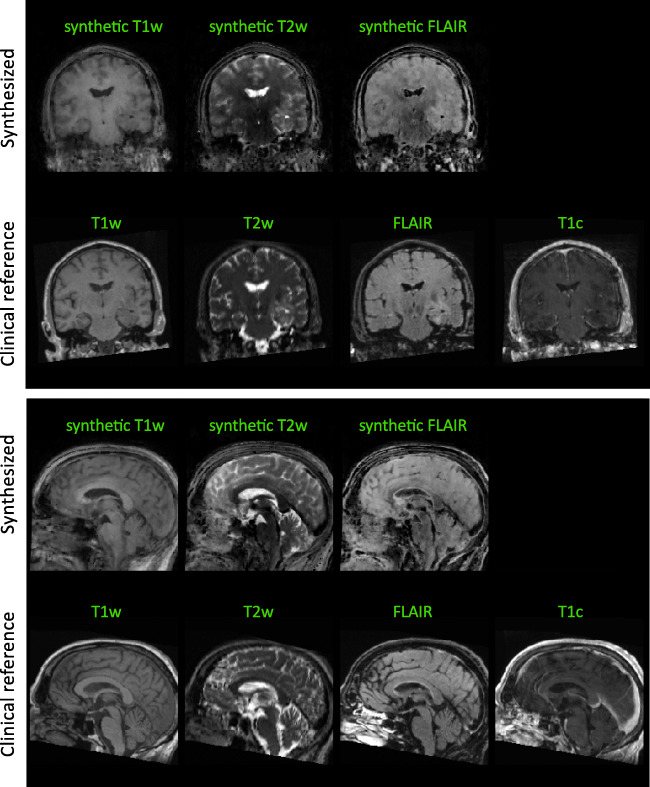
Results: The 3D acquisition combined with a compressed sensing reconstruction and neural network-based parameter inference produced parametric maps with high isotropic resolution (1.125 × 1.125 × 1.125 mm3 voxel size) and whole-brain coverage (22.5 × 22.5 × 22.5 cm3 FOV), enabling the synthesis of clinically relevant T1-weighted, T2-weighted, and FLAIR contrasts without any extra scan time. Our study revealed increased T1 and T2 values in tumor and peritumoral regions compared to contralateral white matter, good agreement with healthy volunteer data, and high inter-subject consistency.
Conclusion: 3D QTI demonstrated comprehensive tissue assessment of tumor substructures captured in T1 and T2 parameters. Aiming for fast acquisition of quantitative MR biomarkers, 3D QTI has potential to improve disease characterization in brain tumor patients under tight clinical time-constraints.
Keywords: Glioma imaging; Image-based biomarkers; MRI; Multiparametric imaging; Neural networks.
© 2021. The Author(s).
Conflict of interest statement
C.M.P, R.F.S., and M.I.M are employees at GE Healthcare, Munich, Germany. M.S. received an honorarium (paid to institution) from Parexel Ltd. for EORTC-1410 and speaker fees (paid to institution) from GE Healthcare. All other authors declare no competing interests.
Figures

Similar articles
-
Initial assessment of 3D magnetic resonance fingerprinting (MRF) towards quantitative brain imaging for radiation therapy.Med Phys. 2020 Mar;47(3):1199-1214. doi: 10.1002/mp.13967. Epub 2019 Dec 30. Med Phys. 2020. PMID: 31834641
-
Three-dimensional whole-brain simultaneous T1, T2, and T1ρ quantification using MR Multitasking: Method and initial clinical experience in tissue characterization of multiple sclerosis.Magn Reson Med. 2021 Apr;85(4):1938-1952. doi: 10.1002/mrm.28553. Epub 2020 Oct 26. Magn Reson Med. 2021. PMID: 33107126 Free PMC article.
-
Accelerated Isotropic Multiparametric Imaging by High Spatial Resolution 3D-QALAS With Compressed Sensing: A Phantom, Volunteer, and Patient Study.Invest Radiol. 2021 May 1;56(5):292-300. doi: 10.1097/RLI.0000000000000744. Invest Radiol. 2021. PMID: 33273376 Free PMC article.
-
Multi-parametric MR Imaging Biomarkers Associated to Clinical Outcomes in Gliomas: A Systematic Review.Curr Med Imaging Rev. 2019;15(10):933-947. doi: 10.2174/1573405615666190109100503. Curr Med Imaging Rev. 2019. PMID: 32008521
-
Applications of MR Finger printing derived T1 and T2 values in Adult brain: A Systematic review.F1000Res. 2025 Jan 9;14:54. doi: 10.12688/f1000research.160088.1. eCollection 2025. F1000Res. 2025. PMID: 39839989 Free PMC article.
Cited by
-
Quantitative Relaxometry Metrics for Brain Metastases Compared to Normal Tissues: A Pilot MR Fingerprinting Study.Cancers (Basel). 2022 Nov 15;14(22):5606. doi: 10.3390/cancers14225606. Cancers (Basel). 2022. PMID: 36428699 Free PMC article.
-
Magnetic resonance relaxometry in quantitative imaging of brain gliomas: A literature review.Neuroradiol J. 2024 Jun;37(3):267-275. doi: 10.1177/19714009231173100. Epub 2023 May 3. Neuroradiol J. 2024. PMID: 37133228 Free PMC article. Review.
-
Current Clinical Applications of Structural MRI in Neurological Disorders.J Clin Neurol. 2025 Jul;21(4):277-293. doi: 10.3988/jcn.2025.0185. J Clin Neurol. 2025. PMID: 40635533 Free PMC article. Review.
-
Time-efficient, high-resolution 3T whole-brain relaxometry using Cartesian 3D MR Spin TomogrAphy in Time-Domain (MR-STAT) with cerebrospinal fluid suppression.Magn Reson Med. 2025 May;93(5):2008-2019. doi: 10.1002/mrm.30384. Epub 2024 Nov 28. Magn Reson Med. 2025. PMID: 39607873 Free PMC article.
-
Development of Clinical-Radiomics Nomogram for Predicting Post-Surgery Functional Improvement in High-Grade Glioma Patients.Cancers (Basel). 2025 Feb 23;17(5):758. doi: 10.3390/cancers17050758. Cancers (Basel). 2025. PMID: 40075605 Free PMC article.
References
-
- Thust SC, Heiland S, Falini A, Jäger HR, Waldman AD, Sundgren PC, Godi C, Katsaros VK, Ramos A, Bargallo N, Vernooij MW, Yousry T, Bendszus M, Smits M. Glioma imaging in Europe: a survey of 220 centres and recommendations for best clinical practice. Eur Radiol. 2018;28:3306–3317. doi: 10.1007/s00330-018-5314-5. - DOI - PMC - PubMed
-
- Louis DN, Ohgaki H, Wiestler OD, Cavenee WK. WHO Classification of Tumours of the Central Nervous System. 4. France: International Agency for Research on Cancer; 2016.
MeSH terms
Substances
Grants and funding
LinkOut - more resources
Full Text Sources
Other Literature Sources
