

Do Inhibitory Metabolites Impact DDI Risk Assessment? Analysis of in vitro and in vivo Data from NDA Reviews Between 2013 and 2018
- PMID: 33835478
- PMCID: PMC9794360
- DOI: 10.1002/cpt.2259
Do Inhibitory Metabolites Impact DDI Risk Assessment? Analysis of in vitro and in vivo Data from NDA Reviews Between 2013 and 2018
Abstract
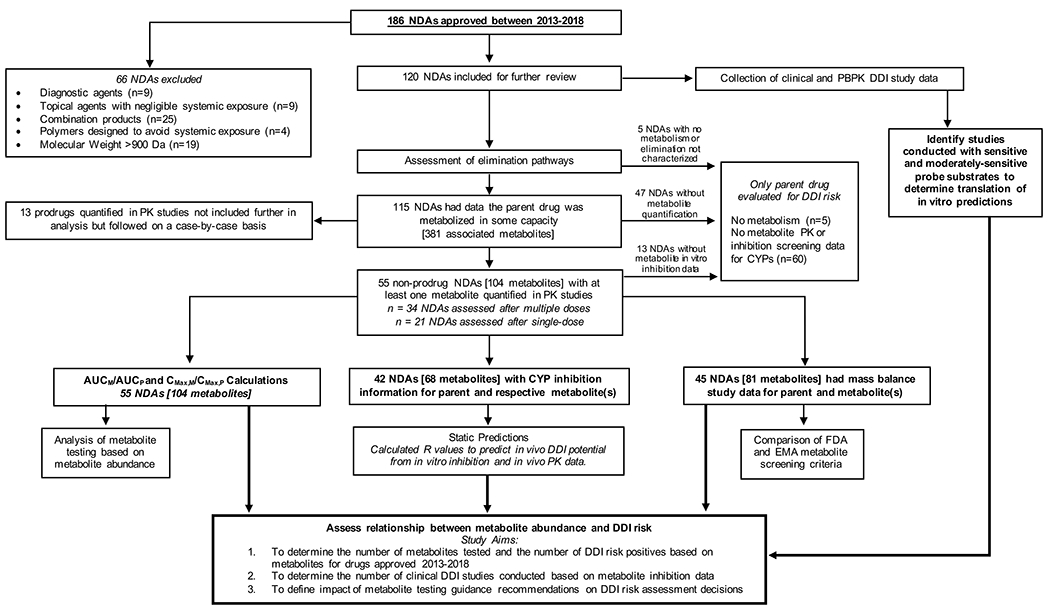
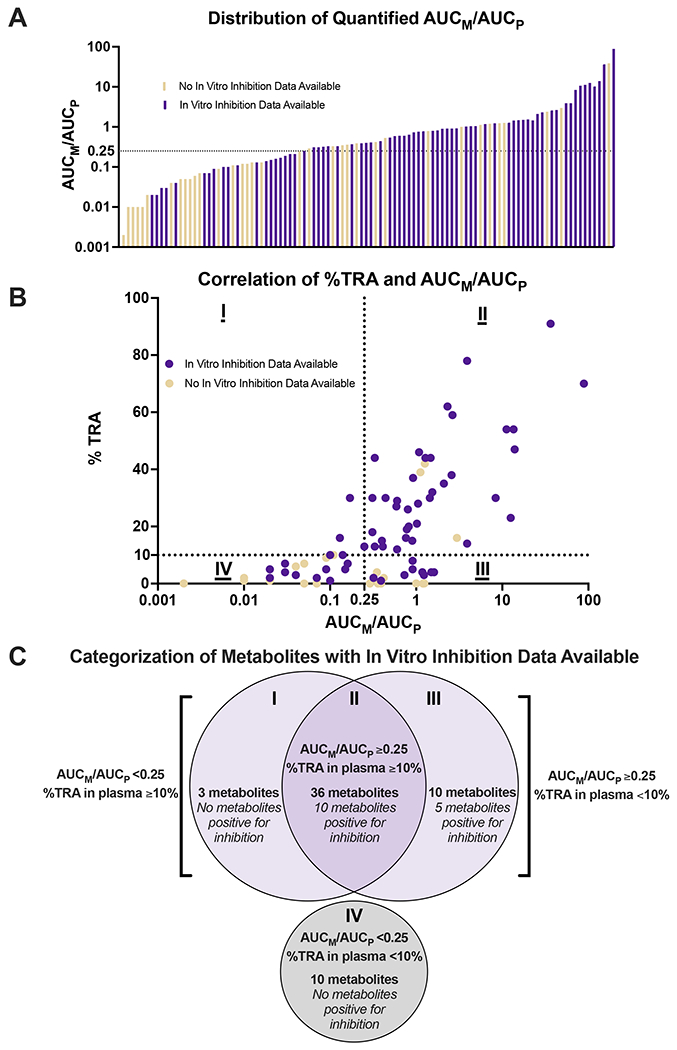
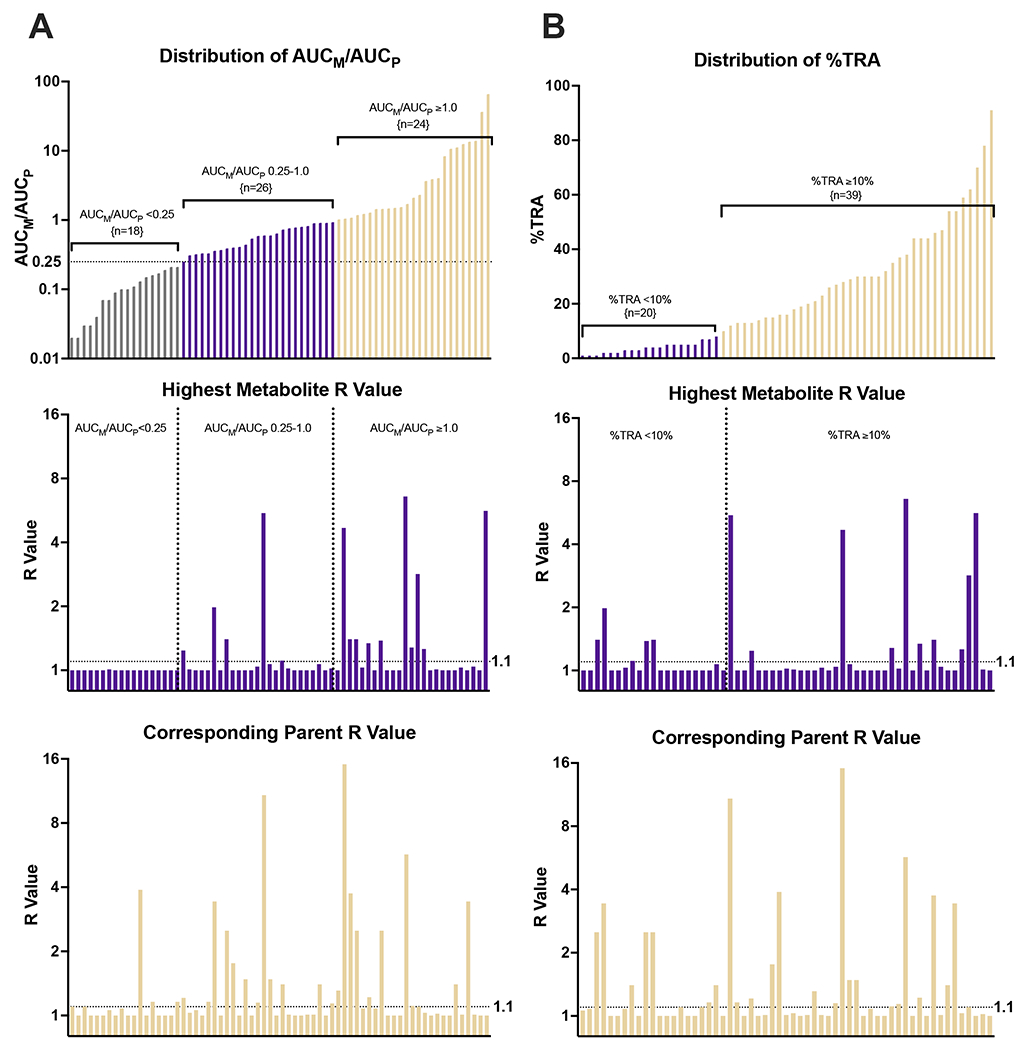
Evaluating the potential of new drugs and their metabolites to cause drug-drug interactions (DDIs) is critical for understanding drug safety and efficacy. Although multiple analyses of proprietary metabolite testing data have been published, no systematic analyses of metabolite data collected according to current testing criteria have been conducted. To address this knowledge gap, 120 new molecular entities approved between 2013 and 2018 were reviewed. Comprehensive data on metabolite-to-parent area under the curve ratios (AUCM /AUCP ), inhibitory potency of parent and metabolites, and clinical DDIs were collected. Sixty-four percent of the metabolites quantified in vivo had AUCM /AUCP ≥ 0.25 and 75% of these metabolites were tested for cytochrome P450 (CYP) inhibition in vitro, resulting in 15 metabolites with potential DDI risk identification. Although 50% of the metabolites with AUCM /AUCP < 0.25 were also tested in vitro, none of them showed meaningful CYP inhibition potential. The metabolite percentage of plasma total radioactivity cutoff of ≥ 10% did not appear to add value to metabolite testing strategies. No relationship between metabolite versus parent drug polarity and inhibition potency was observed. Comparison of metabolite and parent maximum concentration (Cmax ) divided by inhibition constant (Ki ) values suggested that metabolites can contribute to in vivo DDIs and, hence, quantitative prediction of clinical DDI magnitude may require both parent and metabolite data. This systematic analysis of metabolite data for newly approved drugs supports an AUCM /AUCP cutoff of ≥ 0.25 to warrant metabolite in vitro CYP screening to adequately characterize metabolite inhibitory DDI potential and support quantitative DDI predictions.
© 2021 The Authors. Clinical Pharmacology & Therapeutics © 2021 American Society for Clinical Pharmacology and Therapeutics.
Figures
Similar articles
-
Drug metabolites as cytochrome p450 inhibitors: a retrospective analysis and proposed algorithm for evaluation of the pharmacokinetic interaction potential of metabolites in drug discovery and development.Drug Metab Dispos. 2013 Dec;41(12):2047-55. doi: 10.1124/dmd.113.052241. Epub 2013 Jun 21. Drug Metab Dispos. 2013. PMID: 23792812
-
A perspective on the contribution of metabolites to drug-drug interaction potential: the need to consider both circulating levels and inhibition potency.Drug Metab Dispos. 2013 Mar;41(3):536-40. doi: 10.1124/dmd.112.048892. Epub 2012 Nov 9. Drug Metab Dispos. 2013. PMID: 23143892
-
Are circulating metabolites important in drug-drug interactions?: Quantitative analysis of risk prediction and inhibitory potency.Clin Pharmacol Ther. 2011 Jan;89(1):105-13. doi: 10.1038/clpt.2010.252. Epub 2010 Dec 1. Clin Pharmacol Ther. 2011. PMID: 21124313 Free PMC article.
-
Are circulating metabolites important in pharmacokinetic drug-drug interactions? A retroanalysis of clinical data.Curr Drug Metab. 2014;15(8):767-90. doi: 10.2174/1389200216666150223152113. Curr Drug Metab. 2014. PMID: 25705906 Review.
-
Predicting inhibitory drug-drug interactions and evaluating drug interaction reports using inhibition constants.Ann Pharmacother. 2005 Jun;39(6):1064-72. doi: 10.1345/aph.1E508. Epub 2005 May 10. Ann Pharmacother. 2005. PMID: 15886285 Review.
Cited by
-
Utilization of a Human Liver Tissue Chip for Drug-Metabolizing Enzyme Induction Studies of Perpetrator and Victim Drugs.bioRxiv [Preprint]. 2024 Jul 22:2024.07.17.603946. doi: 10.1101/2024.07.17.603946. bioRxiv. 2024. Update in: Drug Metab Dispos. 2025 Jan;53(1):100004. doi: 10.1124/dmd.124.001497. PMID: 39091853 Free PMC article. Updated. Preprint.
-
Pharmacokinetic Interaction Between Olaparib and Regorafenib in an Animal Model.Pharmaceutics. 2024 Dec 9;16(12):1575. doi: 10.3390/pharmaceutics16121575. Pharmaceutics. 2024. PMID: 39771554 Free PMC article.
-
Isotretinoin and its Metabolites Alter mRNA of Multiple Enzyme and Transporter Genes In Vitro, but Downregulation of Organic Anion Transporting Polypeptide Does Not Translate to the Clinic.Drug Metab Dispos. 2022 Jul;50(7):1042-1052. doi: 10.1124/dmd.122.000882. Epub 2022 May 11. Drug Metab Dispos. 2022. PMID: 35545255 Free PMC article.
References
-
- Obach RS, Walsky RL, Venkatakrishnan K, Houston JB, Tremaine LM. In vitro cytochrome P450 inhibition data and the prediction of drug-drug interactions: Qualitative relationships, quantitative predictions, and the rank-order approach. Clin Pharmacol Ther. 2005;78(6):582–592. doi:10.1016/j.clpt.2005.09.004 - DOI - PubMed
-
- Brown HS, Ito K, Galetin A, Houston JB. Prediction of in vivo drug-drug interactions from in vitro data: Impact of incorporating parallel pathways of drug elimination and inhibitor absorption rate constant. Br J Clin Pharmacol. 2005;60(5):508–518. doi:10.1111/j.1365-2125.2005.02483.x - DOI - PMC - PubMed
Publication types
MeSH terms
Substances
Grants and funding
LinkOut - more resources
Full Text Sources
Other Literature Sources
Medical
Miscellaneous
