

Species on the move around the Australian coastline: A continental-scale review of climate-driven species redistribution in marine systems
- PMID: 33835618
- PMCID: PMC8251616
- DOI: 10.1111/gcb.15634
Species on the move around the Australian coastline: A continental-scale review of climate-driven species redistribution in marine systems
Abstract
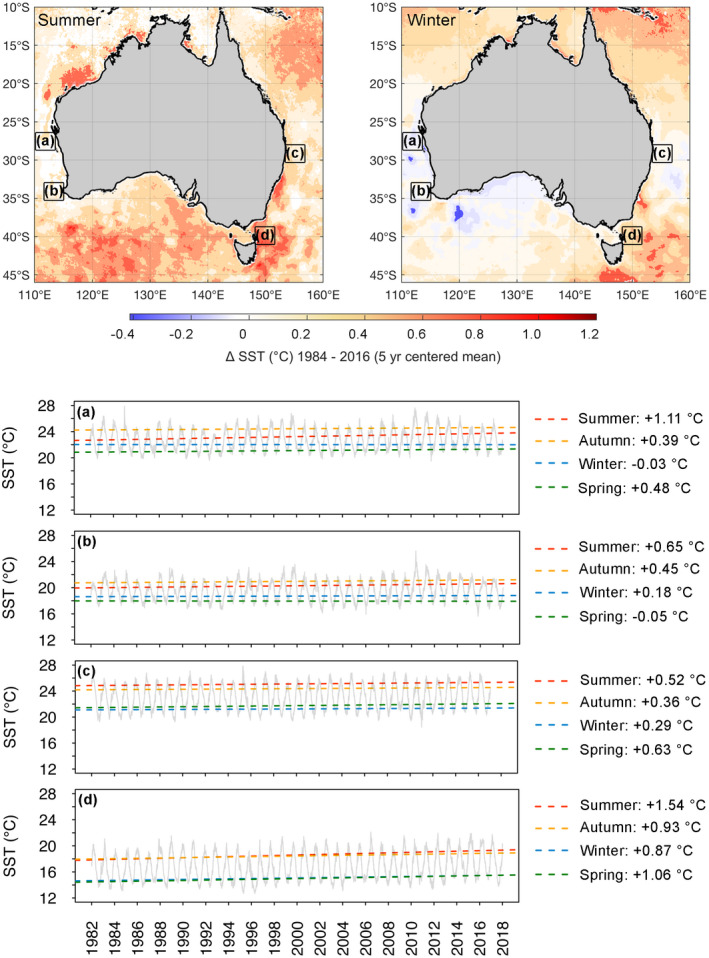
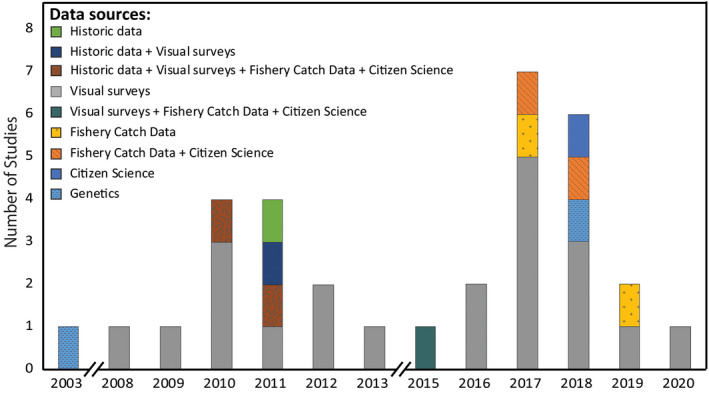
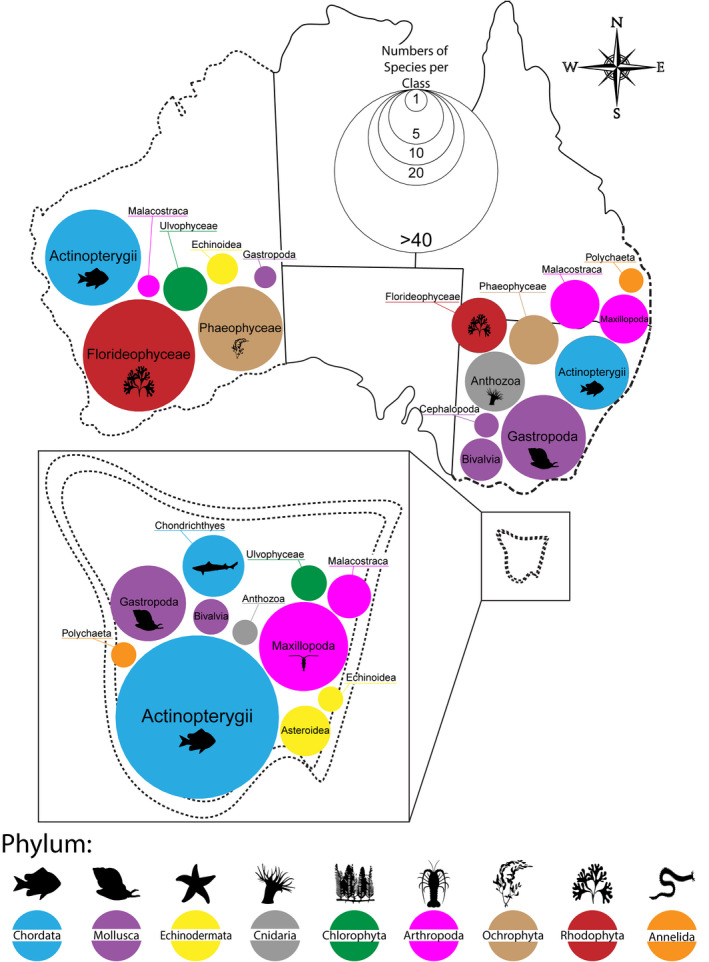
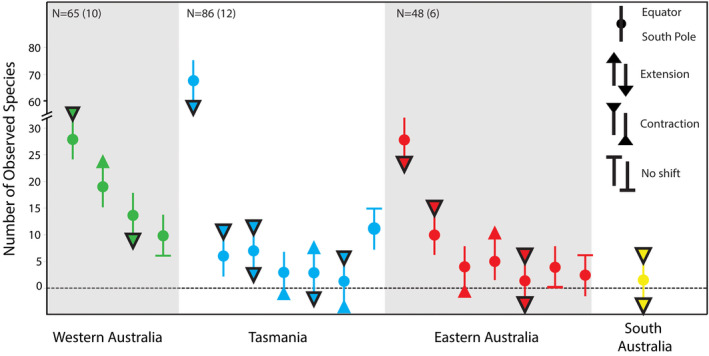
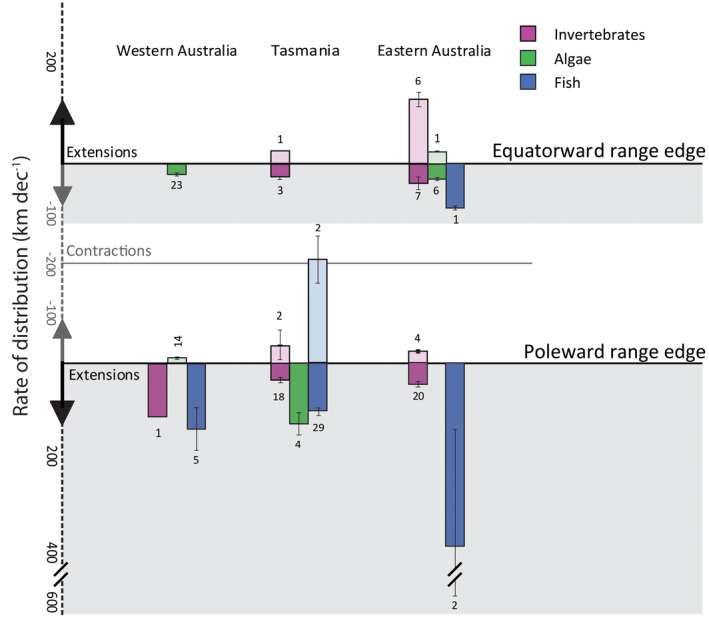
Climate-driven changes in the distribution of species are a pervasive and accelerating impact of climate change, and despite increasing research effort in this rapidly emerging field, much remains unknown or poorly understood. We lack a holistic understanding of patterns and processes at local, regional and global scales, with detailed explorations of range shifts in the southern hemisphere particularly under-represented. Australian waters encompass the world's third largest marine jurisdiction, extending from tropical to sub-Antarctic climate zones, and have waters warming at rates twice the global average in the north and two to four times in the south. Here, we report the results of a multi-taxon continent-wide review describing observed and predicted species redistribution around the Australian coastline, and highlight critical gaps in knowledge impeding our understanding of, and response to, these considerable changes. Since range shifts were first reported in the region in 2003, 198 species from nine Phyla have been documented shifting their distribution, 87.3% of which are shifting poleward. However, there is little standardization of methods or metrics reported in observed or predicted shifts, and both are hindered by a lack of baseline data. Our results demonstrate the importance of historical data sets and underwater visual surveys, and also highlight that approximately one-fifth of studies incorporated citizen science. These findings emphasize the important role the public has had, and can continue to play, in understanding the impact of climate change. Most documented shifts are of coastal fish species in sub-tropical and temperate systems, while tropical systems in general were poorly explored. Moreover, most distributional changes are only described at the poleward boundary, with few studies considering changes at the warmer, equatorward range limit. Through identifying knowledge gaps and research limitations, this review highlights future opportunities for strategic research effort to improve the representation of Australian marine species and systems in climate-impact research.
Keywords: citizen science; climate change; ecosystem reorganization; historical data; ocean warming; range contraction; range extension; range shift.
© 2021 The Authors. Global Change Biology published by John Wiley & Sons Ltd.
Figures
Similar articles
-
Fish and tips: Historical and projected changes in commercial fish species' habitat suitability in the Southern Hemisphere.Sci Total Environ. 2024 Oct 20;948:174752. doi: 10.1016/j.scitotenv.2024.174752. Epub 2024 Jul 14. Sci Total Environ. 2024. PMID: 39004360
-
Rapid shifts in distribution and high-latitude persistence of oceanographic habitat revealed using citizen science data from a climate change hotspot.Glob Chang Biol. 2018 Nov;24(11):5440-5453. doi: 10.1111/gcb.14398. Epub 2018 Aug 1. Glob Chang Biol. 2018. PMID: 30003633
-
Modelling spatiotemporal trends in range shifts of marine commercial fish species driven by climate change surrounding the Antarctic Peninsula.Sci Total Environ. 2020 Oct 1;737:140258. doi: 10.1016/j.scitotenv.2020.140258. Epub 2020 Jun 18. Sci Total Environ. 2020. PMID: 32783853
-
Tropicalization of temperate ecosystems in North America: The northward range expansion of tropical organisms in response to warming winter temperatures.Glob Chang Biol. 2021 Jul;27(13):3009-3034. doi: 10.1111/gcb.15563. Epub 2021 Mar 17. Glob Chang Biol. 2021. PMID: 33605004 Review.
-
Physiological Traits for Predicting Poleward Extensions in Tropical Fishes: From Lab to Management.Glob Chang Biol. 2025 Apr;31(4):e70213. doi: 10.1111/gcb.70213. Glob Chang Biol. 2025. PMID: 40290058 Free PMC article. Review.
Cited by
-
Poleward bound: adapting to climate-driven species redistribution.Rev Fish Biol Fish. 2022;32(1):231-251. doi: 10.1007/s11160-021-09641-3. Epub 2021 Mar 29. Rev Fish Biol Fish. 2022. PMID: 33814734 Free PMC article. Review.
-
Influence of body size and environmental conditions on parasite assemblages of the black-spotted croaker (Protonibea diacanthus) (Teleostei: Sciaenidae) in northern Australia.Parasitology. 2024 Jul;151(8):864-874. doi: 10.1017/S0031182024001008. Epub 2024 Oct 15. Parasitology. 2024. PMID: 39401946 Free PMC article.
-
A quantitative assessment of continuous versus structured methods for the detection of marine mammals and seabirds via opportunistic shipboard surveys.Sci Rep. 2024 Aug 13;14(1):18796. doi: 10.1038/s41598-024-68512-6. Sci Rep. 2024. PMID: 39138319 Free PMC article.
-
Environmental influences on breeding biology and pup production in Australian fur seals.R Soc Open Sci. 2022 Apr 13;9(4):211399. doi: 10.1098/rsos.211399. eCollection 2022 Apr. R Soc Open Sci. 2022. PMID: 35425634 Free PMC article.
-
Potential for redistribution of post-moult habitat for Eudyptes penguins in the Southern Ocean under future climate conditions.Glob Chang Biol. 2023 Feb;29(3):648-667. doi: 10.1111/gcb.16500. Epub 2022 Nov 9. Glob Chang Biol. 2023. PMID: 36278894 Free PMC article.
References
-
- Antão, L. H. , Bates, A. E. , Blowes, S. A. , Waldock, C. , Supp, S. R. , Magurran, A. E. , Dornelas, M. , & Schipper, A. M. (2020). Temperature‐related biodiversity change across temperate marine and terrestrial systems. Nature Ecology & Evolution, 4, 927–933. - PubMed
-
- Babcock, R. C. , Bustamante, R. H. , Fulton, E. A. , Fulton, D. J. , Haywood, M. D. E. , Hobday, A. J. , Kenyon, R. , Matear, R. J. , Plagányi, E. E. , Richardson, A. J. , & Vanderklift, M. A. (2019). Severe continental‐scale impacts of climate change are happening now: Extreme climate events impact marine habitat forming communities along 45% of Australia’s coast. Frontiers in Marine Science, 6(411). 10.3389/fmars.2019.00411 - DOI
-
- Baird, A. H. , Sommer, B. , & Madin, J. S. (2012). Pole‐ward range expansion of Acropora spp. along the east coast of Australia. Coral Reefs, 31(4), 1063. 10.1007/s00338-012-0928-6 - DOI
-
- Baselga, A. , Lobo, J. M. , Svenning, J. C. , & Araújo, M. B. (2012). Global patterns in the shape of species geographical ranges reveal range determinants. Journal of Biogeography, 39(4), 760–771.
Publication types
MeSH terms
LinkOut - more resources
Full Text Sources
Other Literature Sources
Medical
