

Genome Scale-Differential Flux Analysis reveals deregulation of lung cell metabolism on SARS-CoV-2 infection
- PMID: 33835998
- PMCID: PMC8034727
- DOI: 10.1371/journal.pcbi.1008860
Genome Scale-Differential Flux Analysis reveals deregulation of lung cell metabolism on SARS-CoV-2 infection
Abstract
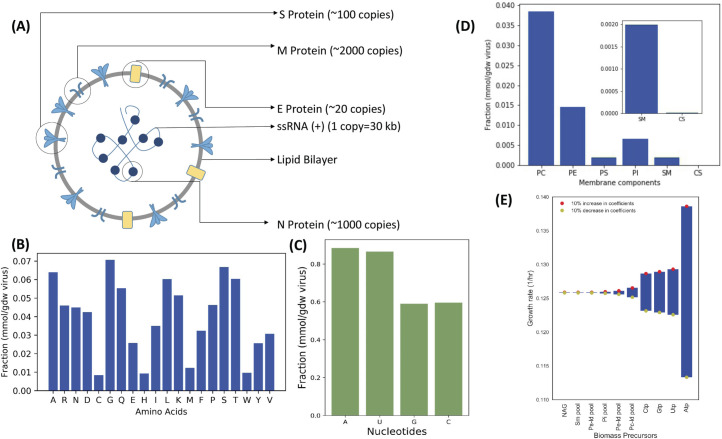
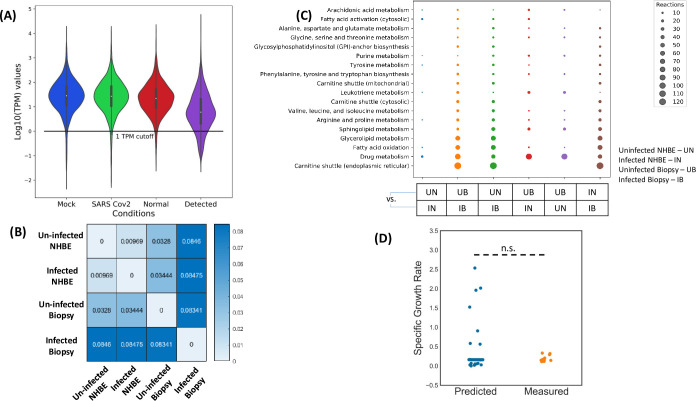
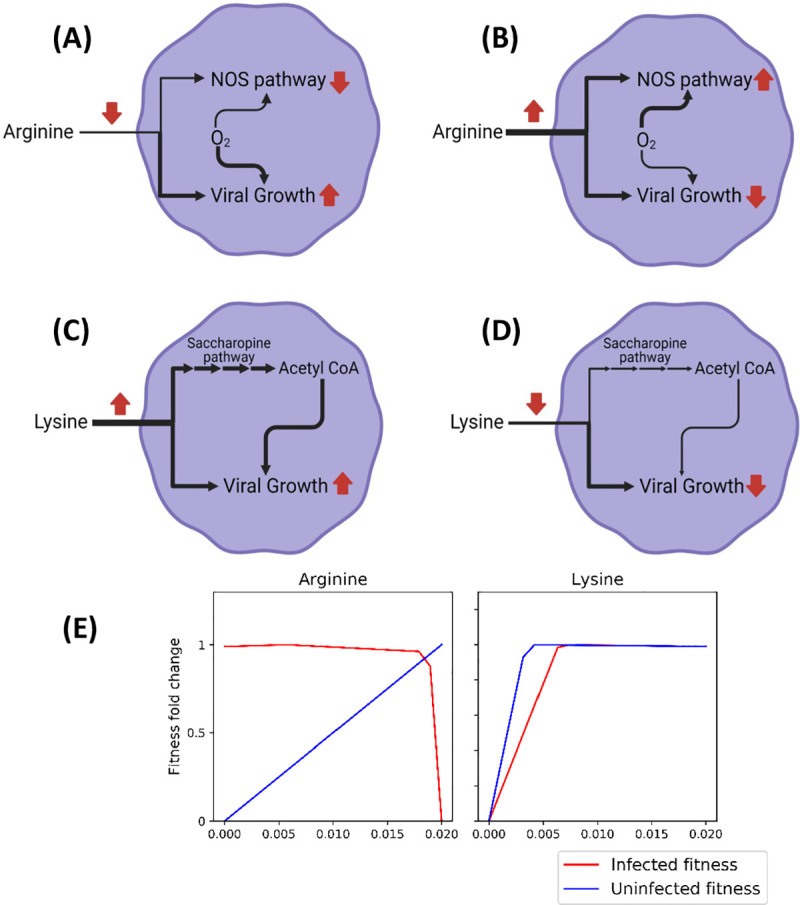
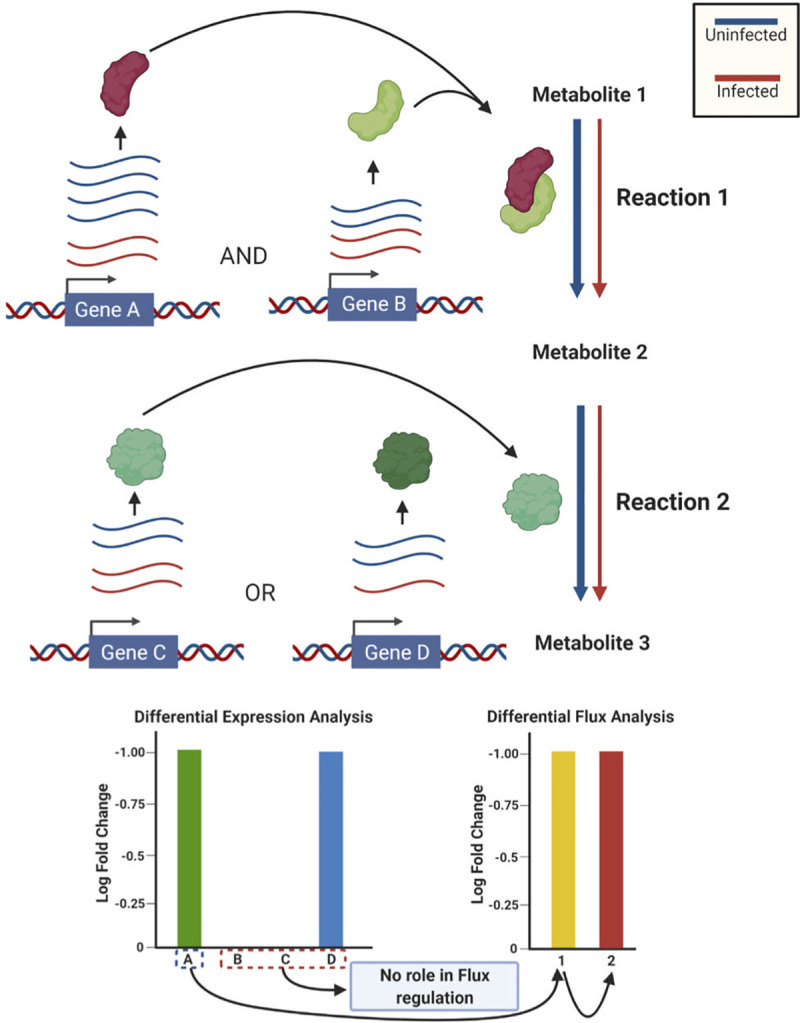
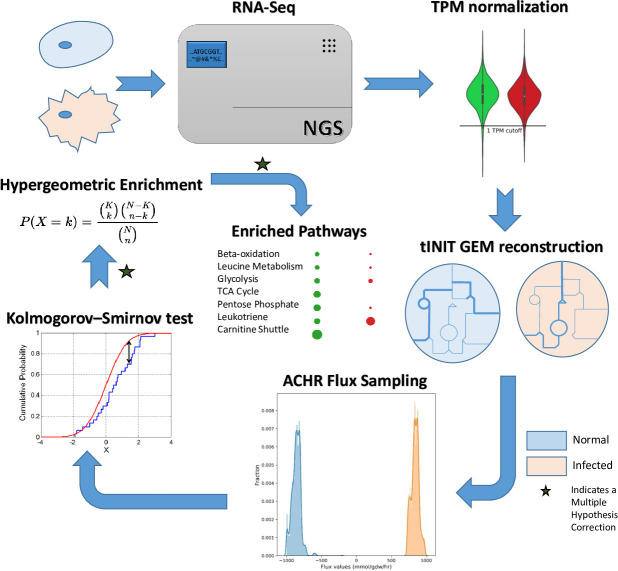
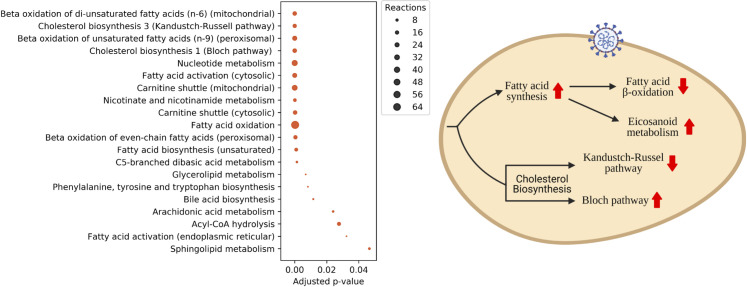
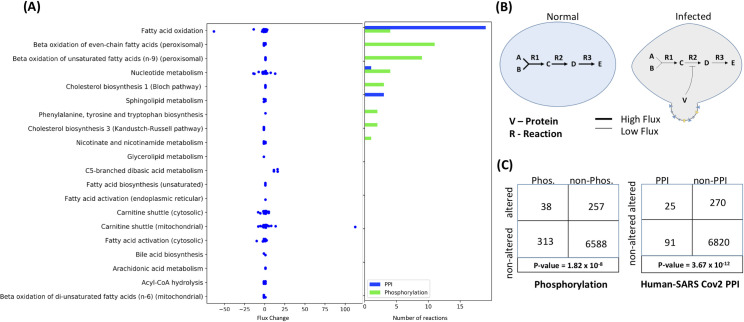
The COVID-19 pandemic is posing an unprecedented threat to the whole world. In this regard, it is absolutely imperative to understand the mechanism of metabolic reprogramming of host human cells by SARS-CoV-2. A better understanding of the metabolic alterations would aid in design of better therapeutics to deal with COVID-19 pandemic. We developed an integrated genome-scale metabolic model of normal human bronchial epithelial cells (NHBE) infected with SARS-CoV-2 using gene-expression and macromolecular make-up of the virus. The reconstructed model predicts growth rates of the virus in high agreement with the experimental measured values. Furthermore, we report a method for conducting genome-scale differential flux analysis (GS-DFA) in context-specific metabolic models. We apply the method to the context-specific model and identify severely affected metabolic modules predominantly comprising of lipid metabolism. We conduct an integrated analysis of the flux-altered reactions, host-virus protein-protein interaction network and phospho-proteomics data to understand the mechanism of flux alteration in host cells. We show that several enzymes driving the altered reactions inferred by our method to be directly interacting with viral proteins and also undergoing differential phosphorylation under diseased state. In case of SARS-CoV-2 infection, lipid metabolism particularly fatty acid oxidation, cholesterol biosynthesis and beta-oxidation cycle along with arachidonic acid metabolism are predicted to be most affected which confirms with clinical metabolomics studies. GS-DFA can be applied to existing repertoire of high-throughput proteomic or transcriptomic data in diseased condition to understand metabolic deregulation at the level of flux.
Conflict of interest statement
The authors have declared that no competing interests exist.
Figures
Similar articles
-
Viral and Host Transcriptomes in SARS-CoV-2-Infected Human Lung Cells.J Virol. 2021 Aug 25;95(18):e0060021. doi: 10.1128/JVI.00600-21. Epub 2021 Aug 25. J Virol. 2021. PMID: 34106002 Free PMC article.
-
Protein Coding and Long Noncoding RNA (lncRNA) Transcriptional Landscape in SARS-CoV-2 Infected Bronchial Epithelial Cells Highlight a Role for Interferon and Inflammatory Response.Genes (Basel). 2020 Jul 7;11(7):760. doi: 10.3390/genes11070760. Genes (Basel). 2020. PMID: 32646047 Free PMC article.
-
Proteome-wide data analysis reveals tissue-specific network associated with SARS-CoV-2 infection.J Mol Cell Biol. 2020 Jun 11;12(12):946-957. doi: 10.1093/jmcb/mjaa033. J Mol Cell Biol. 2020. PMID: 32642770 Free PMC article.
-
Human bronchial-pulmonary proteomics in coronavirus disease 2019 (COVID-19) pandemic: applications and implications.Expert Rev Proteomics. 2021 Nov;18(11):925-938. doi: 10.1080/14789450.2021.2010549. Epub 2021 Dec 19. Expert Rev Proteomics. 2021. PMID: 34812694 Review.
-
Transcriptional landscape of SARS-CoV-2 infection dismantles pathogenic pathways activated by the virus, proposes unique sex-specific differences and predicts tailored therapeutic strategies.Autoimmun Rev. 2020 Jul;19(7):102571. doi: 10.1016/j.autrev.2020.102571. Epub 2020 May 3. Autoimmun Rev. 2020. PMID: 32376402 Free PMC article. Review.
Cited by
-
A path-based analysis of infected cell line and COVID-19 patient transcriptome reveals novel potential targets and drugs against SARS-CoV-2.Res Sq [Preprint]. 2022 Mar 21:rs.3.rs-1474136. doi: 10.21203/rs.3.rs-1474136/v1. Res Sq. 2022. Update in: Front Immunol. 2022 Jul 01;13:918817. doi: 10.3389/fimmu.2022.918817. PMID: 35434729 Free PMC article. Updated. Preprint.
-
New workflow predicts drug targets against SARS-CoV-2 via metabolic changes in infected cells.PLoS Comput Biol. 2023 Mar 23;19(3):e1010903. doi: 10.1371/journal.pcbi.1010903. eCollection 2023 Mar. PLoS Comput Biol. 2023. PMID: 36952396 Free PMC article.
-
A diel multi-tissue genome-scale metabolic model of Vitis vinifera.PLoS Comput Biol. 2024 Oct 10;20(10):e1012506. doi: 10.1371/journal.pcbi.1012506. eCollection 2024 Oct. PLoS Comput Biol. 2024. PMID: 39388487 Free PMC article.
-
Cell-specific genome-scale metabolic modeling of SARS-CoV-2-infected lung to identify antiviral enzymes.FEBS Open Bio. 2023 Dec;13(12):2172-2186. doi: 10.1002/2211-5463.13710. Epub 2023 Sep 30. FEBS Open Bio. 2023. PMID: 37734920 Free PMC article.
-
Metabolic modeling of single bronchoalveolar macrophages reveals regulators of hyperinflammation in COVID-19.iScience. 2022 Oct 10;25(11):105319. doi: 10.1016/j.isci.2022.105319. eCollection 2022 Nov 18. iScience. 2022. PMID: 36246577 Free PMC article.
References
MeSH terms
LinkOut - more resources
Full Text Sources
Other Literature Sources
Medical
Miscellaneous
