. 2021 Oct 11;49(18):10524-10541.
doi: 10.1093/nar/gkab249.

Suppression of liquid-liquid phase separation by 1,6-hexanediol partially compromises the 3D genome organization in living cells

Affiliations

Suppression of liquid-liquid phase separation by 1,6-hexanediol partially compromises the 3D genome organization in living cells

Sergey V Ulianov et al. Nucleic Acids Res. .

Abstract

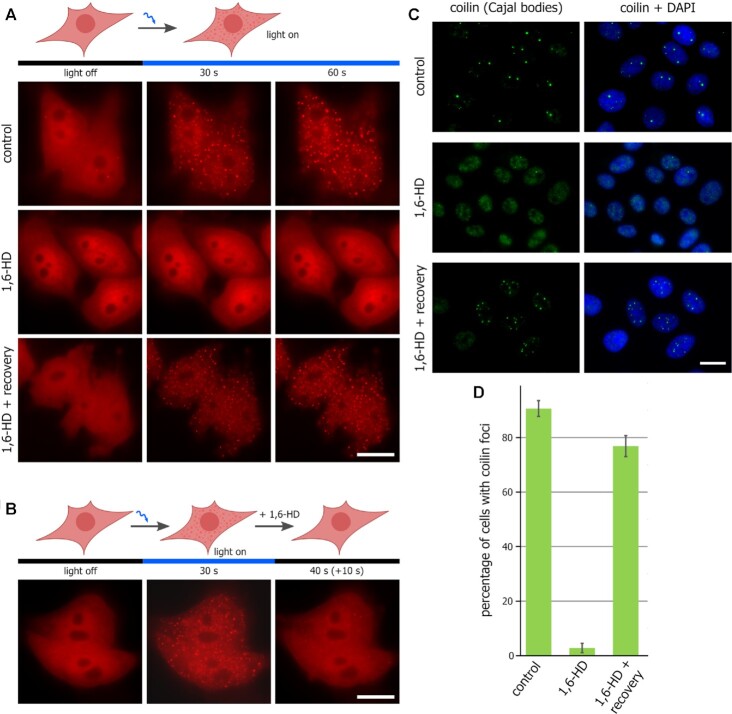
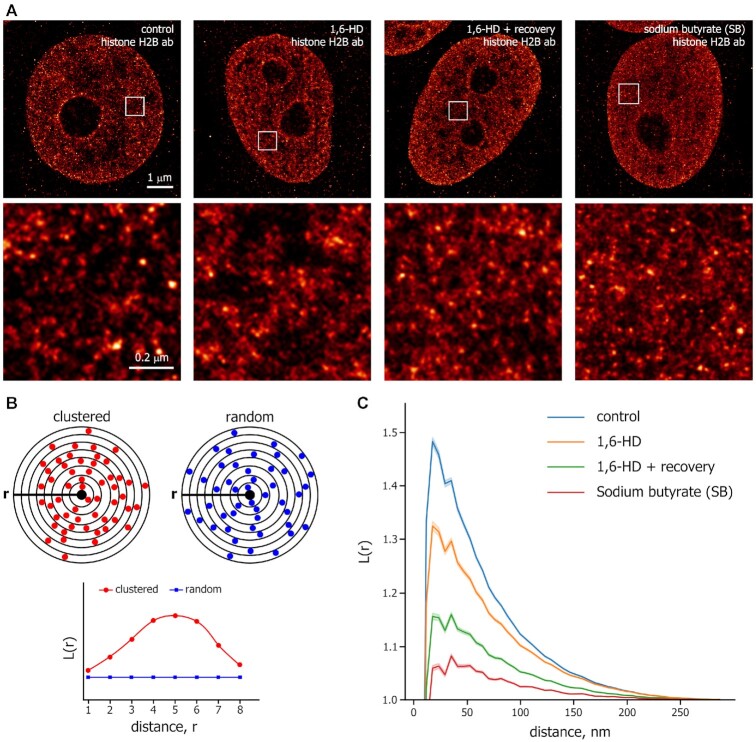
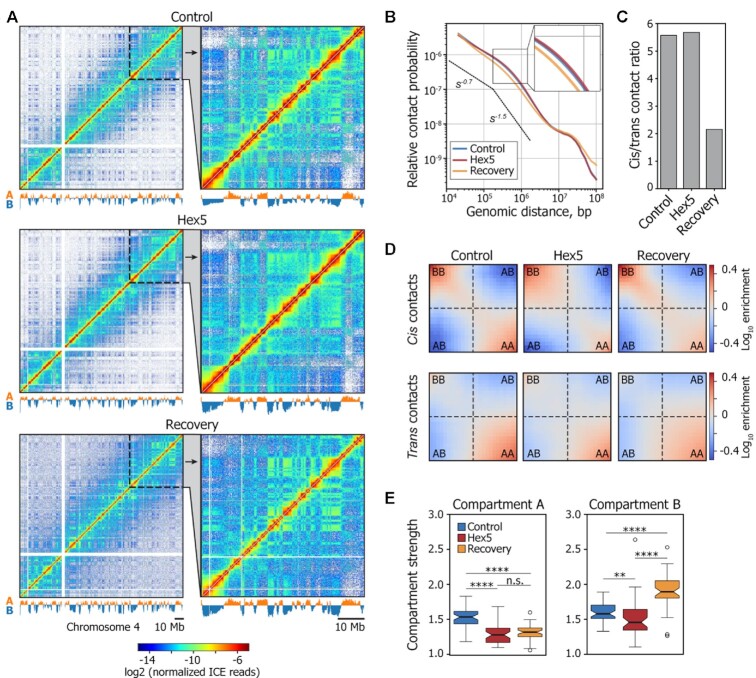
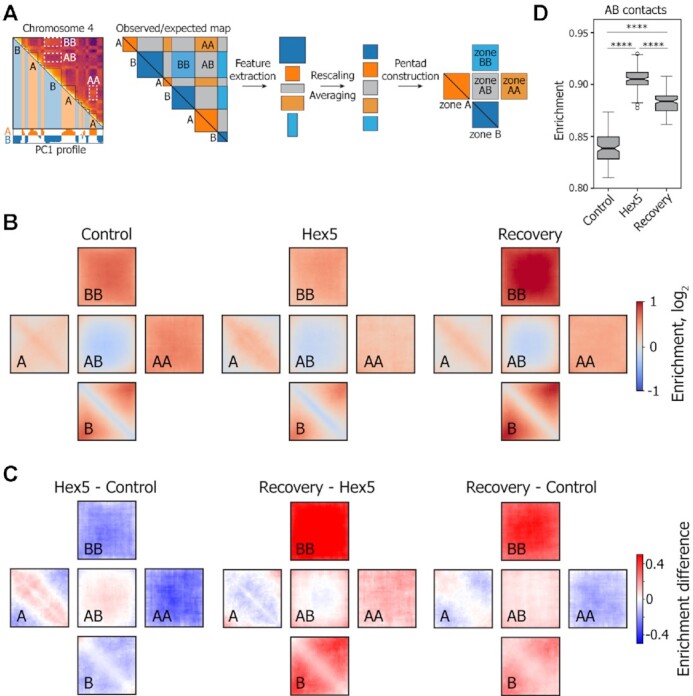
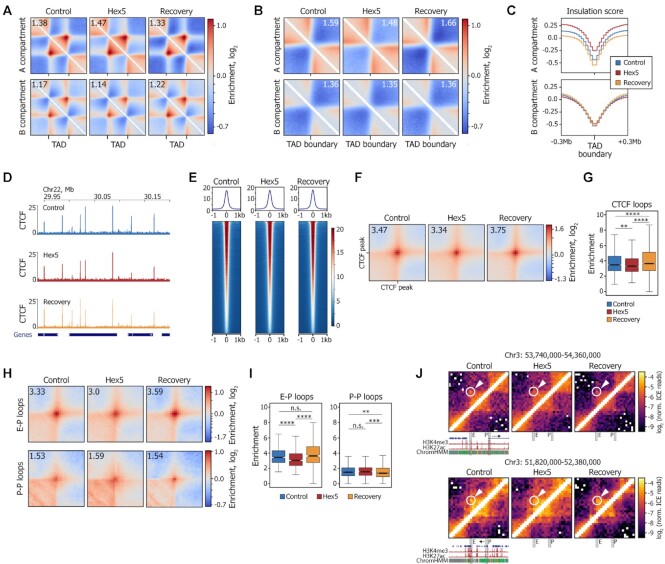
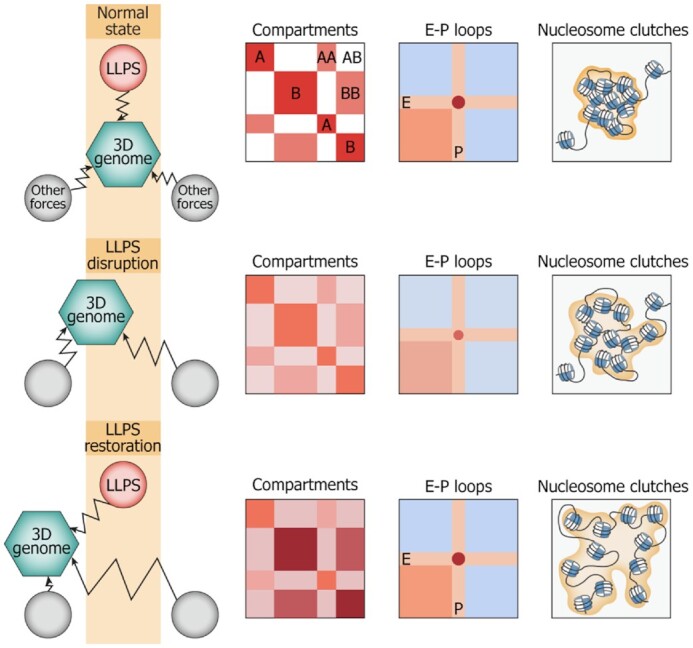
Liquid-liquid phase separation (LLPS) contributes to the spatial and functional segregation of molecular processes within the cell nucleus. However, the role played by LLPS in chromatin folding in living cells remains unclear. Here, using stochastic optical reconstruction microscopy (STORM) and Hi-C techniques, we studied the effects of 1,6-hexanediol (1,6-HD)-mediated LLPS disruption/modulation on higher-order chromatin organization in living cells. We found that 1,6-HD treatment caused the enlargement of nucleosome clutches and their more uniform distribution in the nuclear space. At a megabase-scale, chromatin underwent moderate but irreversible perturbations that resulted in the partial mixing of A and B compartments. The removal of 1,6-HD from the culture medium did not allow chromatin to acquire initial configurations, and resulted in more compact repressed chromatin than in untreated cells. 1,6-HD treatment also weakened enhancer-promoter interactions and TAD insulation but did not considerably affect CTCF-dependent loops. Our results suggest that 1,6-HD-sensitive LLPS plays a limited role in chromatin spatial organization by constraining its folding patterns and facilitating compartmentalization at different levels.


Figures

Figure 1.
Figure 1.
1,6-HD compromises LLPS in living human cells. (A) HeLa cells transfected with pHR-FUSN-mCh-Cry2WT were transiently permeabilized and then either mock-treated (control), treated with 1,6-HD (5%, 15 min), or treated with 1,6-HD and allowed to recover for 1.5 h. OptoDroplet formation was monitored as described in (40). Scale bar: 10 μm. (B) HeLa cells transfected with pHR-FUSN-mCh-Cry2WT were light-illuminated to induce optoDroplet formation. Then 1,6-HD (5%) was added to the culture medium; optoDroplet existence was monitored after ten seconds of incubation with the drug. Scale bar: 10 μm. (C) Transiently permeabilized HeLa cells were untreated (control), treated with 1,6-HD (5%, 15 min), or treated with 1,6-HD and allowed to recover for 1.5 h before being stained for coilin (green). Scale bar: 15 μm. (D) Quantification of the samples presented in (C). Percentage of cells containing coilin foci (i.e. Cajal bodies) are shown.
Figure 2.
Figure 2.
Super-resolution microscopy analysis of chromatin organization changes induced by 1,6-HD. (A) Representative STORM images of H2B in human HeLa cells that had been permeabilized with Tween 20 and either untreated (control), treated with 1,6-HD (5%, 15 min), treated with 1,6-HD and then incubated in a drug-free medium for 1.5 h, and non-permeabilized cells treated with sodium butyrate (SB; 5 mM, 14 h). Scale bar: 1 μm. Magnified images from the boxed regions in the image of each nucleus are shown. Scale bar: 0.2 μm. (B) A simplified scheme for L-function analysis. The scheme shows clustered (red circles) or random (blue circles) particles around the origin point (black circle). L-function plots of clustered and random patterns are shown. (C) L-function plots of chromatin using the same conditions as described in (A). The shaded parts of the curves represent 95% confidence intervals (CIs). For each condition, n = 14–23 cells.
Figure 3.
Figure 3.
1,6-HD treatment alters the strength of A and B compartments. (A) Visualization of Control, Hex5, and Recovery contact matrices at a 100-kb resolution. The compartment profiles are shown below the maps. (B) Dependence of contact probability, Pc(s), on genomic distance, s, for Control, Hex5, and Recovery samples. Black lines show the slopes for Pc(s) = s0.75 and Pc(s) = s1.5. A magnified view of a section of the graph is presented in the top-right corner of the picture. Note that the Control and Hex5 curves are almost completely merged. (C) Ratio between cis (intrachromosomal) and trans (interchromosomal) contacts in Control, Hex5 and Recovery contact matrices. (D) Heatmaps (saddle plots) showing log10 values of contact enrichments between genomic regions belonging to A and B compartments. (E) Compartment strength in cis in Control, Hex5, and Recovery contact matrices. ****P < 0.0001, **P < 0.01, n.s. – non-significant difference in a Mann–Whitney U-test.
Figure 4.
Figure 4.
Pentad analysis of A and B compartments upon 1,6-HD treatment. (A) Schematic representation of the principal of pentad analysis. (B) Plots (pentads) showing the observed-over-expected contact frequencies inside the A and B compartments at short (A, B; compartmental domains) and large genomic distances (AA, BB) and between compartments (AB). (C) Pairwise subtractions of Control, Hex5, and Recovery pentads. (D) Boxplots showing the contact frequencies between the A and B compartments. ****P < 0.0001 in a Mann–Whitney U-test.
Figure 5.
Figure 5.
1,6-HD treatment reversibly changes TAD compaction, does not affect CTCF binding, and compromises enhancer-promoter interactions. (A) Average TADs for the Control, Hex5, and Recovery samples. Number in the upper-left corner shows the enrichment of contacts inside the TAD square over the background. (B) Average TAD boundary for the Control, Hex5, and Recovery samples. Number in the upper-right corner shows the boundary strength calculated as the mean value of the average intra-TAD interactions (upper-left and bottom-right quarters) divided by the mean value of average inter-TAD interactions (upper-right quarter). (C) Averaged insulation score profile around TAD boundaries (±0.3 Mb). (D) Examples of CTCF-binding profiles in the Control, Hex5, and Recovery samples. The dark-blue rectangles below the profiles schematically show gene positions. (E) Heatmaps of CTCF ChIP-seq signal centered at CTCF peak position (±1 kb). (F) Average CTCF-mediated loop. Number in the upper-left corner shows the enrichment of contacts inside the loop pixel over the background. (G) Related to (F): boxplots showing the enrichment of observed signal over expected in the central pixel of the corresponding average loop plot. ****P < 0.0001, **P < 0.01 in a Mann–Whitney U-test. (H) Average enhancer- (E–P) and promoter–promoter (P–P) loops. Number in the upper-left corner shows the enrichment of contacts inside the loop pixel over the background. (I) Related to (H): boxplots showing the enrichment of observed signal over expected in the central pixel of the average CTCF loop plot. ****P < 0.0001, ***P < 0.001, **P < 0.01, n.s. – non-significant difference in a Mann–Whitney U-test. (J) Representative examples of weakened E–P loops following 1,6-HD treatment. Loop pixels are highlighted with a circle and arrow. E, enhancer region, P, promoter region. H3K4me3, H3K27ac, chromatin state (ChromHMM), and gene profiles are shown according to the UCSC genome browser. The resolution of the Hi-C maps is 20 kb.
Figure 6.
Figure 6.
Schematic summarizing all of the obtained results. LLPS is a part of a ‘check-and-balances system’ of different forces shaping the 3D genome. LLPS disruption affects the system, resulting in the partial compromise of nucleosome clutch assemblies, decrease in compartment strength, and enhancer-promoter communication. LLPS restoration in such an unbalanced system does not allow chromatin to adopt its initial configuration but results in a new configuration.

Similar articles

Cited by

References

    1. Lieberman-Aiden E., van Berkum N.L., Williams L., Imakaev M., Ragoczy T., Telling A., Amit I., Lajoie B.R., Sabo P.J., Dorschner M.O.et al. .. Comprehensive mapping of long-range interactions reveals folding principles of the human genome. Science. 2009; 326:289–293. - PMC - PubMed
    1. Dixon J.R., Selvaraj S., Yue F., Kim A., Li Y., Shen Y., Hu M., Liu J.S., Ren B.. Topological domains in mammalian genomes identified by analysis of chromatin interactions. Nature. 2012; 485:376–380. - PMC - PubMed
    1. Nora E.P., Lajoie B.R., Schulz E.G., Giorgetti L., Okamoto I., Servant N., Piolot T., van Berkum N.L., Meisig J., Sedat J.et al. .. Spatial partitioning of the regulatory landscape of the X-inactivation centre. Nature. 2012; 485:381–385. - PMC - PubMed
    1. Rao S.S., Huntley M.H., Durand N.C., Stamenova E.K., Bochkov I.D., Robinson J.T., Sanborn A.L., Machol I., Omer A.D., Lander E.S.et al. .. A 3D map of the human genome at kilobase resolution reveals principles of chromatin looping. Cell. 2014; 159:1665–1680. - PMC - PubMed
    1. Rowley M.J., Nichols M.H., Lyu X., Ando-Kuri M., Rivera I.S.M., Hermetz K., Wang P., Ruan Y., Corces V.G.. Evolutionarily conserved principles predict 3D chromatin organization. Mol. Cell. 2017; 67:837–852. - PMC - PubMed

Publication types