. 2021 May 6;108(5):825-839.
doi: 10.1016/j.ajhg.2021.03.019. Epub 2021 Apr 8.

Efficient mixed model approach for large-scale genome-wide association studies of ordinal categorical phenotypes

Affiliations

Efficient mixed model approach for large-scale genome-wide association studies of ordinal categorical phenotypes

Wenjian Bi et al. Am J Hum Genet. .

Abstract

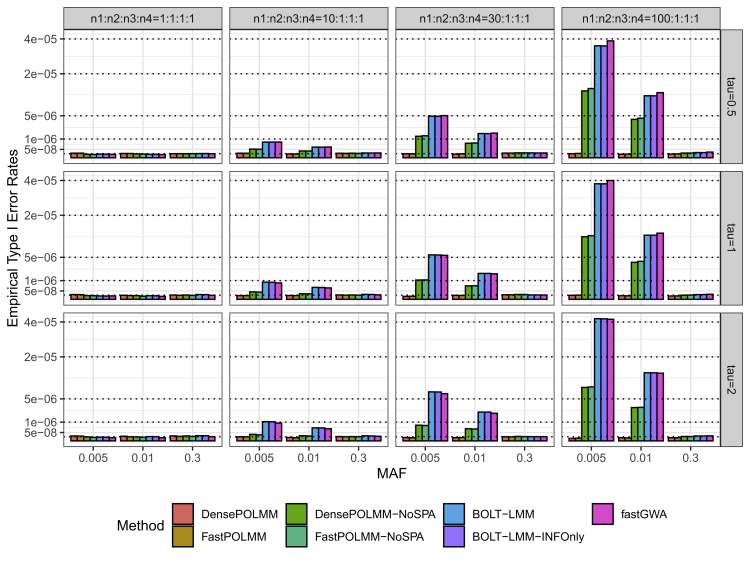
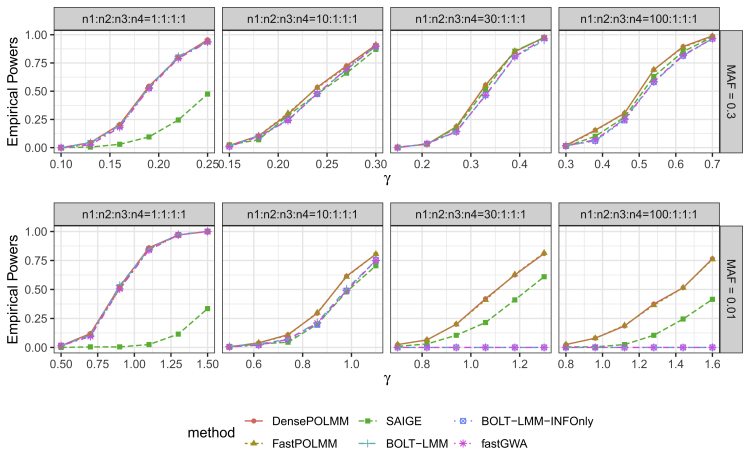
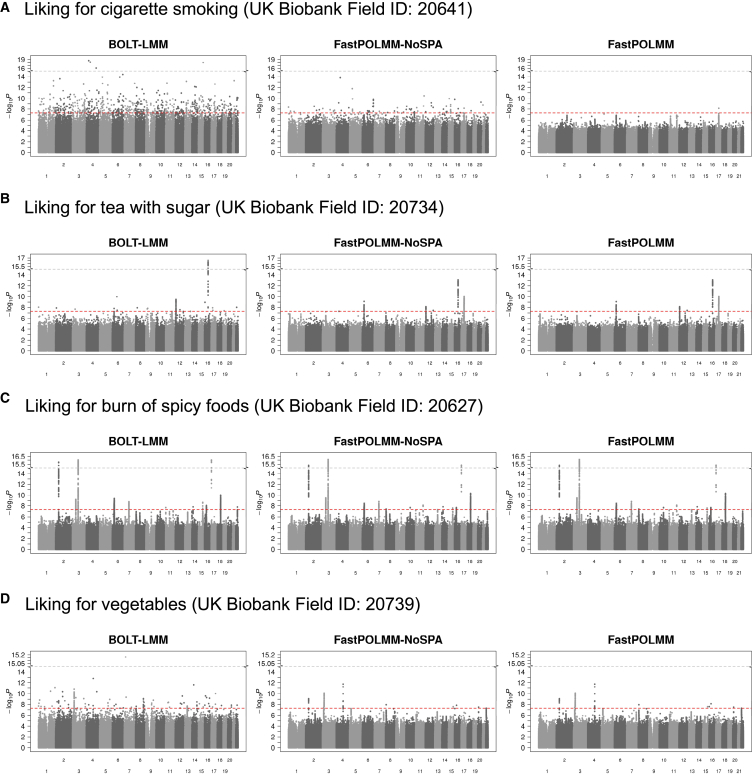
In genome-wide association studies, ordinal categorical phenotypes are widely used to measure human behaviors, satisfaction, and preferences. However, because of the lack of analysis tools, methods designed for binary or quantitative traits are commonly used inappropriately to analyze categorical phenotypes. To accurately model the dependence of an ordinal categorical phenotype on covariates, we propose an efficient mixed model association test, proportional odds logistic mixed model (POLMM). POLMM is computationally efficient to analyze large datasets with hundreds of thousands of samples, can control type I error rates at a stringent significance level regardless of the phenotypic distribution, and is more powerful than alternative methods. In contrast, the standard linear mixed model approaches cannot control type I error rates for rare variants when the phenotypic distribution is unbalanced, although they performed well when testing common variants. We applied POLMM to 258 ordinal categorical phenotypes on array genotypes and imputed samples from 408,961 individuals in UK Biobank. In total, we identified 5,885 genome-wide significant variants, of which, 424 variants (7.2%) are rare variants with MAF < 0.01.

Keywords: GRM; GWAS; POLMM; PheWAS; UK Biobank; food and other preferences; genetic relationship matrix; genome-wide association studies; mixed model approach; ordinal categorical data; phenome-wide association studies; proportional odds logistic mixed model; saddlepoint approximation; unbalanced phenotypic distribution.


Conflict of interest statement

The authors declare no competing interests.

Figures

Figure 1
Figure 1
Empirical type I error rates of POLMM, BOLT-LMM, and fastGWA methods at a significance level 5×10⁻⁸ We simulated 1,000 families with a total sample size n= 10,000 and an ordinal categorical phenotype including four levels with sample sizes n1, n2, n3, and n4. From left to right, the plots consider four scenarios: balanced (n1:n2:n3:n4=1:1:1:1), moderately unbalanced (n1:n2:n3:n4=10:1:1:1), unbalanced (n1:n2:n3:n4=30:1:1:1), and extremely unbalanced (n1:n2:n3:n4=100:1:1:1). From top to bottom, the plots consider three variance components, tau, τ= 0.5, 1, and 2. We simulated common, low-frequency, and rare variants with MAFs of 0.3, 0.01, and 0.005, respectively. In total, 109 replications were conducted in each scenario.
Figure 2
Figure 2
Empirical powers of POLMM, SAIGE, BOLT-LMM, and fastGWA methods at significance level 5×10⁻⁸ We simulated 1,000 families with a total sample size n= 10,000 and an ordinal categorical phenotype including four levels with sample sizes n1, n2, n3, and n4. From left to right, the plots consider four scenarios: balanced (n1:n2:n3:n4=1:1:1:1), moderately unbalanced (n1:n2:n3:n4=10:1:1:1), unbalanced (n1:n2:n3:n4=30:1:1:1), and extremely unbalanced (n1:n2:n3:n4=100:1:1:1). From top to bottom, the plots consider two MAFs of 0.3 and 0.01 to simulate common and low-frequency variants. We let the variance component τ=1. For SAIGE, we dichotomize phenotype as 0 or 1 depending on whether the subject is in level 1 or not. For BOLT-LMM, the empirical powers were calculated on the basis of the empirical significance levels because it cannot control type I error rates for low-frequency variants.
Figure 3
Figure 3
Manhattan plots for UK Biobank data analysis The left panels show Manhattan plots based on BOLT-LMM, the middle panels show Manhattan plots based on FastPOLMM-NoSPA, and the right panels show Manhattan plots based on FastPOLMM. The redline represents the genome-wide significance level 5×10⁸.

References

    1. Beesley L.J., Salvatore M., Fritsche L.G., Pandit A., Rao A., Brummett C., Willer C.J., Lisabeth L.D., Mukherjee B. The emerging landscape of health research based on biobanks linked to electronic health records: Existing resources, statistical challenges, and potential opportunities. Stat. Med. 2019;39:773–800. - PMC - PubMed
    1. Gagliano Taliun S.A., VandeHaar P., Boughton A.P., Welch R.P., Taliun D., Schmidt E.M., Zhou W., Nielsen J.B., Willer C.J., Lee S. Exploring and visualizing large-scale genetic associations by using PheWeb. Nat. Genet. 2020;52:550–552. - PMC - PubMed
    1. Lane J.M., Jones S.E., Dashti H.S., Wood A.R., Aragam K.G., van Hees V.T., Strand L.B., Winsvold B.S., Wang H., Bowden J., HUNT All In Sleep Biological and clinical insights from genetics of insomnia symptoms. Nat. Genet. 2019;51:387–393. - PMC - PubMed
    1. Agresti A. John Wiley & Sons; 2003. Categorical data analysis.
    1. Verhulst B., Maes H.H., Neale M.C. GW-SEM: A Statistical Package to Conduct Genome-Wide Structural Equation Modeling. Behav. Genet. 2017;47:345–359. - PMC - PubMed

Publication types

LinkOut - more resources