. 2021 May 11;16(5):1363-1380.
doi: 10.1016/j.stemcr.2021.03.010. Epub 2021 Apr 8.

Efficient conversion of human induced pluripotent stem cells into microglia by defined transcription factors

Affiliations

Efficient conversion of human induced pluripotent stem cells into microglia by defined transcription factors

Shih-Wei Chen et al. Stem Cell Reports. .

Abstract

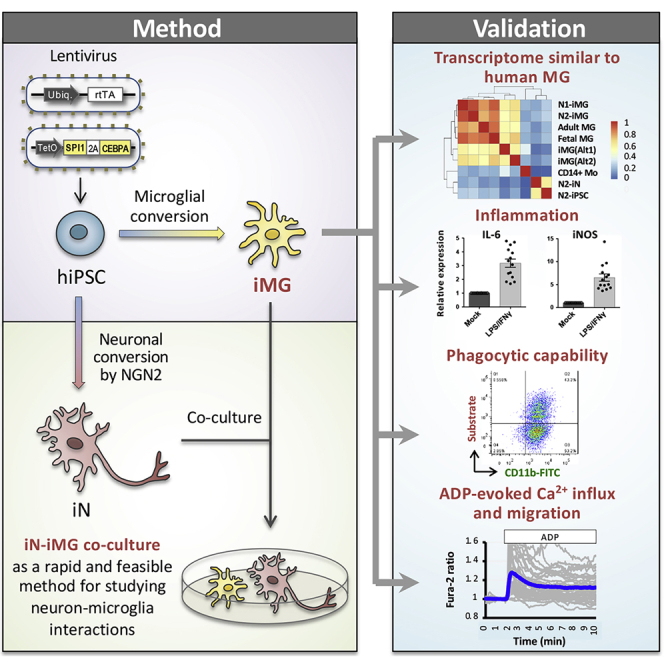
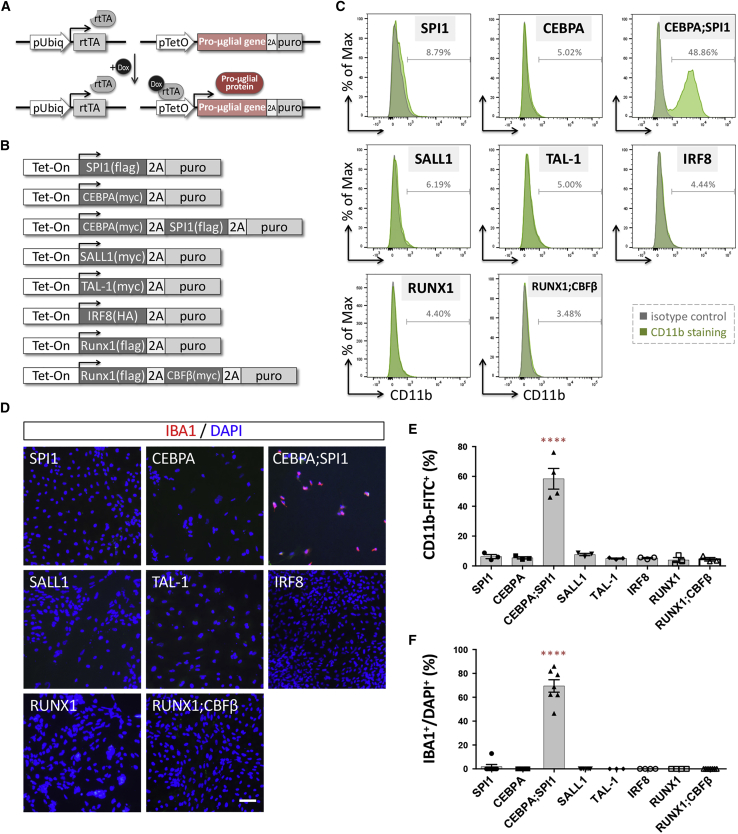
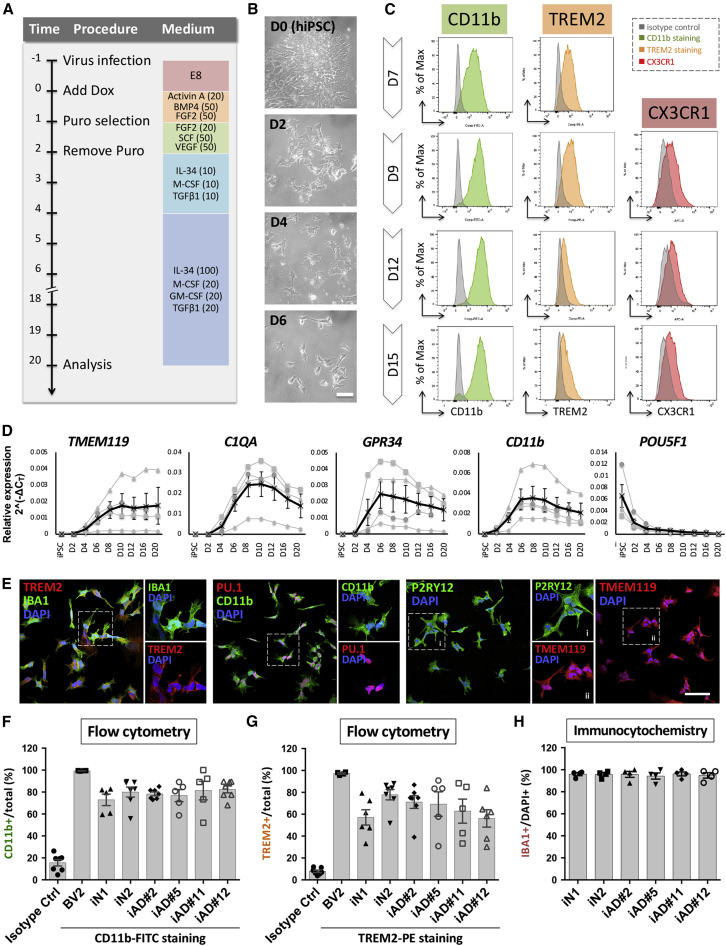
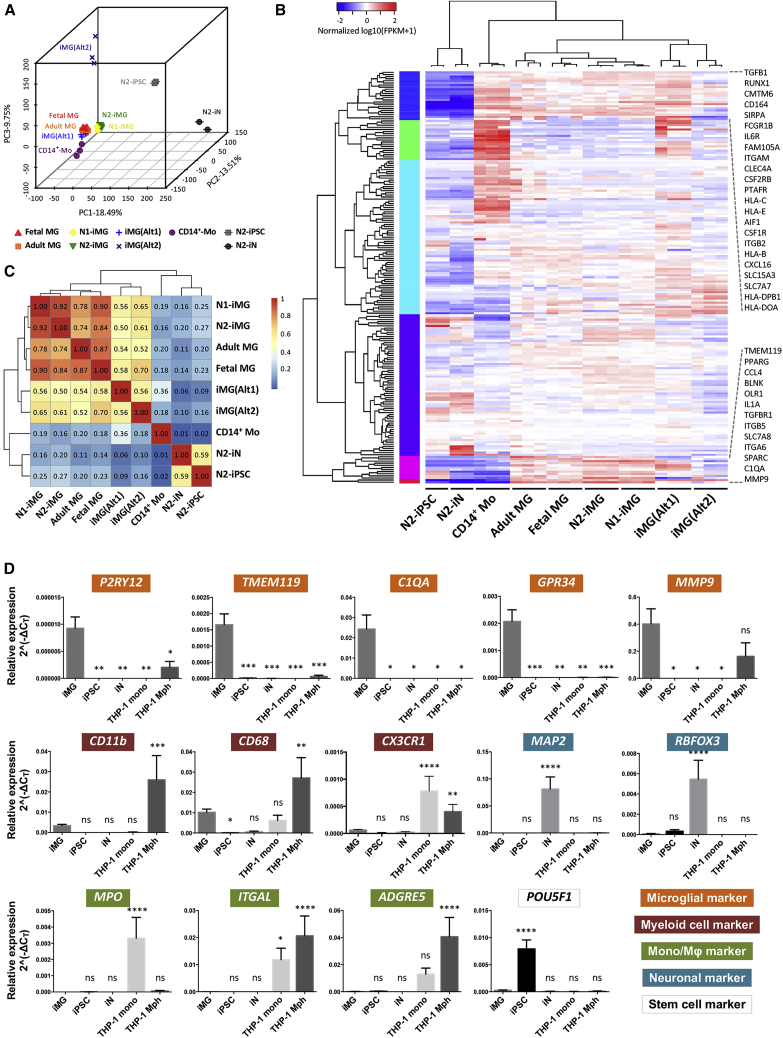
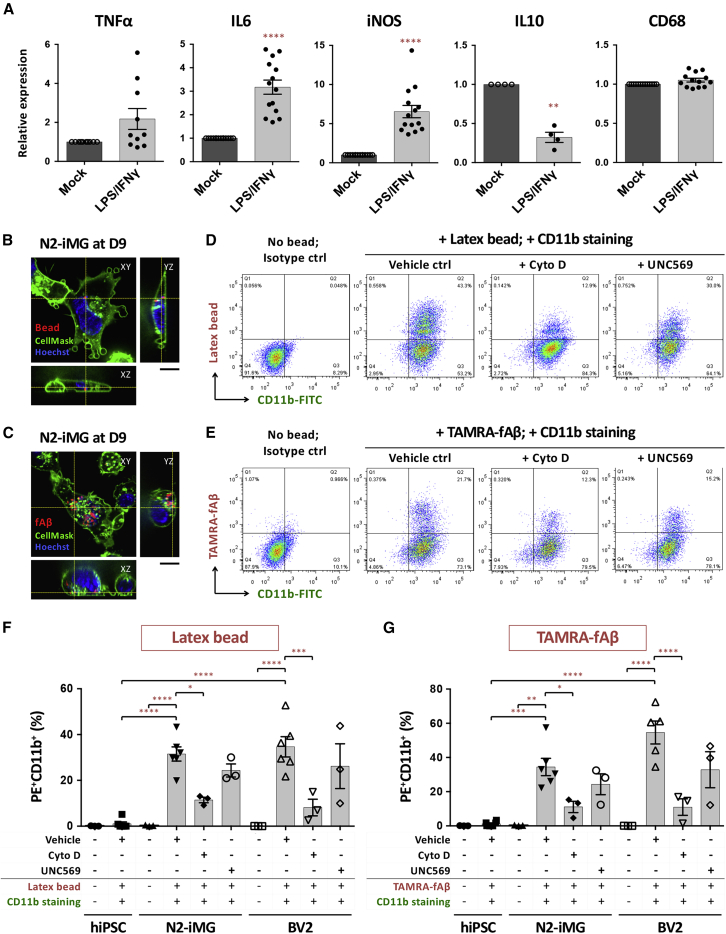
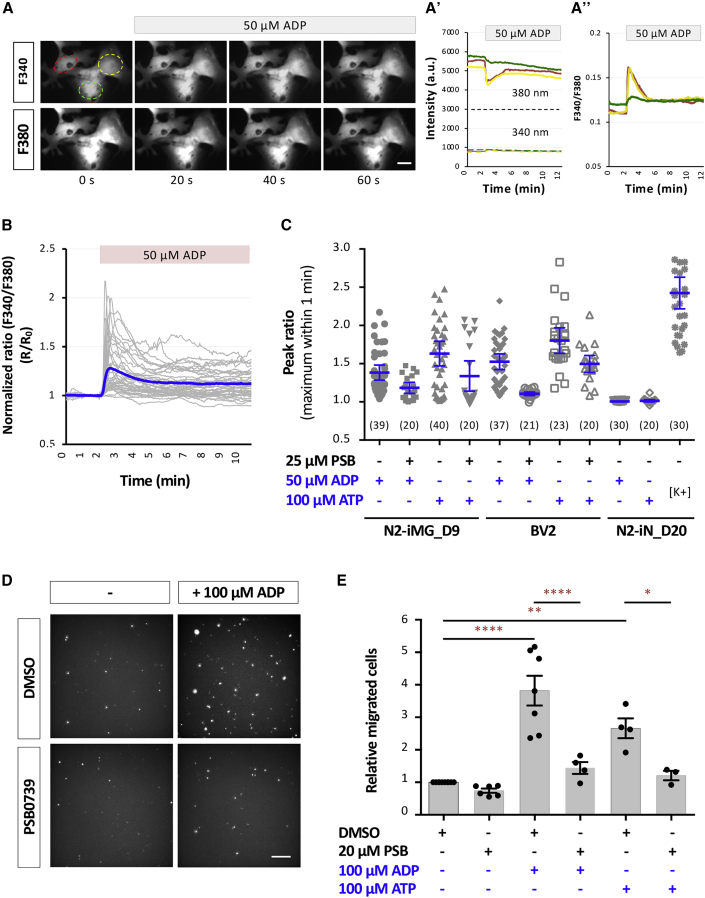
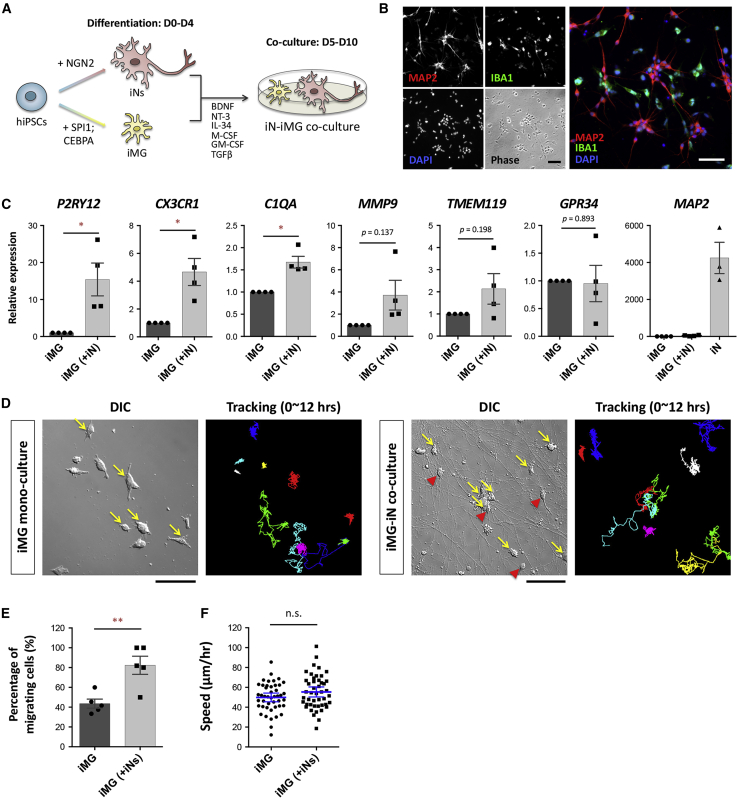
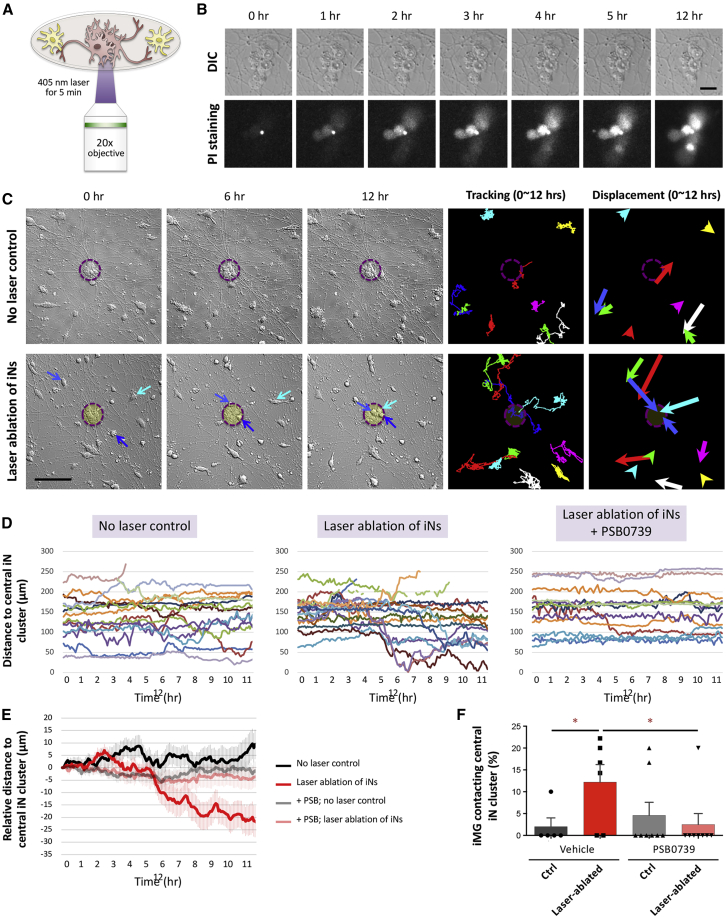
Microglia, the immune cells of the central nervous system, play critical roles in brain physiology and pathology. We report a novel approach that produces, within 10 days, the differentiation of human induced pluripotent stem cells (hiPSCs) into microglia (iMG) by forced expression of both SPI1 and CEBPA. High-level expression of the main microglial markers and the purity of the iMG cells were confirmed by RT-qPCR, immunostaining, and flow cytometry analyses. Whole-transcriptome analysis demonstrated that these iMGs resemble human fetal/adult microglia but not human monocytes. Moreover, these iMGs exhibited appropriate physiological functions, including various inflammatory responses, ADP/ATP-evoked migration, and phagocytic ability. When co-cultured with hiPSC-derived neurons, the iMGs respond and migrate toward injured neurons. This study has established a protocol for the rapid conversion of hiPSCs into functional iMGs, which should facilitate functional studies of human microglia using different disease models and also help with drug discovery.

Keywords: CEBPA; SPI1/PU.1; induced microglia; induced pluripotent stem cells; reprogramming.


Figures

None
Graphical abstract
Figure 1
Figure 1
Ectopic expression of pro-microglial factors in hiPSCs induces expression of various microglial markers (A) The lentiviral vectors used for pro-microglial (pro-μglial) gene-mediated conversion of hiPSCs to microglia. hiPSCs were sequentially transduced with lentivirus expressing rtTA and then a Tet-On promoter-driven pro-microglial gene linked to puromycin resistance by T2A. (B) Eight candidate transcription factor constructs involved in defining microglial cell fate during embryogenesis from the literature. (C) Flow cytometry analysis shows CD11b expression in N2-iPS cells (iN2) ectopically expressing the candidate genes. Green, CD11b antibody conjugated to fluorescein isothiocyanate (FITC); gray, isotype control. The figure is representative of three independent experiments. (D) Analysis of IBA1 immunoreactivity (red) of iN2 cells ectopically expressing the candidate genes. Cell nuclei are stained with DAPI. Scale bar, 50 μm. (E) Quantification of CD11b+ cells present among iN2 cells ectopically expressing the candidate genes. Data are presented as means ± standard error of the mean (SEM; n = 3–4 batches of independent differentiation). ∗∗∗∗p < 0.0001 by one-way ANOVA with Tukey's post hoc test. (F) Quantification of the IBA1+ cells present among hiPSCs ectopically expressing the candidate genes. Data are presented as means ± SEM (n = 3–7 batches of independent differentiation). ∗∗∗∗p < 0.0001 by one-way ANOVA with Tukey's post hoc test.
Figure 2
Figure 2
Differentiation of hiPSC-derived microglia-like cells (A) Flow diagram of generation of induced microglia. Numbers in parentheses indicate the concentration of human recombinant proteins in ng/mL. (B) Representative images of hiPSC-derived cells during differentiation. iN2s differentiated into microglia-like cells within 1 week. Scale bar, 50 μm. (C) Flow cytometry analysis shows the kinetics of expression of CD11b, TREM2, and CX3CR1 by the induced microglia (N2-iMG) at 7 to 15 days of differentiation. Green, CD11b antibody conjugated to FITC; orange, TREM2 antibody conjugated to phycoerythrin; red, CX3CR1 antibody conjugated to Alexa Fluor 647; gray, isotype control. The figure is representative of three independent experiments. (D) Time course of mRNA expression levels of key microglial markers (TMEM119, C1QA, GPR34, CD11b) and a stem cell marker (POU5F1) by RT-qPCR (normalized against a reference gene, RPL13A). Data points in black are the means of four batches of N2-iMG induction together with the SEM. (E) Representative images of N2-iMG cells immunostained for microglial markers IBA1, TREM2, CD11b, TMEM119, P2RY12, PU.1/SPI1, and DAPI. Scale bar, 50 μm. (F and G) Quantification of the CD11b+ (F) or TREM2+ (G) cells present among iMG cells by flow cytometry. Data are the means ± SEM (n = 5–7 batches of independent differentiation). (H) The differentiation efficiency is shown as IBA1+ over total DAPI+ cells. Data are presented as means ± SEM (n = 4 batches of independent differentiation and 30–70 cells in each batch).
Figure 3
Figure 3
iMG cells express consensus microglial markers (A) Three-dimensional principal component analysis of N1- and N2-iMG cells (yellow and green, respectively) by whole-transcriptome sequencing of protein coding genes. The profiles of hiPSC (N2-iPSC), iN (N2-iN), and iMG cells derived from two hiPSC lines with different genetic backgrounds, N1-iMG and N2-iMG, were merged with the dataset from Abud et al. (2017) and Brownjohn et al. (2018), including cultured human primary microglia from adult and fetal microglia, iMG cells from two different methods (iMG(Alt1) and iMG(Alt2)), and CD14+ peripheral blood monocytes. Each spot represents one independently differentiated cell batch and each cell type is coded (different colors and shapes). (B) Heatmap of 195 microglial, myeloid, and other immune-related genes. A pseudo-color is used to present the log10-transformed FPKM values (FPKM+1). (C) Spearman correlation matrix for correlations between different cell DeSeq2 rlog-transformed raw counts of genes used in (B). Median rlog gene counts of the biological replicates were used as input. The color shows the strength and direction of the correlation. (D) Expression of key microglial markers (P2RY12, TMEM119, C1QA, GPR34, MMP9), myeloid cell markers (CD11b, CD68, CX3CR1), monocyte and macrophage markers (MPO, ITGAL, ADGRE5), neuronal markers (MAP2, RBFOX3), and a stem cell marker (POU5F1) in N2-iMG cells after 9–12 days of induction (obtained by qRT-PCR). Fold change was calculated using the ΔCT method with RPL13A as an endogenous control. Data are means ± SEM (n = 3–11 independent experiments). p < 0.05, ∗∗p < 0.01, ∗∗∗p < 0.001, ∗∗∗∗p < 0.0001; ns, not significant. All compared with the iMG sample by one-way ANOVA with Fisher's least-significant difference (LSD) multiple comparisons.
Figure 4
Figure 4
iMG cells exhibit appropriate physiological responses to LPS and IFN-γ challenge and are able to engulf microspheres or fibrillar Aβ (A) qRT-PCR analysis of inflammation-related gene expression in N2-iMG cells after LPS/IFN-γ stimulation for 6 h. Data are means ± SEM (TNF-α, n = 10; IL-6, n = 14; iNOS, n = 14; IL-10, n = 4; CD68, n = 13). ∗∗p < 0.01, ∗∗∗∗p < 0.0001 compared with the mock-treatment group (ratio paired t test). (B and C) Representative spinning-disc confocal microscopy images of phagocytosis by N2-iMG cells (day 9) of latex beads (B, red) or TAMRA-labeled fibrillar Aβ (fAβ) (C, red). Cells were incubated with substrates for 1 h. The plasma membrane and nuclei of the live cells were stained with CellMask deep red (green) and Hoechst 33,342 (blue), respectively. The z-axis images at the vertical and horizontal yellow lines were extracted from 3D images, and indicate right and bottom positions, respectively. Scale bar, 10 μm. (D and E) Flow cytometry analysis of fluorescent microsphere bead (D) or TAMRA-fAβ (E) uptake by N2-iMGs at day 9. (F and G) Quantitative results for percentage of CD11b+ cells with fluorescent beads (F) or fAβs (G). Data are means ± SEM (n = 3–6 independent experiments). p < 0.05, ∗∗p < 0.01, ∗∗∗p < 0.001, ∗∗∗∗p < 0.0001 by one-way ANOVA using Tukey's multiple comparisons test. Cyto D, cytochalasin D.
Figure 5
Figure 5
iMG cells are physiologically functional and exhibit ADP-evoked and ATP-evoked Ca2+ transients and migration (A) Representative images showing an example of [Ca2+]i transients following addition of ADP to N2-iMG cells loaded with the Ca2+ indicator Fura-2/AM. Time-course changes in the fluorescence intensity at 340 and 380 nm (A′) and the ratio of F340/F380 (A″) were measured from three N2-iMG cells shown on the left. Scale bar, 5 μm. (B) Time-lapse changes in fluorescence intensity produced by adding ADP to N2-iMG cells. Gray traces indicate the changes in fluorescence intensity ratio (F340/F380) of each individual cell. Blue trace is the mean ratio change of each time point. (C) Quantitative results of the amplitudes of the [Ca2+]i transients. Maximum amplitude of the [Ca2+]i transient of each responsive cell is presented as a dot in the corresponding category. Data are pooled from three independent experiments and are means ±95% CI. The number in parentheses indicates the number of cells in each group. (D) Representative fluorescence images showing ADP-induced N2-iMG cell migration into a Transwell chamber (8 μm). The cells migrating from the top compartment to the bottom of the Transwell membrane were fixed, DAPI stained, and observed using an inverted microscope. Scale bar, 50 μm. (E) Quantitative results of (D). Data are means ± SEM (n = 4–5 fields for each replicate and involve 3–7 independent experiments for each condition). p < 0.05, ∗∗p < 0.01, ∗∗∗∗p < 0.0001 by one-way ANOVA with Tukey's multiple comparisons.
Figure 6
Figure 6
Co-culture of iMG cells with hiPSC-derived neurons promotes iMG maturation (A) Schematic overview of the co-culture protocol for iN and iMG cells generated from the same hiPSC line. The hiPSCs carrying the NGN2 or SPI1/CEBPA transgene were induced to form neurons (iNs) or microglia (iMG) separately. Next, the iN and iMG cells were co-cultured under compatible conditions from day 5 to day 10. (B) Representative images of the N2-iN and N2-iMG co-culture immunolabeled for MAP2 (red) and IBA1 (green) at day 10. Cell nuclei are stained with DAPI (blue). Scale bar, 50 μm. (C) Expression levels by qRT-PCR of key microglial markers (P2RY12, CX3CR1, C1QA, MMP9, TMEM119, GPR34) and the somatodendritic marker MAP2 in mono-cultured or co-cultured N2-iMG cells at 9–12 days of induction. Fold changes in target genes were calculated using the 2ˆ(-ΔΔCT) method with RPL13A as an endogenous control and relative to the expression levels found in mono-cultured iMGs. Data are means ± SEM (n = 4 independent experiments). p < 0.05 by paired t test. (D) An example of time-lapse differential interference contrast (DIC) imaging of N2-iMG cultures with or without N2-iNs (recorded for 12 h). Yellow arrows in the DIC images mark the migrating iMG cells, defined as cells with a displacement length of over two cell bodies between two continuous frames over 12 h. Red arrowheads indicate iNs. The right-side images show the cell trace results and are presented as the color-coded trajectories of each cell over 12 h. Scale bar, 100 μm. (E) Percentage of migrating N2-iMG cells in mono-culture or in co-culture (12-h recording period). Data are means ± SEM (n = 5 independent fields in each group). ∗∗p < 0.01 by unpaired t test. (F) The speed of migration of the N2-iMG cells in the mono-culture or co-culture (12-h recording period). Data are means ± SEM (n = 45 and 46 cells from 5 fields in the N2-iMG and N2-iMG(+N2-iN) groups, respectively). n.s., not significant by unpaired t test.
Figure 7
Figure 7
iMG cells respond to and migrate toward an injured neuron cluster (A) Experimental design of the laser-induced neuronal injury. (B) Cell death of N2-iNs was monitored using propidium iodide (PI) staining. Each selected iN cluster was exposed to 405-nm laser light for 5 min and immediately examined by time-lapse imaging (sampling rate of 1/300 Hz) for PI signal. Scale bar, 20 μm. (C) An example of the time-lapse DIC imaging of co-cultures with or without laser-induced neuronal injury (recorded for 12 h). Blue arrows in the DIC images mark an iMG cell migrating toward the central iN cluster. The two-panel images on the right show the results of cell traces, which are presented as a color-coded trajectory for each cell over 12 h. The displacement of each cell is shown on the right. Scale bar, 100 μm. (D) Measurements of the distance between each iMG cell and the central iN cluster in the control and laser ablation groups for each time point. Different cells are coded by color and are from a representative experiment. (E) The graph depicts the results of relative distance changes over time for the four conditions. Data are means ± SEM (n = 46 N2-iMG cells in 5 fields [no laser control]; n = 58 N2-iMG cells in 6 fields [laser ablation]; n = 41 N2-iMG cells in 8 fields [no laser control and PSB application]; n = 33 N2-iMG cells in 8 fields [laser ablation and PSB application]). (F) The percentage of iMG cells that are able to contact the central iN cluster over the 12-h recording period. Data are means ± SEM (n = 5–8 fields). p < 0.05 by one-way ANOVA with Fisher's LSD multiple comparisons.

References

    1. Abud E.M., Ramirez R.N., Martinez E.S., Healy L.M., Nguyen C.H.H., Newman S.A., Yeromin A.V., Scarfone V.M., Marsh S.E., Fimbres C. iPSC-derived human microglia-like cells to study neurological diseases. Neuron. 2017;94:278–293.e9. - PMC - PubMed
    1. Brownjohn P.W., Smith J., Solanki R., Lohmann E., Houlden H., Hardy J., Dietmann S., Livesey F.J. Functional studies of missense TREM2 mutations in human stem cell-derived microglia. Stem Cell Reports. 2018;10:1294–1307. - PMC - PubMed
    1. Butovsky O., Jedrychowski M.P., Moore C.S., Cialic R., Lanser A.J., Gabriely G., Koeglsperger T., Dake B., Wu P.M., Doykan C.E. Identification of a unique TGF-beta-dependent molecular and functional signature in microglia. Nat. Neurosci. 2014;17:131–143. - PMC - PubMed
    1. Buttgereit A., Lelios I., Yu X., Vrohlings M., Krakoski N.R., Gautier E.L., Nishinakamura R., Becher B., Greter M. Sall1 is a transcriptional regulator defining microglia identity and function. Nat. Immunol. 2016;17:1397–1406. - PubMed
    1. Caiazzo M., Dell'Anno M.T., Dvoretskova E., Lazarevic D., Taverna S., Leo D., Sotnikova T.D., Menegon A., Roncaglia P., Colciago G. Direct generation of functional dopaminergic neurons from mouse and human fibroblasts. Nature. 2011;476:224–227. - PubMed

Publication types

MeSH terms