. 2021 May 11;16(5):1262-1275.
doi: 10.1016/j.stemcr.2021.03.014. Epub 2021 Apr 8.

FGF-MAPK signaling regulates human deep-layer corticogenesis

Affiliations

FGF-MAPK signaling regulates human deep-layer corticogenesis

Carlos W Gantner et al. Stem Cell Reports. .

Abstract

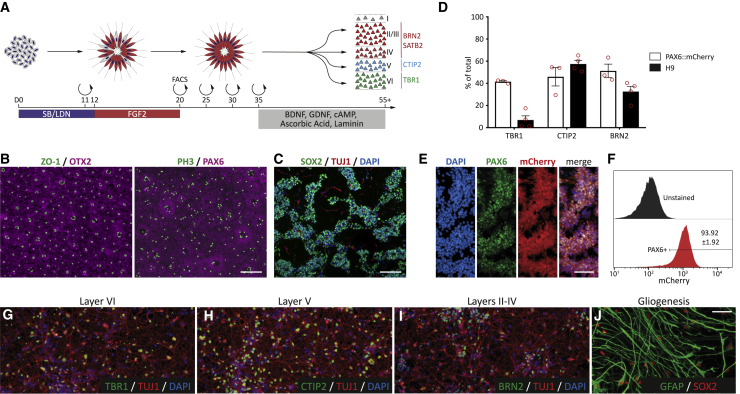
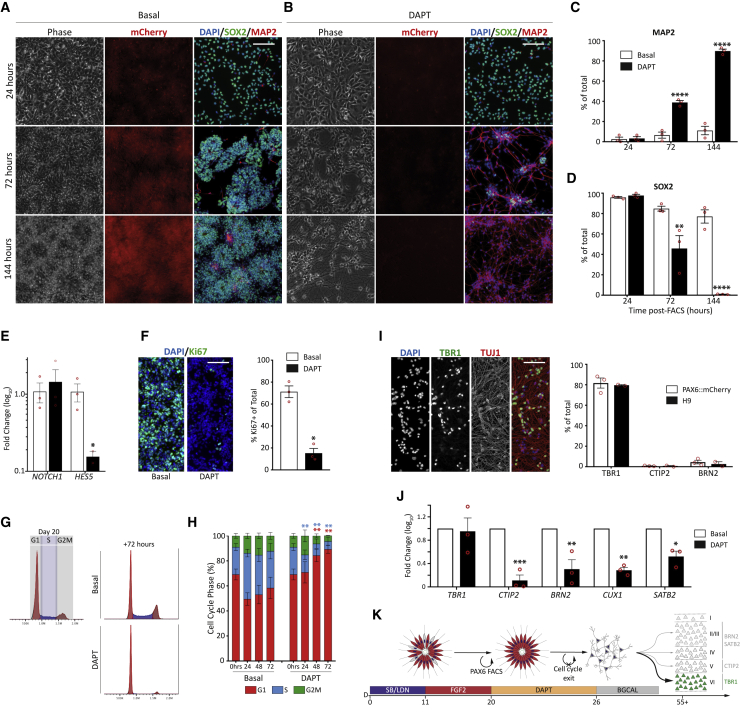
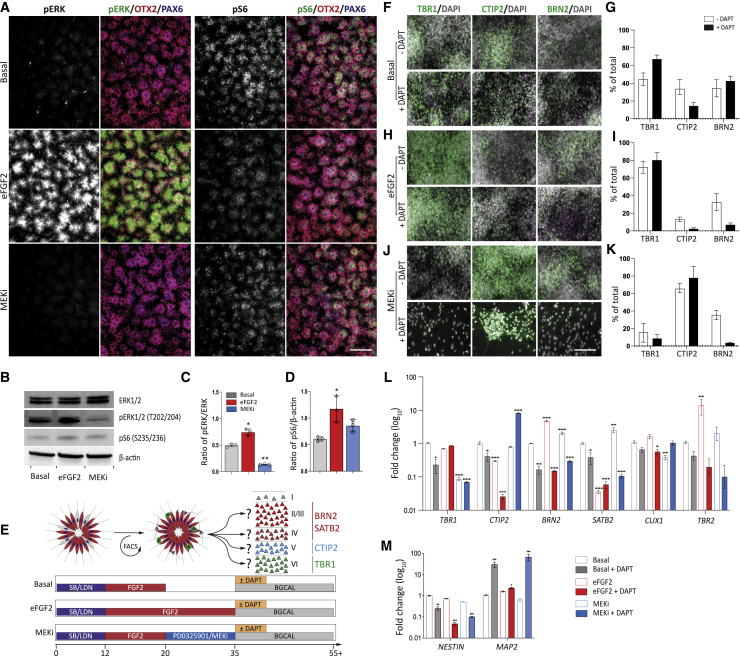
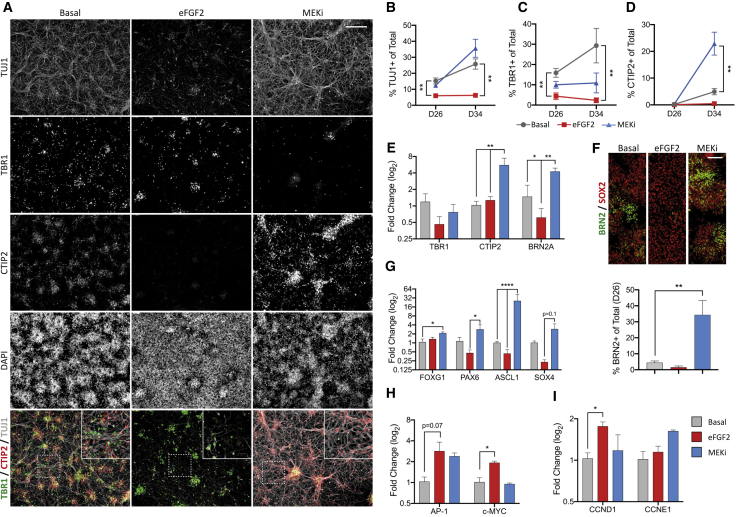
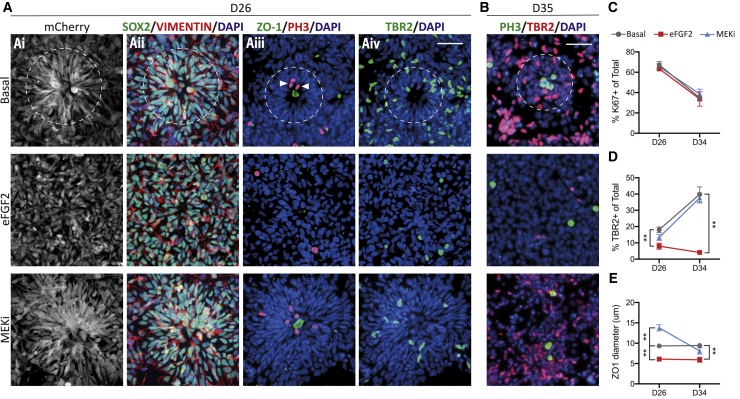
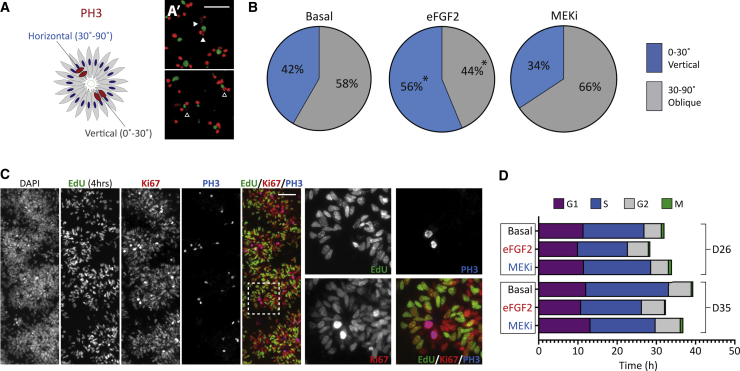
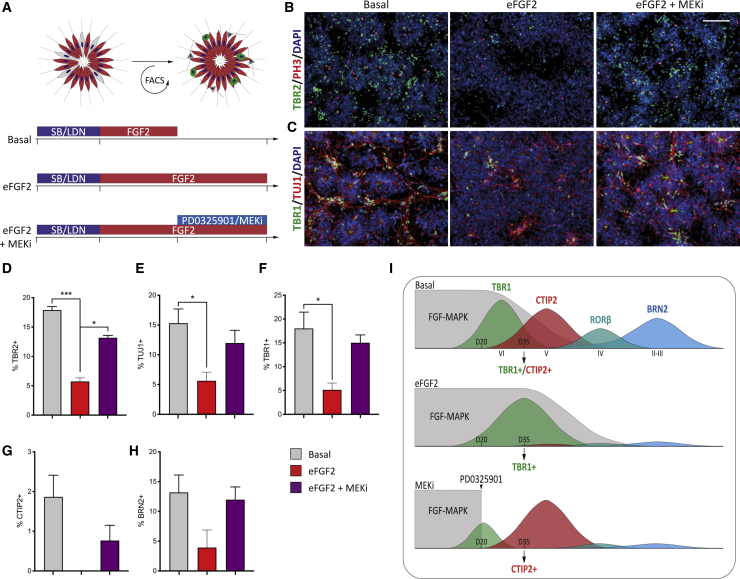
Despite heterogeneity across the six layers of the mammalian cortex, all excitatory neurons are generated from a single founder population of neuroepithelial stem cells. However, how these progenitors alter their layer competence over time remains unknown. Here, we used human embryonic stem cell-derived cortical progenitors to examine the role of fibroblast growth factor (FGF) and Notch signaling in influencing cell fate, assessing their impact on progenitor phenotype, cell-cycle kinetics, and layer specificity. Forced early cell-cycle exit, via Notch inhibition, caused rapid, near-exclusive generation of deep-layer VI neurons. In contrast, prolonged FGF2 promoted proliferation and maintained progenitor identity, delaying laminar progression via MAPK-dependent mechanisms. Inhibiting MAPK extended cell-cycle length and led to generation of layer-V CTIP2+ neurons by repressing alternative laminar fates. Taken together, FGF/MAPK regulates the proliferative/neurogenic balance in deep-layer corticogenesis and provides a resource for generating layer-specific neurons for studying development and disease.

Keywords: MAPK signaling; Notch; cortex; fibroblast growth factor 2; human neural development; lamination; neurogenesis; stem cells.


Figures

Figure 1
Figure 1
PAX6+ cortical progenitors form both deep- and upper-layer cortical neurons (A) Schematic showing dual-SMAD neural induction and FGF2 expansion to generate dorsal telencephalic progenitors from hPSCs. HES3:PAX6mCherry progenitors were FACS isolated at day 20 (D20) and matured until D55 for analysis. (B) H9-derived cortical progenitors express forebrain (OTX2+) and dorsal (PAX6+) markers and self-organize into rosettes with ZO-1+ lumens and basal PH3+ mitoses. (C) Asynchronous maturation generates cultures of SOX2+ progenitors and TUJ1+ neurons. (D) Quantification of TBR1+ (layer VI), CTIP2+ (layer V), and BRN2+ (layers II–IV) neurons for two hPSC lines (n = 3–4 independent experiments, data are mean ± SEM). (E) The HES3:PAX6mCherry reporter mirrored PAX6 protein expression in vitro. (F) FACS isolation and quantification of PAX6+ cortical progenitors at D20 (n = 5). (G–I) Long-term culture (D55) yielded cortical neurons expressing markers of layers VI (G), V (H), and II–IV (I). (J) Glial differentiation (GFAP/SOX2) was observed after extended culture (>D80). Scale bars, 100 μm.
Figure 2
Figure 2
Notch inhibition of PAX6+ progenitors generates TBR1+, early-born cortical neurons (A) Under basal conditions, FACS-isolated progenitors generated PAX6-mCherry+/SOX2+ rosettes, which persisted for >7 days and showed few MAP2+ neurons. (B) DAPT treatment downregulated mCherry, rapidly generated neurons, and depleted SOX2+ progenitors. (C and D) Quantification for MAP2+ (C) neurons or SOX2+ (D) progenitors ± DAPT (n = 3 independent experiments). (E) DAPT had no effect on NOTCH1 but decreased downstream HES5 expression after 48 h, confirming inhibitor activity (n = 3 independent experiments). (F) DAPT rapidly reduced Ki67+ cells after 48 h (n = 3 independent experiments). (G) Example FACS-based cell-cycle analysis in Basal and DAPT cultures (n = 3 independent experiments). (H) DAPT reduced the number of progenitors entering S phase within 24 h. (I) Neurons generated after DAPT treatment were almost exclusively TBR1+ at D55 (n = 3 independent experiments). (J) qRT-PCR confirmed that DAPT treatment reduced CTIP2, BRN2, CUX1, and SATB2 expression (n = 3 independent experiments). (K) Schematic of DAPT-induced cell-cycle exit showing that D20 progenitors are competent to generate early-born, layer-VI TBR1+ neurons. Data are mean ± SEM; p < 0.05, ∗∗p < 0.01, ∗∗∗p < 0.001, ∗∗∗∗p < 0.0001. Scale bars, 100 μm.
Figure 3
Figure 3
eFGF2 or MEK inhibition alters cortical layer phenotype (A) Under Basal conditions few phosphorylated ERK+ (pERK+) progenitors are observed, while the majority of cells are phosphorylated S6+ (pS6+). FGF2 treatment increased pERK expression, while MEK inhibition (MEKi) blocked pERK expression. (B–D) Western blot showing upregulated pERK and pS6 after 24 h of FGF2 treatment (B). MEKi abolished pERK expression but had no effect on pS6. Western blot quantification of pERK (C) and pS6 (D) (n = 3 independent experiments). (E) Differentiation conditions of cortical progenitors showing Basal, eFGF2, and MEKi conditions (±DAPT). (F–K) Sorted PAX6+ progenitors under Basal conditions (±DAPT) (F and G), or treated with eFGF2 (H and I) or PD0325901 (J and K) were assessed for laminar fate at D55. (G) Quantification showed that progenitors under Basal conditions generated DL and UL neurons, with DAPT at D35 biasing TBR1+ neurons. (I) eFGF2 treatment generated TBR1+ neurons almost exclusively ± DAPT. (K) MEKi-treated progenitors predominantly generated CTIP2+ neurons ± DAPT, while in the absence of DAPT UL BRN2+ cells were observed (n = 3 independent experiments). (L) qRT-PCR analysis of cortical genes confirmed cell quantifications (n = 3 independent experiments). Relative to Basal, eFGF2 (−DAPT) increased BRN2 and decreased SATB2 expression, suggestive of an IPC population rather than UL fate. MEKi (+DAPT) decreased the alternative deep (TBR1) and superficial (BRN2) laminar fates. In contrast, MEKi (−DAPT) increased BRN2 and SATB2 expression, reflective of UL fates. (M) Increased NESTIN and decreased MAP2 gene expression confirmed cell-cycle exit and maturation in DAPT cultures (n = 3 independent experiments). Data are mean ± SEM, one-way ANOVA with Dunnett's correction, n = 3; p < 0.05, ∗∗p < 0.01, ∗∗∗p < 0.001. Scale bars, 100 μm (A) and 50 μm (F–J).
Figure 4
Figure 4
MEK inhibition accelerates the development of CTIP2-competent progenitors and the pro-neural gene network (A) Under Basal conditions, TBR1+ and CTIP2+ cells are present at D34, showing that progenitors can generate both layers. In contrast, eFGF2 treatment limits neurogenesis and only few TBR1+ neurons are born. After MEKi, CTIP2+ neurons predominate at the expense of TBR1. Inset shows magnified section. (B–D) Quantification at D26 and D35 for TUJ1+ (B), TBR1+ (C), and CTIP2+ (D) neurons (n = 3–5 independent experiments, one-way ANOVA with Dunnett's correction). (E) qRT-PCR at D26 showed increased CTIP2 and BRN2A mRNA after acute MEKi. (F) BRN2+/SOX2+ progenitors were rare in eFGF2 conditions and increased following MEKi. (G) The pro-neural genes FOXG1, PAX6, and ASCL1 were increased at D26 after MEKi, concomitant with increased CTIP2+ neurogenesis. (H) eFGF2 induced AP-1 and c-MYC, downstream of FGFR activation. (I) eFGF2 also increased levels of CCND1, required for G1/S-phase transition (n = 3 independent experiments). Data are mean ± SEM; p < 0.05, ∗∗p < 0.01, ∗∗∗p < 0.001, ∗∗∗∗p < 0.0001. Scale bars, 200 μm (A) and 50 μm (F).
Figure 5
Figure 5
Progenitor dynamics highlight immaturity of eFGF2-treated progenitors (A) Cortical rosettes under Basal conditions recapitulated in vivo cortical development, showing apicobasal polarity (Ai and Aii), ZO1+ lumens (Aiii), PH3+ apical mitoses (white arrows, Aiii), and TBR2+ IPCs located basal to the lumen (Aiv). Rosette organization and TBR2+ IPCs were reduced after eFGF2 treatment and unaffected by MEKi. White circles highlight rosettes. (B) At D35, IPCs were increased in Basal and MEKi conditions but were rare after eFGF2. (C) No difference in Ki67+ cycling progenitors was observed. (D) TBR2 quantification at D26 and D35 shows that eFGF2-treated cultures did not generate IPCs. (E) MEKi generated larger rosettes, shown by increased ZO-1 lumen diameter (n = 3–5 independent experiments, one-way ANOVA with Dunnett's correction). Data are mean ± SEM; p < 0.05, ∗∗p < 0.01. Scale bar, 50 μm.
Figure 6
Figure 6
Cell-cycle analysis highlights progenitor characteristics of eFGF2-treated cultures (A) Quantification method for determining the cleavage angle of dividing PH3+ progenitors. (A′) Images showing horizontal (filled arrows) or vertical (hollow arrows) cleavage angles (n = 103 cells). (B) Quantification of cleavage angle under Basal, eFGF, and MEKi conditions. eFGF2-treated progenitors preferentially underwent proliferative divisions, shown by the increase in vertical cleavage planes. (C) EdU assessment of cell-cycle kinetics with EdU labeling cells in S phase and Ki67 total cycling pool. Inset shows magnified region. Note the two PH3+ mitotic progenitors are EdU at this time point (4 h), showing that they had exited S phase prior to EdU addition. (D) Representation of G1, S, G2, and M phase and total cell-cycle length under Basal, eFGF2, or MEKi conditions, highlighting that eFGF2 shortened the cell cycle (representative of n = 3 independent experiments). Scale bar, 50 μm.
Figure 7
Figure 7
eFGF2 acts via MEK to maintain progenitor identity (A) Experimental diagram of mechanism experiments. Cortical progenitors were exposed to eFGF2 (±MEKi) to analyze the role of MEK. (B) eFGF2-treated cultures did not generate TBR2+ IPCs, an effect that was reversed by MEKi. (C) Likewise, eFGF2 cultures generated limited TBR1+ neurons at D26, in contrast to Basal conditions. This effect was also reversed by MEKi. (D–H) Quantification at D26 for TBR2 (D), TUJ1 (E), TBR1 (F), CTIP2 (G), and BRN2 (H) under Basal, eFGF2 and eFGF2+ MEKi conditions (n = 3 independent experiments). (I) Putative role of FGF2 signaling during cortical maturation and laminar specification. Scale bar, 50 μm.

References

    1. Arai Y., Pulvers J.N., Haffner C., Schilling B., Nusslein I., Calegari F., Huttner W.B. Neural stem and progenitor cells shorten S-phase on commitment to neuron production. Nat. Commun. 2011;2:154. - PMC - PubMed
    1. Bayraktar O.A., Doe C.Q. Combinatorial temporal patterning in progenitors expands neural diversity. Nature. 2013;498:449–455. - PMC - PubMed
    1. Bellmaine S.F., Ovchinnikov D.A., Manallack D.T., Cuddy C.E., Elefanty A.G., Stanley E.G., Wolvetang E.J., Williams S.J., Pera M. Inhibition of DYRK1A disrupts neural lineage specification in human pluripotent stem cells. eLife. 2017;6:e24502. - PMC - PubMed
    1. Betizeau M., Cortay V., Patti D., Pfister S., Gautier E., Bellemin-Menard A., Afanassieff M., Huissoud C., Douglas R.J., Kennedy H. Precursor diversity and complexity of lineage relationships in the outer subventricular zone of the primate. Neuron. 2013;80:442–457. - PubMed
    1. Bonnefont J., Tiberi L., van den Ameele J., Potier D., Gaber Z.B., Lin X., Bilheu A., Herpoel A., Velez Bravo F.D., Guillemot F. Cortical neurogenesis requires Bcl6-mediated transcriptional repression of multiple self-renewal-promoting extrinsic pathways. Neuron. 2019;103:1096–1108 e1094. - PMC - PubMed

Publication types

MeSH terms

LinkOut - more resources