. 2021 May 10;39(5):694-707.e7.
doi: 10.1016/j.ccell.2021.03.006. Epub 2021 Apr 8.

Oncogenic extrachromosomal DNA functions as mobile enhancers to globally amplify chromosomal transcription

Affiliations

Oncogenic extrachromosomal DNA functions as mobile enhancers to globally amplify chromosomal transcription

Yanfen Zhu et al. Cancer Cell. .

Abstract

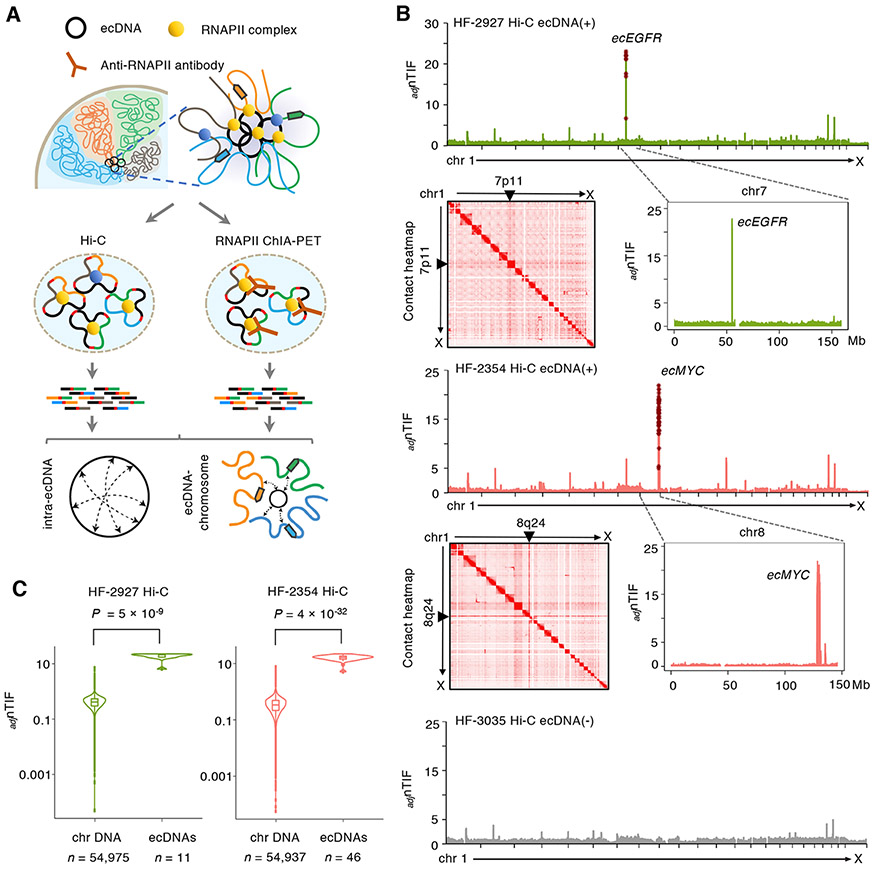
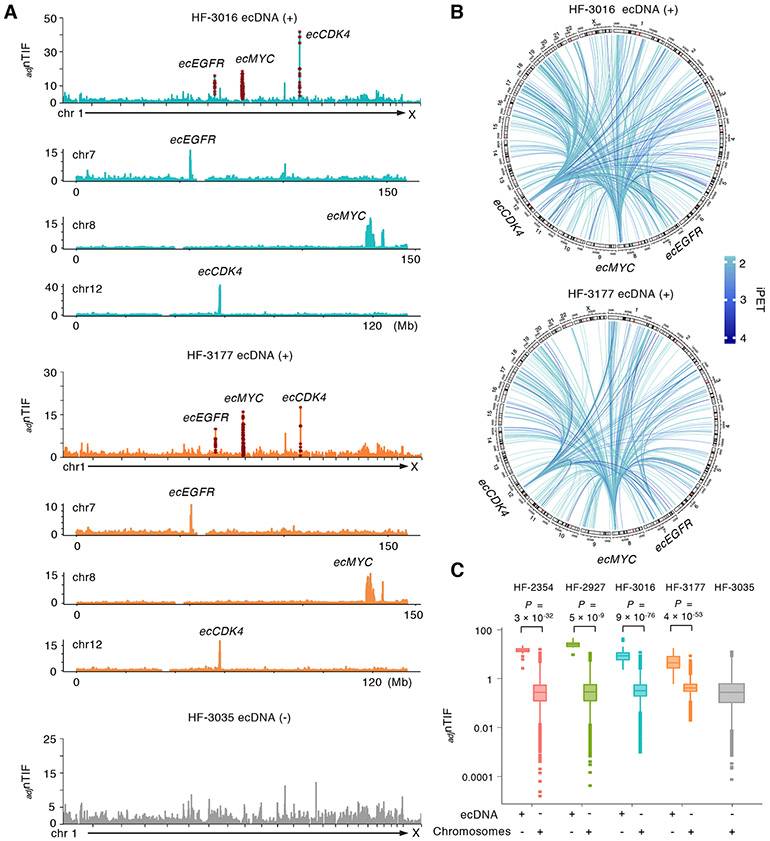
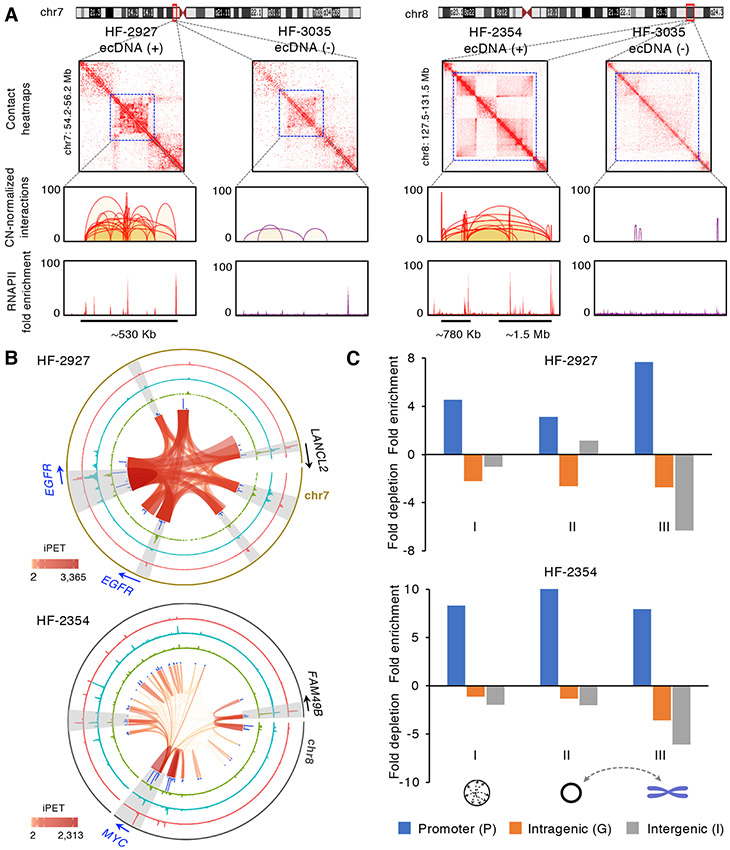
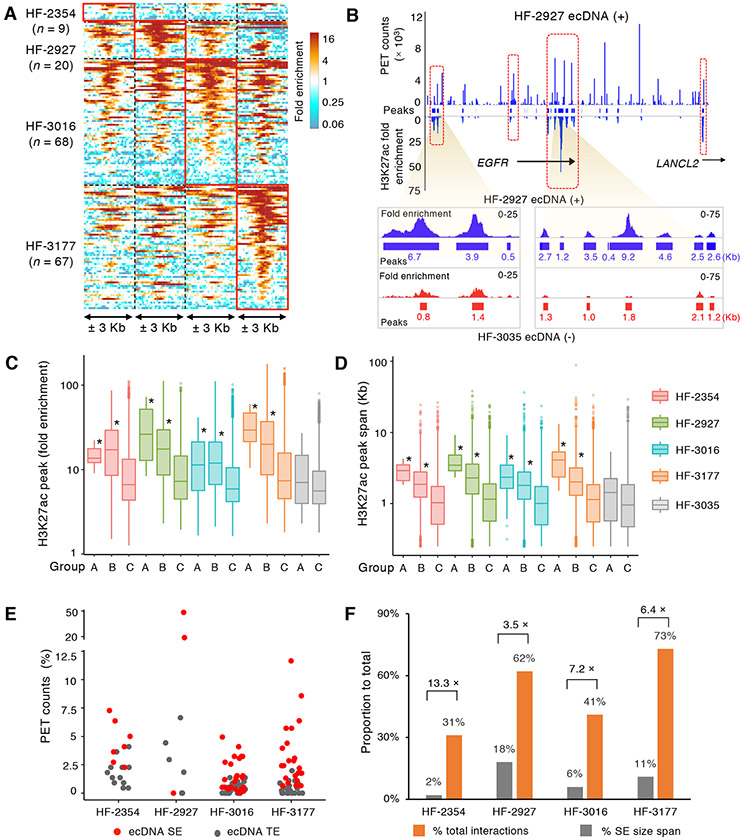
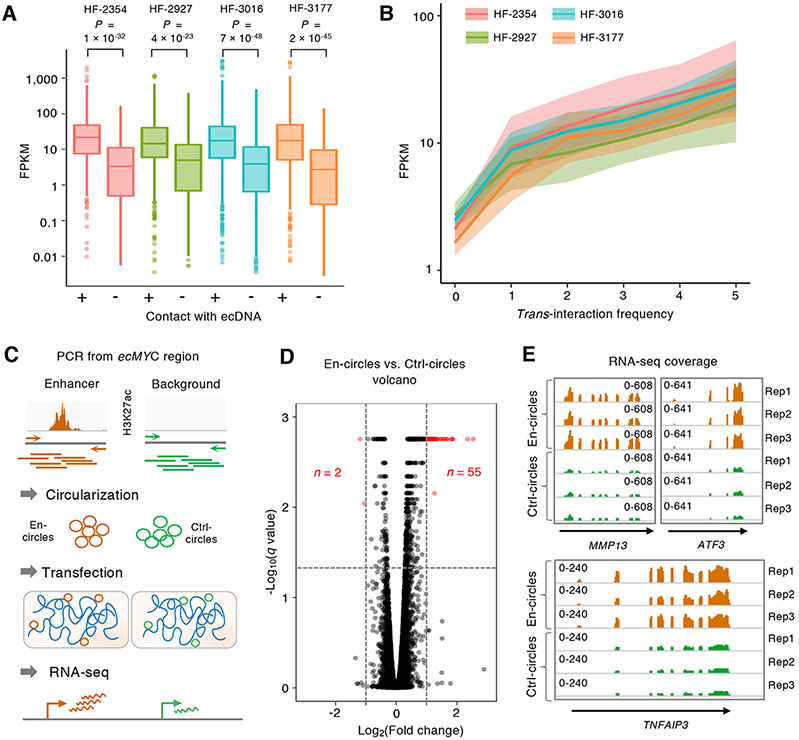
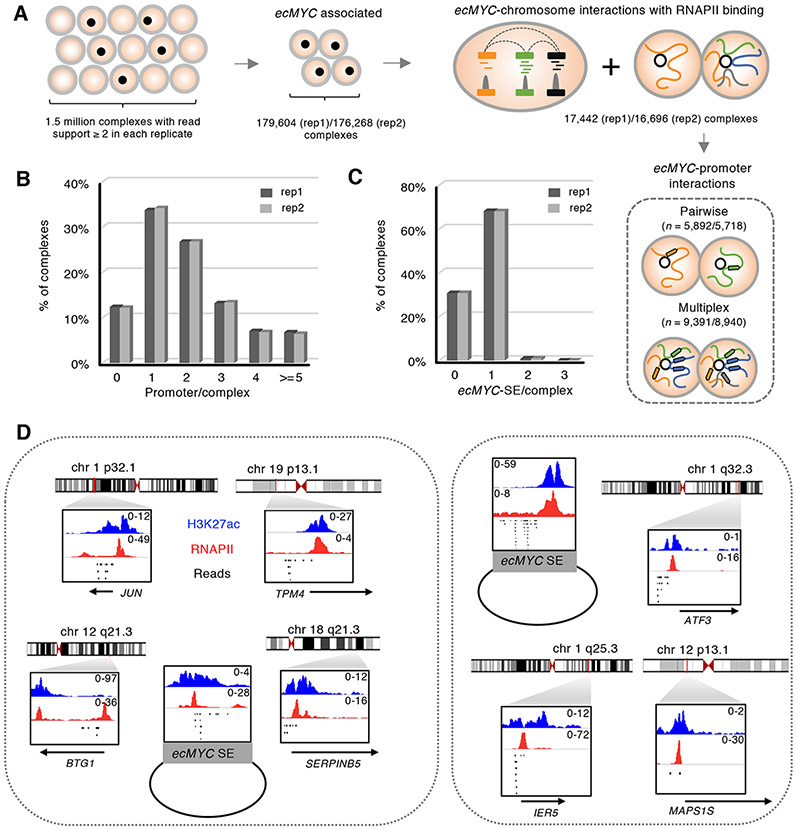
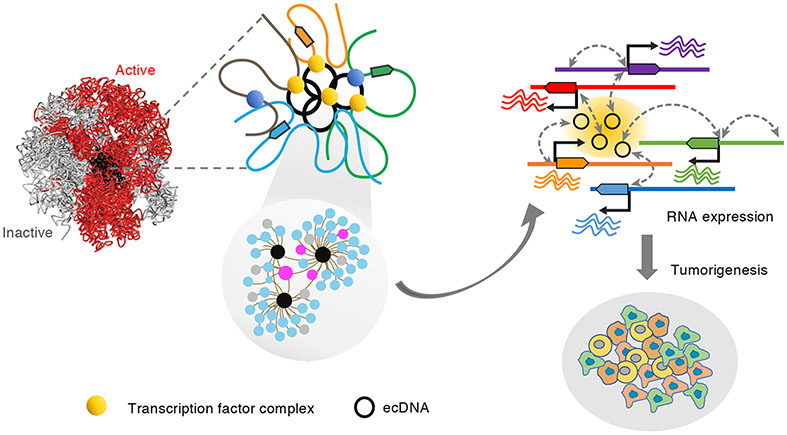
Extrachromosomal, circular DNA (ecDNA) is emerging as a prevalent yet less characterized oncogenic alteration in cancer genomes. We leverage ChIA-PET and ChIA-Drop chromatin interaction assays to characterize genome-wide ecDNA-mediated chromatin contacts that impact transcriptional programs in cancers. ecDNAs in glioblastoma patient-derived neurosphere and prostate cancer cell cultures are marked by widespread intra-ecDNA and genome-wide chromosomal interactions. ecDNA-chromatin contact foci are characterized by broad and high-level H3K27ac signals converging predominantly on chromosomal genes of increased expression levels. Prostate cancer cells harboring synthetic ecDNA circles composed of characterized enhancers result in the genome-wide activation of chromosomal gene transcription. Deciphering the chromosomal targets of ecDNAs at single-molecule resolution reveals an association with actively expressed oncogenes spatially clustered within ecDNA-directed interaction networks. Our results suggest that ecDNA can function as mobile transcriptional enhancers to promote tumor progression and manifest a potential synthetic aneuploidy mechanism of transcription control in cancer.

Keywords: ChIA-Drop; ChIA-PET; chromatin interactions; ecDNA; mobile enhancers.


Conflict of interest statement

Declaration of interests R.G.W.V. is a co-founder of Boundless Bio, Inc (BB), and a member of its scientific advisory board. BB was not involved in the research presented here. C.-L.W., C.-H.W., H.T., and R.G.W.V. are co-inventors on a patent application (WO2020223309A1 "Extrachromosomal DNA identification and methods of use") submitted by The Jackson Laboratory. The other authors declare no competing interests.

Figures

Figure 1.
Figure 1.. EcDNAs mediate widespread contacts with chromosomes
(A) Hi-C and ChIA-PET were used to characterize the general ecDNA-associated chromatin conformation and their specific chromatin contacts associated with RNAPII. In RNAPII ChIA-PET assays, RNAPII ChIP was performed to capture all RNAPII-bound chromatin interactions, while in Hi-C, no ChIP was performed. The chromatin fragments were ligated by proximity ligation followed by sequencing analysis. Pair-end reads were aligned to the genome to characterize the interactions between ecDNA regions and their chromosomal targets. (B) Distributions of copy-number adjusted nTIFs (adjnTIF) across 23 chromosomes at 50-Kb resolution in HF-2927 and HF-2354 as well as ecDNA (−) HF-3035 lines. In their respective cell lines, the distributions of adjnTIFs of chromosomes 7 and 8 (shown in the zoomed-in adjnTIF plots) reveal the location of the expected ecDNAs to be encompassing respectively EGFR and MYC. adjnTIFs in the known ecDNA regions are marked in brown stars. Genome-wide 2D chromatin contact heatmaps show distinct pairs of lines at regions on chromosomes 7p11 and 8q24 indicating intensive contacts with the entire genomes. (C) Violin plots display the adjnTIFs between the known ecDNA regions and chromosomal background in HF-2927 and HF-2354 lines. Statistical analyses by one-sided Wilcoxon Rank-Sum Test. For boxplots, center line, median; boxes, first and third quartiles; whiskers, 1.5 × the interquartile range (IQR); points, outliers. See also Figure S1, Table S1 and Table S2.
Figure 2.
Figure 2.. EcDNA signatures can be distinguished by the high chromosomal interaction frequency (adjnTIF) across 23 chromosomes
(A) Distribution of genome-wide adjnTIFs at 50-Kb resolution in the ecDNA (+) HF-3016 and HF-3177 cell lines in comparison with the ecDNA (−) HF-3035 line. Elevated adjnTIFs are observed on the chromosomes 7, 8 and 12 regions known to be amplified on ecDNAs. Distributions of adjnTIFs along the chromosomes 7, 8 and 12 are shown and regions with elevated adjnTIF values are well-matched with known ecEGFR, ecMYC and ecCDK4 regions. (B) Circos plots of the interactions mediated by ecDNA regions across all 23 chromosomes in HF-3016 and HF-3177 ecDNA (+) cell lines. Extensive connections between ecMYC, ecEGFR and ecCDK4 regions are shown. (C) Box plot displays the adjnTIFs between the known ecDNA regions and chromosomal background in four ecDNA (+) cell lines. Statistical analyses by one-sided Wilcoxon Rank-Sum Test. For boxplots, center line, median; boxes, first and third quartiles; whiskers, 1.5 × the interquartile range (IQR); points, outliers. See also Figure S2 and Table S2.
Figure 3.
Figure 3.. EcDNAs are bound by RNAPII and mediate extensive intra-ecDNA and chromosomal interactions
(A) Copy-number normalized 2D contact heatmaps from ecDNA (+) HF-2927 (left), HF-2354 (right) and ecDNA (−) HF-3035 cell lines within ecEGFR and ecMYC regions. RNAPII bound cis-interactions and fold enrichment of RNAPII binding within the ecEGFR region (chr7: 54,860,254-55,535,856) in HF-2927 and the corresponding chromosomal EGFR locus in HF-3035 as well as the two segments of ecMYC regions (chr8: 128,032,011-128,806,493 and chr8: 129,573,241-130,968,628) in HF-2354 and the corresponding chromosomal MYC locus in HF-3035 are shown. (B) Circos plots of ecDNA regions defined in HF-2927 and HF-2354 ecDNA (+) cell lines. From inner to outer circles: intra-ecDNA interaction loops, blue: distribution of intra-ecDNA interaction frequency, green: distribution of ecDNA-chromosomal interaction frequency, cyan: H3K27ac fold enrichment, red: RNAPII binding enrichment. The signal tracks are at 1-Kb resolution. Examples of the high concordance regions between H3K27ac signals and interaction frequency are highlighted in grey. (C) Enrichment or depletion of promoter, intergenic and intragenic regions associated with ecDNA interaction anchors compared to genomic background on ecDNA regions. The interaction anchors from ecDNAs mediated cis (I) and trans (II) as well as their chromosomal contacts (III) in HF-2927 and HF-2354 are shown. See also Figure S3 and Table S2.
Figure 4.
Figure 4.. EcDNAs are enriched with super-enhancer signature
(A) H3K27ac modification enrichment density within ± 3 Kb of the chromosomal non-coding regions interacting with ecDNA promoters across four ecDNA (+) cell lines. Densities from regions detected in each corresponding cell line are highlighted. (B) Concordance between the chromatin interaction frequency and H3K27ac signal density across the ecEGFR region (chr7: 54,929,292-55,441,765) in HF-2927. Lower panel: Zoom-in view of the two super-enhancer regions on ecEGFR region, H3K27ac signal density and peaks in HF-2927 (blue) and HF-3035 (red) are shown. Peak sizes are labeled. (C-D) Box plots show the fold enrichment (C) and span size (D) distributions of H3K27ac peaks within foci of high interaction frequency on ecDNAs (Group A, n = 7, 4, 30 and 12), their corresponding chromosomal partners (Group B, n = 770, 1,502, 2,374 and 1,522) and genome-wide remaining chromosomal peaks (Group C, n = 35,755, 32,867, 33,580 and 50,181) from each of the four ecDNA (+) lines. In ecDNA (−) HF-3035 cells, Group A (n = 45) refers as the H3K27ac peaks found in the native chromosomal regions corresponding to ecDNA foci of high interaction frequencies. Group C (n = 45,723) represents the remaining genome-wide H3K27ac peaks. Y-axis are in log10 scales. *: P value < 0.005 compared to Group C (One-sided Wilcoxon Rank-Sum Test). (E) Proportion of trans-interacting PET counts associated with ecDNA super enhancers (SEs) (n = 7, 3, 27, 22) and typical enhancers (TEs) (n = 14, 7, 47, 46). (F) Percentage of spans occupied by SEs on ecDNA and ecDNA SE-associated interactions vs. total spans and numbers of interactions. Fold enrichment of SE-mediated interactions are labeled. All H3K27ac signals in A-D were copy-number normalized. For all boxplots, center line, median; boxes, first and third quartiles; whiskers, 1.5 × the interquartile range (IQR); points, outliers. See also Figure S4, Figure S6 and Table S3.
Figure 5.
Figure 5.. EcDNA-mediated chromatin interactions associated with genes of active transcription
(A) The distributions of RNA expression (FPKM) of chromosomal genes trans-interacting with ecDNA (n = 214, 294, 592 and 399, respectively) and genes with no trans-chromosomal interactions (n = 618, 430, 755 and 533, respectively) in each of the four ecDNA (+) cell lines. Statistical analyses by one-sided Wilcoxon Rank-Sum Test. For boxplots, center line, median; boxes, first and third quartiles; whiskers, 1.5 × the interquartile range (IQR); points, outliers. (B) The distributions of gene expression (FPKM) of chromosomal genes with increasing degree (0-5) of ecDNA contact frequency. For each ecDNA (+) line, 95% confidence interval of the fitted values are shaded. Smoothened FPKM is represented as the solid fitted line. (C) Synthetic ecDNA enhancer assay. H3K27ac regions from ecDNAs were amplified, circularized and transfected into ecDNA (−) cells. RNA expression was measured by RNA-seq in triplicates. (D) Volcano plot of differentially expressed genes between En-circles and Ctrl-circles (FPKM > 1). Significantly dysregulated genes (∣log2(Fold change)∣ > 1, q < 0.05) are marked in red. The horizonal line in the −Log10(q value) was resulted from the identical q values from the differentially expressed genes of different fold changes. (E) The normalized read coverages of the differentially expressed MMP13, ATF3, and TNFAIP3 genes in En-circles and Ctrl-circles transfected cells are shown in triplicates. See also Figure S5, Figure S6, Figure S7, Table S3 and Table S4.
Figure 6.
Figure 6.. EcDNAs associated multiplex promoter interactions are converged on SEs
(A) ChIA-Drop analysis. RNAPII-bound, ecMYC-associated complexes were defined from two independent replicates. Complexes harnessing multiple chromosomal interaction sites with read support ≥ 2 were selected for downstream analysis. (B) Proportions of ecMYC-associated chromatin complexes harnessing different numbers of chromosomal promoters. (C) Proportions of ecMYC-associated chromatin complexes harnessing one or more ecDNA SEs. (D) Two examples of ecMYC-associated complexes and their chromosomal targets. Reads of the identical barcodes were shown in a 10-kb window for each fragment with their corresponding RNAPII and H3K27ac fold enrichment. The annotated gene promoters were labeled. See also Figure S8 and Table S5.
Figure 7.
Figure 7.. Model illustrating how ecDNAs contribute transcription and tumorigenesis
The transcriptionally active, extra-chromosomal chromatin particles make contacts with specific chromosomal genes through RNAPII-mediated chromatin interactions. The contacts converged on super enhancers on ecDNAs and activate expression of genes relevant to oncogenesis pathways.

Comment in

References

    1. Alt FW, Kellems RE, Bertino JR, and Schimke RT (1978). Selective multiplication of dihydrofolate reductase genes in methotrexate-resistant variants of cultured murine cells. J Biol Chem 253, 1357–1370. - PubMed
    1. Amemiya HM, Kundaje A, and Boyle AP (2019). The ENCODE Blacklist: Identification of Problematic Regions of the Genome. Sci Rep 9, 9354. - PMC - PubMed
    1. Bertolini JA, Favaro R, Zhu Y, Pagin M, Ngan CY, Wong CH, Tjong H, Vermunt MW, Martynoga B, Barone C, et al. (2019). Mapping the Global Chromatin Connectivity Network for Sox2 Function in Neural Stem Cell Maintenance. Cell Stem Cell 24, 462–476 e466. - PMC - PubMed
    1. Cox D, Yuncken C, and Spriggs AI (1965). Minute Chromatin Bodies in Malignant Tumours of Childhood. Lancet 1, 55–58. - PubMed
    1. Cremer T, and Cremer M (2010). Chromosome territories. Cold Spring Harb Perspect Biol 2, a003889. - PMC - PubMed

Publication types