. 2021 May 13;184(10):2618-2632.e17.
doi: 10.1016/j.cell.2021.03.051. Epub 2021 Mar 30.

TOP1 inhibition therapy protects against SARS-CoV-2-induced lethal inflammation

Affiliations

TOP1 inhibition therapy protects against SARS-CoV-2-induced lethal inflammation

Jessica Sook Yuin Ho et al. Cell. .

Abstract

The ongoing pandemic caused by severe acute respiratory syndrome coronavirus 2 (SARS-CoV-2) is currently affecting millions of lives worldwide. Large retrospective studies indicate that an elevated level of inflammatory cytokines and pro-inflammatory factors are associated with both increased disease severity and mortality. Here, using multidimensional epigenetic, transcriptional, in vitro, and in vivo analyses, we report that topoisomerase 1 (TOP1) inhibition suppresses lethal inflammation induced by SARS-CoV-2. Therapeutic treatment with two doses of topotecan (TPT), an FDA-approved TOP1 inhibitor, suppresses infection-induced inflammation in hamsters. TPT treatment as late as 4 days post-infection reduces morbidity and rescues mortality in a transgenic mouse model. These results support the potential of TOP1 inhibition as an effective host-directed therapy against severe SARS-CoV-2 infection. TPT and its derivatives are inexpensive clinical-grade inhibitors available in most countries. Clinical trials are needed to evaluate the efficacy of repurposing TOP1 inhibitors for severe coronavirus disease 2019 (COVID-19) in humans.

Keywords: COVID-19; SARS-CoV-2; chromatin; cytokine storm; epigenetics; inducible genes; inflammation; topoisomerase; topotecan; transcription.


Conflict of interest statement

Declaration of interests The García-Sastre Laboratory has received research support from Pfizer, Senhwa Biosciences, 7 Hills Pharma, Pharmamar, Blade Therapuetics, Avimex, Johnson & Johnson, Dynavax, Kenall Manufacturing, and ImmunityBio. A.G.-S. has consulting agreements for the following companies involving cash and/or stock: Vivaldi Biosciences, Contrafect, 7 Hills Pharma, Avimex, Vaxalto, Accurius, and Esperovax. M.J.T. is an employee of Enhanc3D Genomics. M. Spivakov is a co-founder of Enhanc3D Genomics. I. Marazzi is an inventor in the patent WO2017106466A1

Figures

None
Graphical abstract
Figure 1
Figure 1
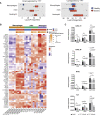
SARS-CoV-2 restructures chromatin in host cells (A) Top: normalized Hi-C contact matrices are shown for the uninfected (0 hpi) control (lower left) and 24 h post-infection (hpi; upper-right) for a representative 30-Mb region of chromosome 9. White rectangles highlight regions with strong changes in interaction patterns between conditions. Middle: pairwise correlation matrices for uninfected control and 24 hpi Hi-C experiments analysis for the same region shown in the upper panel. Bottom: PC1 values are shown along with H3K27ac ChIP-seq levels for the region depicted. (B) Distribution of A and B compartment domain sizes genome wide for uninfected control and 24 hpi A549-ACE2 cells. (C) Venn diagram schematic depicting the seven possible patterns of peak occurrence (i–vii), along with the number of peaks observed for each pattern at 0, 8, and 24 hpi. ON/OFF indicates the presence or absence of peaks, respectively. (D) Differential H3K27ac across infection time points. H3K27ac ChIP-seq peaks were classified across the infection time course into clusters by their pattern of occurrence. Heatmap indicates the normalized H3K27ac read count intensity within each unique peak (rows) for each of the three time points (columns; 0, 8, and 24 h), for the clusters (i–vii) described in (C). (E) Scatterplot comparing the PC1 values for every 25-kb region in the genome for uninfected control and infected cells (8 and 24 hpi). Data points colored red or blue indicate that they overlap with a significantly regulated H3K27ac peaks (4-fold, adjusted p value < 0.05). (F) Distribution of the change in PC1 values between uninfected and 24 hpi at the promoters of genes that are either expressed in A549-Ace2 cells, induced, or repressed by SARS-CoV-2 infection (>1.5-fold, adjusted p value < 0.05). (G) Gene expression dynamics and changes in the number of connected active enhancers presented as a heatmap of log-odds ratios. Both interaction rewiring and changes in K27ac at PIRs is taken into account. (H) Dynamics of promoter interactions and enhancer activity (proxied by K27ac) between 0 and 24 hpi for the TIPARP gene (upregulated upon infection). K27ac peaks gained at 24 hpi are highlighted in dark red (log2 fold change [LFC] > 2, padj < 0.05). Lost (blue) and gained (dark red) promoter interactions with K27ac regions (“enhancers”) at 24 hpi are shown as colored arcs and the rest shown in black. Light-gray arcs represent interactions with regions without K27ac detected at any time point.
Figure S1
Figure S1
H3K27ac profiles in SARS-CoV-2-infected A549-ACE2 cells, related to Figure 1 (A) Upper panels: Normalized Hi-C contact matrices are shown for the uninfected (0hpi) control versus 8 hours (8 hpi; leftmost panel) or 24 hours post infection with SARS-CoV-2 (24 hpi; middle left panels) for a representative 30 Mb region of chromosome 9. Normalized Hi-C contact matrices for the same chromosome is shown in Influenza A (IAV) infected and control HBTE cells in the middle-right (0hpi versus 6hpi) and right most panels (0hpi versus 18hpi). White rectangles highlight regions with strong changes in interaction patterns between conditions. Middle panels: pairwise correlation matrices for comparisons shown in the upper panel. Lower panel: PC1 values, which represent the PCA loadings describing the chromatin compartment membership (+ values for the A compartment, - values for the B compartment) are shown along with H3K27ac ChIP-seq levels for the region depicted. Cells infected for 24 hours show increased segregation of chromatin into smaller A and B compartment domains in both Influenza A and SARS-CoV-2 infected cells. (B) Distribution of A and B compartment domain sizes genome wide for uninfected control A549-ACE2 or HBTE cells, SARS-CoV-2 infected A549-ACE2 cells and IAV infected HBTE cells at the indicated time points. (C) Principle Component (PCA) analysis of ChIP-seq experimental replicates. PCA was performed across the genome using the set of peaks identified in each experimental replicate. Percentage of variance expained by the first two components is shown along the axes. PCA was performed using scikit-learn (Pedregosa et al., 2011). (D) Transcription factor binding site motif enrichment for each of the clusters shown in Figures 1C and 1D. Motif enrichment was calculated within H3K27ac-marked regions. Bar plots indicate the negative log p value of enrichment for the top 100 motif classes (see Methods). Bars are colored by motif. AP-1: Yellow; IRF: Green; NFKB: Red; STAT: Blue; Other: Grey (E) Dynamics of promoter interactions and enhancer activity (proxied by K27ac) between 0 and 24 hpi for the NFKBIZ gene that is upregulated upon infection. K27ac peaks gained at 24hpi are highlighted in dark red (log2-fold change (LFC) > 2, padj < 0.05); there were no lost H3K27ac peaks detected in this locus at the same level of stringency. NFKBIZ promoter interactions with K27ac regions (“enhancers”) are shown as colored arcs, with lost and gained interactions at 24 hpi highlighted in blue and dark-red, respectively, and the rest shown in black. Light-gray arcs represent interactions with regions without K27ac detected at any time point.
Figure 2
Figure 2
TOP1 depletion in SARS-CoV-2 infected cells inhibits induction of inflammatory genes (A) PCA plot showing the relationship between samples, replicates, and treatment conditions. (B) Heatmap showing relative changes in gene expression levels in no siRNA (no siRNA) or siTOP1 (siTOP1)-treated cells when compared to nontargeting control siRNA-treated (siSCR) cells. Shown are genes that are differentially expressed between siTOP1 and siSCR samples (adjusted p value < 0.05, fold change > 1.5). (C) Gene Ontology analyses of downregulated target genes shown in (B). (D) qPCR validation of select target genes shown in (B). Shown are the mean and SD of three replicates. p < 0.05; ∗∗p < 0.01; ∗∗∗p < 0.005, ∗∗∗∗p < 0.001 by two-tailed, unpaired Students’ t test. Data are plotted relative to the corresponding uninfected controls. (E) Western blot showing TOP1 and tubulin levels in no siRNA (no si), control siRNA (siSCR)-, or TOP1 siRNA (siTOP1)-treated uninfected and infected cells. Shown is a representative western blot of three independent experiments. (F) Boxplots showing changes in gene expression levels upon SARS-CoV-2 infection, as quantified by RNA-seq, for all expressed genes (Exp), TOP1-dependent induced genes (Dep), and TOP1-independent induced genes (Indep). (G) Violin plots showing changes in PC1 (delta PC1) at 8 and 24 hpi at expressed genes (Exp), TOP1-dependent induced genes (Dep), and TOP1-independent induced genes (Indep). Horizontal lines indicate the means. (H) Violin plots showing changes in H3K27ac levels (delta H3K27ac) for 8 and 24 hpi at expressed genes (Exp), TOP1-dependent induced genes (Dep), and TOP1-independent induced genes (Indep). Horizontal lines indicate the means.
Figure S2
Figure S2
TPT treatment phenocopies siRNA-mediated TOP1 depletion in SARS-CoV-2-infected A549-ACE2 cells, related to Figure 2 (A) qPCR analysis of CXCL3, CXCL2, IL6, EGR1, CXCL8 and TNFAIP3 expression levels in the presence and absence of 0nM, 100nM or 500nM TPT at 8 or 24h post infection. Data are shown relative to the corresponding uninfected controls. Bars show the mean and standard deviation of 3 replicates. p < 0.05, ∗∗p < 0.01, ∗∗∗p < 0.001, ∗∗∗∗p < 0.0001, ns: not significant by a two tailed Student’s t test. (B) Percentage of Vero-E6 cells infected with SARS-CoV-2 48h post infection and in the presence of the indicated concentration of TPT or Remdesivir. Shown are the mean and standard deviation of two independent replicates. Values shown are relative to DMSO (no drug) treated samples. Pink highlighted area shows the 95% confidence interval of the fitted curve (non-linear 4 parameter inhibitor versus response). (C) Cell proliferation assays of Vero-E6 cells treated with the indicated concentrations of TPT or Remdesivir. Shown are the mean and standard deviation of two independent replicates. Values shown are relative to DMSO (no drug) treated samples. 95% confidence intervals (CI) could not be determined for the fitted curve (non-linear 4 parameter inhibitor versus response)
Figure 3
Figure 3
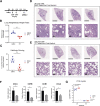
TPT treatment reduces inflammatory gene expression in SARS-CoV-2 infected hamsters (A) Schematic showing the infection and treatment regime used. (B) PCA plot showing the relationship between treatment and infection groups. (C) Heatmap showing gene expression levels of genes that are dysregulated with TPT treatment in uninfected (green), DMSO- (red and purple), or TPT-treated (blue and yellow) hamsters at days 4 and 6 post-infection. (D) Gene Ontology analysis of genes that are downregulated with TPT treatment at days 4 (top) and 6 (bottom) post-infection. (E) Representative hematoxylin and eosin (H&E) scan of lungs in DMSO-treated, infected hamsters at 4 days post-infection. Arrow indicates diffuse lung inflammatory damage, bronchiolar epithelium cell death, bronchiolar luminal secretion, and hemorrhage. Arrowheads indicate diffuse alveoli destruction with massive immune cell infiltration and exudation. Open arrows indicate vasculitis. (F) Representative H&E scan of lungs in infected, DMSO-treated hamsters 6 days post-infection. Lung tissue consolidation affected most of the lung lobe examined. Arrowhead indicates bronchial secretion, infiltration and alveolar space exudation, immune cell infiltration, and hemorrhage. Arrow indicates alveolar and bronchiolar cell proliferation. (G) Representative H&E scan of lungs in infected, TPT-treated hamsters 4 days post-infection showing diffuse milder inflammatory damage. Arrows indicate bronchiolar epithelium cell death with milder peribronchiolar infiltration. Arrowheads indicate diffuse alveolar wall thickening with capillary congestion. No conspicuous alveolar space infiltration, exudation, or hemorrhage was observed. Open arrows indicate that vasculitis is very mild and rare. (H) Representative H&E scan of lungs in infected, TPT-treated hamsters 6 days post-infection showing patchy lung tissue consolidation with cell proliferation. Most alveolar areas are without exudation and infiltration.
Figure 4
Figure 4
TPT suppresses gene programs upregulated in autopsy lung from COVID-19 patients (A) GSEA of lung tissue gene expression profiles from COVID-19 deceased patients versus healthy patients (Nienhold et al., 2020). Signed −log10 adjusted p values indicate enrichment of downregulated (top panel) and upregulated (bottom panel) gene signatures from TPT-treated hamsters infected with SARS-CoV-2. Sign of enrichment is given by the normalized enrichment score (NES). Dashed lines indicate a significance levels of p = 0.05. Differences in mean NES are shown. p = 10−3; ∗∗p = 5 × 10−4, ∗∗∗p = 10−7. (B) Expression in lung autopsy tissue of COVID-19 patients and healthy controls (Nienhold et al., 2020) of genes downregulated in TPT-treated SARS-CoV-2-infected hamsters (log2(absolute fold change [log2|FC|] > 1, false discovery rate [FDR] = 10%). Patient groups are indicated by the topmost bar. Gene set enrichment scores, calculated as −log10(p)sign(NES), are indicated in the middle bar. The lower heatmap shows the individual gene expression profile of the indicated TPT-inhibited gene for a given patient (columns). Heatmap is sorted by column from the highest (left) to lowest enrichment score (right).
Figure S3
Figure S3
TPT suppresses gene programs in immune cell subsets, related to Figure 3 (A) Gene set enrichment analysis of lung-cell-type gene expression profiles from bronchoalveolar lavage fluid (BALF) of COVID19 patients with moderate and severe disease versus healthy patients (Liao et al., 2020). Signed –log10 adjusted P values indicate enrichment of downregulated (left panel) and upregulated (right panel) gene signatures from TPT-treated hamsters infected with SARS-CoV-2. The sign of enrichment is given by the normalized enrichment score (NES). (B) Expression by lung immune-cell type (macrophage, dendritic cells or neutrophils) of severe COVID19 patients and healthy controls (Liao et al., 2020) of genes downregulated in TPT-treated Sars-CoV-2-infected hamsters (log2|FC| > 1, FDR = 10%). Cell types are indicated by the topmost bar and in the column names; Macrophages: Orange, myeloid Dendritic cells (mDC): Green and Neutrophils: Purple. Patient groups are indicated by the second bar, where healthy patients are in blue, and severe COVID19 patiends in red. Gene set enrichment scores, calculated as −log10(P)sign(NES) are indicated in the middle bar. The sign of enrichment is given by the normalized enrichment score (NES). Positive, higher scores indicate that TPT-inhibited genes are more upregulated in a given patient, whereas negative, lower scores indicate that TPT-inhibited genes are more downregulated in a given patient. The lower heatmap shows the individual gene expression profile of the indicated TPT-inhibited gene for a given patient (in columns). Heatmap columns are sorted by cell type and enrichment score from the highest (left) to lowest enrichment score (right). (C) THP1 cells were transfected with purified SARS-CoV-2 viral RNA (vRNA) or treated with filtered, virus-free conditioned media supernatants from SARS-CoV infected Calu-3 cells (see STAR Methods) in the presence or absence of 100nM or 500nM of TPT. Expression of TOP1-dependent inflammatory genes were then measured by qPCR analysis. Data shown are mean and standard deviation of 4-6 biological replicates per condition. p < 0.05; ∗∗p < 0.01, ∗∗∗p < 0.001, ∗∗∗∗p < 0.0001 by two tailed Student’s T Test. Data are plotted relative to Actin B expression.
Figure S4
Figure S4
Reduced TPT dosages have similar beneficial effects in SARS-CoV-2-infected hamsters, related to Figure 3 (A) Schematic showing infection and treatment regime in 7-10 week old hamsters. (B) Lung weight to body weight ratios of Hamsters infected with 1E4 PFU SARS-CoV-2 at Day 4 post infection, and treated with either DMSO (red) or 2mg/kg TPT (blue). Each dot represents an individual animal, and lines indicate the mean and SEM of Lung/Body weight ratios. (C) Scatterplots depicting the percent of lung area that is involved in Broncho Pneumonia, as blindly scored by the pathologist (A.M). Each dot represents an individual animal, and the lines indicate the mean and SEM. (D,E) Representative H&E sections of the left lung lobe of infected hamsters at day 4 post infection, and treated either with DMSO (D) or 2mg/kg TPT (E). Scale bar: 5mm and 250uM for the upper and lower panels respectively (F) Inflammatory gene expression in DMSO or TPT infected hamsters at day 4 post infection. Bars show the mean and SEM of 4 animals. p < 0.05 by a one tailed Student’s t test, assuming equal variances. Data are plotted relative to Tbp expression. (G) Plaque assays were performed on lysates derived from the lungs of hamsters infected with 1E5 PFU of SARS-CoV-2 and treated with either DMSO vehicle control or 2mg/kg TPT. Lungs were isolated at Days 4 or 8 post infection. Each point represents one animal (n = 4/condition). Shown are the mean and SEM of the Log10(PFU yield/mL). p values were calculated using a two-tailed Student’s t test. DL: Detection limit
Figure 5
Figure 5
Late treatment of TPT in K18-hACE2 mice provides survival benefit during SARS-CoV-2 infection (A) Schematic describing treatment regime used in mice. (B) Survival curve of K18-hACE2 mice infected with 1E4 plaque-forming units (PFUs) SARS-CoV-2. Mice were treated with either DMSO vehicle control (n = 15; DMSO, blue) or 2 mg/kg TPT (n = 21; TPT, red) at days 4 and 5 post-infection. p values were determined by log-rank (Mantel-Cox) test, and hazard ratios (log-rank) are shown. ∗∗p < 0.01. (C) Corresponding curves showing the average body weight of mice relative to their initial starting weights through the course of the infection with 1E4 PFU SARS-CoV-2. The number of mice at each day is indicated in the table below. ∗∗p < 0.01, by two way mixed model ANOVA. Error bars show the mean and SEM of mice (DMSO, n = 15; TPT n = 21). (D) Percentage of DMSO- or TPT-treated mice that have a maximum weight loss of ≤15% or >15% of their starting weights. p < 0.05, Fisher’s exact test. (E) Viral titers in the lungs of DMSO- or TPT-treated SARS-CoV-2-infected mice at days 7 and 14 post-infection. ns, not significant by two-tailed Student’s t test. Mean and SEM are shown. (F) qPCR analysis of the indicated inflammatory genes at days 7 post-infection. ns, not significant; p < 0.05; ∗∗p < 0.01; ∗∗∗p < 0.001; ∗∗∗∗p < 0.0001 by two-tailed Students t test. Each point represents an individual mouse. Means and SD are shown. Data are normalized to hypoxanthine guanine phosphoribosyl transferase (HPRT) expression in each sample. (G) Post-recovery weight gain at the indicated days post-infection in DMSO-treated (n = 8) or TPT-day 4+5-treated (n = 8) mice. Weights are normalized to the weights of mice at day 14 post-infection. ns, not significant, by Students’ t test. (H) Neutralizing antibody titers in DMSO or TPT-treated mice. ns, not significant by two-tailed Students’ t test. Mean and SEM are shown.
Figure S5
Figure S5
Late treatment of TPT in K18-hACE2 mice overs no survival benefit during SARS-CoV-2 infection, related to Figure 5 (A) Schematic showing infection and treatment regime in mice. Groups are color coded by treatment regime. Viral isolate USA-WA1/2020 (NR-52281) was used in these experiments. (B) Survival curve of K18-hACE2 mice infected with 1E4 PFU of SARS-CoV-2 and subsequently subjected to the indicated TPT treatment regimes. Number of mice used are indicated in the legend. Blue: DMSO vehicle control only (n = 9); Red: TPT 2mg/kg on Days 1 and 2 post infection (n = 10); Green: TPT 2mg/kg on Days 3 and 4 post infection (n = 10). Ns: not significant, by logrank Mantel-Cox test. (C) Weight loss curves in surviving mice shown in B. Numbers of mice at the end and start (end/start) points of the experiment are indicated in the legend keys. Weights are shown as means of the percentage of starting weights. Error bars show the SEM of each group. Blue: DMSO only; Red: TPT 2mg/kg on Days 1 and 2 post infection; Green: TPT 2mg/kg on Days 3 and 4 post infection; Purple: TPT 2mg/kg on Days 4 and 5 post infection. ∗∗p < 0.01; ns:not significant, by two-way mixed model ANOVA analysis.

Update of

  • Topoisomerase 1 inhibition therapy protects against SARS-CoV-2-induced inflammation and death in animal models.
    Yuin Ho JS, Wing-Yee Mok B, Campisi L, Jordan T, Yildiz S, Parameswaran S, Wayman JA, Gaudreault NN, Meekins DA, Indran SV, Morozov I, Trujillo JD, Fstkchyan YS, Rathnasinghe R, Zhu Z, Zheng S, Zhao N, White K, Ray-Jones H, Malysheva V, Thiecke MJ, Lau SY, Liu H, Junxia Zhang A, Chak-Yiu Lee A, Liu WC, Aydillo T, Salom Melo B, Guccione E, Sebra R, Shum E, Bakker J, Kaufman DA, Moreira AL, Carossino M, Balasuriya UBR, Byun M, Miraldi ER, Albrecht RA, Schotsaert M, Garcia-Sastre A, Chanda SK, Jeyasekharan AD, TenOever BR, Spivakov M, Weirauch MT, Heinz S, Chen H, Benner C, Richt JA, Marazzi I. Yuin Ho JS, et al. bioRxiv [Preprint]. 2020 Dec 1:2020.12.01.404483. doi: 10.1101/2020.12.01.404483. bioRxiv. 2020. Update in: Cell. 2021 May 13;184(10):2618-2632.e17. doi: 10.1016/j.cell.2021.03.051. PMID: 33299999 Free PMC article. Updated. Preprint.

References

    1. Amanat F., Stadlbauer D., Strohmeier S., Nguyen T.H.O., Chromikova V., McMahon M., Jiang K., Arunkumar G.A., Jurczyszak D., Polanco J. A serological assay to detect SARS-CoV-2 seroconversion in humans. Nat. Med. 2020;26:1033–1036. - PMC - PubMed
    1. Amemiya H.M., Kundaje A., Boyle A.P. The ENCODE Blacklist: Identification of Problematic Regions of the Genome. Sci. Rep. 2019;9:9354. - PMC - PubMed
    1. André T., Louvet C., Maindrault-Goebel F., Couteau C., Mabro M., Lotz J.P., Gilles-Amar V., Krulik M., Carola E., Izrael V., de Gramont A. CPT-11 (irinotecan) addition to bimonthly, high-dose leucovorin and bolus and continuous-infusion 5-fluorouracil (FOLFIRI) for pretreated metastatic colorectal cancer. GERCOR. Eur. J. Cancer. 1999;35:1343–1347. - PubMed
    1. Banerjee A., Nasir J.A., Budylowski P., Yip L., Aftanas P., Christie N., Ghalami A., Baid K., Raphenya A.R., Hirota J.A. Isolation, Sequence, Infectivity, and Replication Kinetics of Severe Acute Respiratory Syndrome Coronavirus 2. Emerg. Infect. Dis. 2020;26:2054–2063. - PMC - PubMed
    1. Banerjee A.K., Blanco M.R., Bruce E.A., Honson D.D., Chen L.M., Chow A., Bhat P., Ollikainen N., Quinodoz S.A., Loney C. SARS-CoV-2 Disrupts Splicing, Translation, and Protein Trafficking to Suppress Host Defenses. Cell. 2020;183:1325–1339.e21. - PMC - PubMed

Publication types