

Behavioral responses across a mosaic of ecosystem states restructure a sea otter-urchin trophic cascade
- PMID: 33836567
- PMCID: PMC7980363
- DOI: 10.1073/pnas.2012493118
Behavioral responses across a mosaic of ecosystem states restructure a sea otter-urchin trophic cascade
Abstract
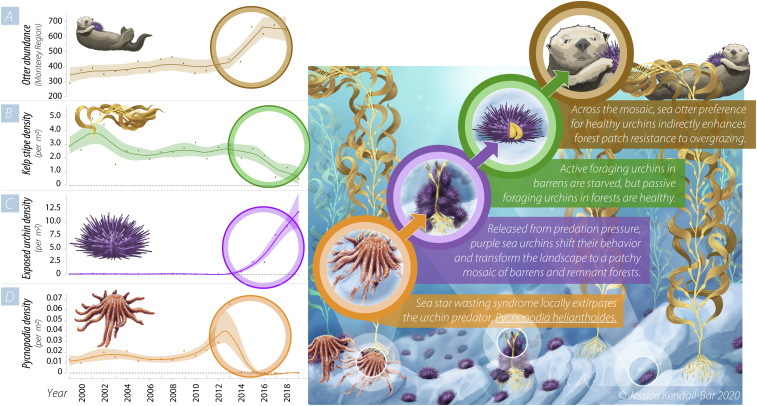
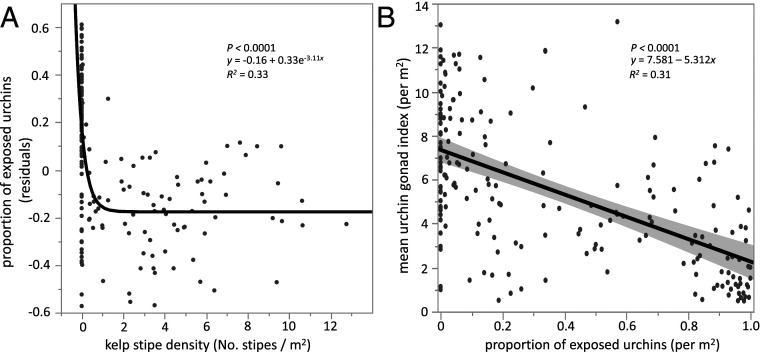
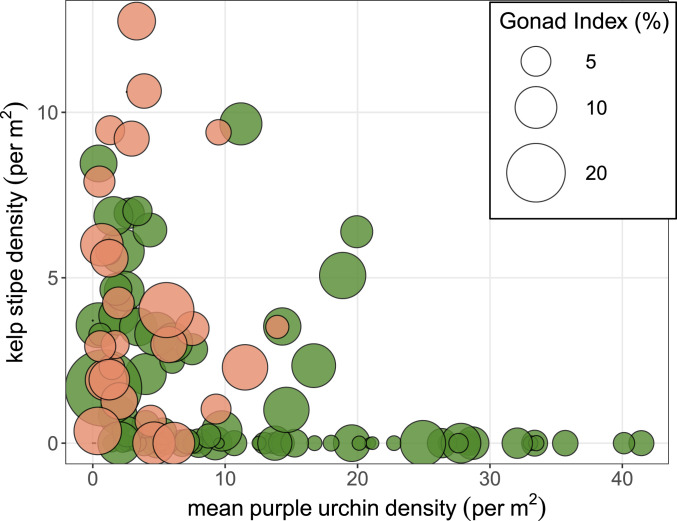
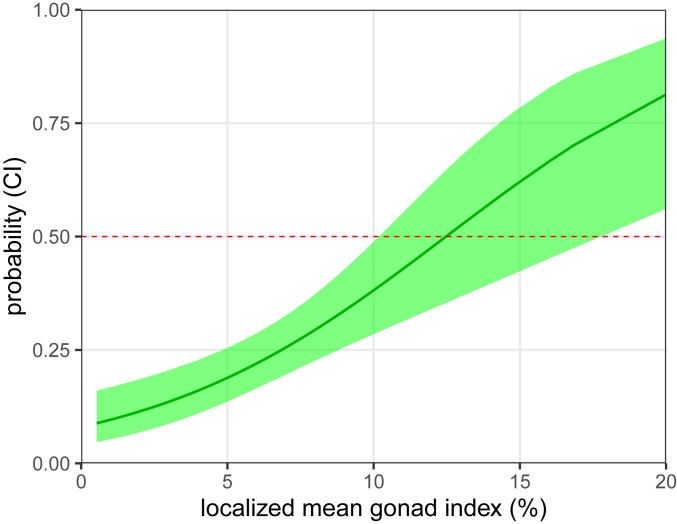
Consumer and predator foraging behavior can impart profound trait-mediated constraints on community regulation that scale up to influence the structure and stability of ecosystems. Here, we demonstrate how the behavioral response of an apex predator to changes in prey behavior and condition can dramatically alter the role and relative contribution of top-down forcing, depending on the spatial organization of ecosystem states. In 2014, a rapid and dramatic decline in the abundance of a mesopredator (Pycnopodia helianthoides) and primary producer (Macrocystis pyrifera) coincided with a fundamental change in purple sea urchin (Strongylocentrotus purpuratus) foraging behavior and condition, resulting in a spatial mosaic of kelp forests interspersed with patches of sea urchin barrens. We show that this mosaic of adjacent alternative ecosystem states led to an increase in the number of sea otters (Enhydra lutris nereis) specializing on urchin prey, a population-level increase in urchin consumption, and an increase in sea otter survivorship. We further show that the spatial distribution of sea otter foraging efforts for urchin prey was not directly linked to high prey density but rather was predicted by the distribution of energetically profitable prey. Therefore, we infer that spatially explicit sea otter foraging enhances the resistance of remnant forests to overgrazing but does not directly contribute to the resilience (recovery) of forests. These results highlight the role of consumer and predator trait-mediated responses to resource mosaics that are common throughout natural ecosystems and enhance understanding of reciprocal feedbacks between top-down and bottom-up forcing on the regional stability of ecosystems.
Keywords: community regulation; ecosystem functioning; species interactions; stability; trophic cascade.
Conflict of interest statement
The authors declare no competing interest.
Figures
Similar articles
-
From the predictable to the unexpected: kelp forest and benthic invertebrate community dynamics following decades of sea otter expansion.Oecologia. 2018 Dec;188(4):1105-1119. doi: 10.1007/s00442-018-4263-7. Epub 2018 Oct 11. Oecologia. 2018. PMID: 30311056
-
Sudden collapse of a mesopredator reveals its complementary role in mediating rocky reef regime shifts.Proc Biol Sci. 2018 Jul 25;285(1883):20180553. doi: 10.1098/rspb.2018.0553. Proc Biol Sci. 2018. PMID: 30051864 Free PMC article.
-
Indirect food web interactions: sea otters and kelp forest fishes in the Aleutian archipelago.Oecologia. 2006 Jan;146(4):623-31. doi: 10.1007/s00442-005-0230-1. Epub 2005 Sep 27. Oecologia. 2006. PMID: 16193296
-
From Individual Calcifiers to Ecosystem Dynamics: Ocean Acidification Effects on Urchins and Abalone.Integr Comp Biol. 2024 Sep 17;64(2):290-305. doi: 10.1093/icb/icae096. Integr Comp Biol. 2024. PMID: 38986515 Review.
-
Testing the efficacy of sea urchin exclusion methods for restoring kelp.Mar Environ Res. 2021 Aug;170:105439. doi: 10.1016/j.marenvres.2021.105439. Epub 2021 Jul 28. Mar Environ Res. 2021. PMID: 34365122 Review.
Cited by
-
Exploring indirect effects of a classic trophic cascade between urchins and kelp on zooplankton and whales.Sci Rep. 2024 Apr 29;14(1):9815. doi: 10.1038/s41598-024-59964-x. Sci Rep. 2024. PMID: 38684814 Free PMC article.
-
Two decades of change in sea star abundance at a subtidal site in Puget Sound, Washington.PLoS One. 2023 Jun 9;18(6):e0286384. doi: 10.1371/journal.pone.0286384. eCollection 2023. PLoS One. 2023. PMID: 37294819 Free PMC article.
-
Drivers of spatiotemporal variability in a marine foundation species.Ecol Appl. 2025 Jan;35(1):e3092. doi: 10.1002/eap.3092. Ecol Appl. 2025. PMID: 39957275 Free PMC article.
-
Consequences of kelp forest ecosystem shifts and predictors of persistence through multiple stressors.Proc Biol Sci. 2024 Feb 14;291(2016):20232749. doi: 10.1098/rspb.2023.2749. Epub 2024 Feb 7. Proc Biol Sci. 2024. PMID: 38320605 Free PMC article.
-
Kelp-forest dynamics controlled by substrate complexity.Proc Natl Acad Sci U S A. 2022 Feb 22;119(8):e2103483119. doi: 10.1073/pnas.2103483119. Proc Natl Acad Sci U S A. 2022. PMID: 35181602 Free PMC article.
References
-
- Estes J. A., Tinker M. T., Williams T. M., Doak D. F., Killer whale predation on sea otters linking oceanic and nearshore ecosystems. Science 282, 473–476 (1998). - PubMed
-
- Schmitz O. J., Direct and indirect effects of predation and predation risk in old-field interaction webs. Am. Nat. 151, 327–342 (1998). - PubMed
-
- Elderd B. D., Bottom-up trait-mediated indirect effects decrease pathogen transmission in a tritrophic system. Ecology 100, e02551 (2019). - PubMed
-
- Pace M. L., Cole J. J., Carpenter S. R., Kitchell J. F., Trophic cascades revealed in diverse ecosystems. Trends Ecol. Evol. 14, 483–488 (1999). - PubMed
-
- Grant J., Hopcraft C., Sinclair A. R. E., Packer C., Planning for success: Serengeti lions seek prey accessibility. J. Anim. Ecol. 74, 559–566 (2005).
Publication types
MeSH terms
LinkOut - more resources
Full Text Sources
Other Literature Sources
Miscellaneous
