. 2021 Mar 16;118(11):e2022241118.
doi: 10.1073/pnas.2022241118. Epub 2021 Mar 8.

Legume-microbiome interactions unlock mineral nutrients in regrowing tropical forests

Affiliations

Legume-microbiome interactions unlock mineral nutrients in regrowing tropical forests

Dimitar Z Epihov et al. Proc Natl Acad Sci U S A. .

Abstract

Legume trees form an abundant and functionally important component of tropical forests worldwide with N2-fixing symbioses linked to enhanced growth and recruitment in early secondary succession. However, it remains unclear how N2-fixers meet the high demands for inorganic nutrients imposed by rapid biomass accumulation on nutrient-poor tropical soils. Here, we show that N2-fixing trees in secondary Neotropical forests triggered twofold higher in situ weathering of fresh primary silicates compared to non-N2-fixing trees and induced locally enhanced nutrient cycling by the soil microbiome community. Shotgun metagenomic data from weathered minerals support the role of enhanced nitrogen and carbon cycling in increasing acidity and weathering. Metagenomic and marker gene analyses further revealed increased microbial potential beneath N2-fixers for anaerobic iron reduction, a process regulating the pool of phosphorus bound to iron-bearing soil minerals. We find that the Fe(III)-reducing gene pool in soil is dominated by acidophilic Acidobacteria, including a highly abundant genus of previously undescribed bacteria, Candidatus Acidoferrum, genus novus. The resulting dependence of the Fe-cycling gene pool to pH determines the high iron-reducing potential encoded in the metagenome of the more acidic soils of N2-fixers and their nonfixing neighbors. We infer that by promoting the activities of a specialized local microbiome through changes in soil pH and C:N ratios, N2-fixing trees can influence the wider biogeochemical functioning of tropical forest ecosystems in a manner that enhances their ability to assimilate and store atmospheric carbon.

Keywords: Acidobacteria; N2-fixing legume trees; metagenomics; mineral weathering; tropical forest.


Conflict of interest statement

The authors declare no competing interest.

Figures
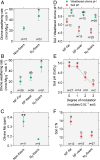
Fig. 1.
Fig. 1.
N2-fixing legume trees are linked to greater mineral weathering in tropical forest soils as well as lower soil C:N ratio and soil pH. (A) N2-fixers reveal doubled weathering rates compared to nonfixers (N2-fixers: mean = 47.21, SD = 65.89, nonfixers: mean = 24.18, SD = 35.76; two-tailed Welch’s t test, P = 0.026, Welch’s corrected t = 2.28, DFn = 70.14, Cohen’s d = 0.43). (B) NF-near N2-fixers show intermediate olivine weathering rates between NF-far and N2-fixers (N2-fixers: mean = 47.21, SD = 65.89, NF-near: mean = 27.79, SD = 37.41, NF-far: mean= 20.27, SD = 33.96; one-way classic ANOVA, P = 0.037, F = 3.40, DFd = 2, η2 = 0.052). (C) Mo content of olivine weathered in soils beneath N2-fixers is lower than that of nonfixing trees (N2-fixers: mean = 0.1692, SD = 0.0171, nonfixers: mean = 0.3546, SD = 0.1845; two-tailed Welch’s t test, P = 0.0076, Welch’s corrected t = 3.30, DFn = 10.37, Cohen’s d = 1.42). (D) Soil-weathered olivine pH is significantly lower beneath N2-fixers and NF-near in comparison to NF-far (N2-fixers: mean = 5.45, SD = 0.22, NF-near: mean = 5.59, SD = 0.25, NF-far: mean = 5.72, SD = 0.22; one-way classic ANOVA, P = 0.0002, F = 10.03, DFd = 2, η2 = 0.282) with similar pattern observed in soil pH (N2-fixers: mean = 4.54, SD = 0.46, NF-near: mean = 4.62, SD = 0.54, NF-far: mean = 5.17, SD = 0.19; one-way ANOVA, P = 0.0006, F = 8.73, DFd = 2, η2 = 0.263). (E) Degree of nodulation (number of nodules per 0.5 L soil) is associated to acidification of soil (0: mean = 4.85, SD = 0.45, 1: mean = 4.82, SD = 0.41, 2: mean = 4.27, SD = 0.49, 3: mean = 3.92, SD = 0.16; Welch’s ANOVA, P = 0.0027, W = 14.39, DFd = 6.654, ω2 = 0.790). (F) Soil C:N ratio is significantly lower beneath N2-fixers and NF-near relative to NF-far from fixers (N2-fixers: mean = 12.22, SD = 1.06, NF-near: mean = 12.10, SD = 1.01, NF-far: mean = 13.90, SD = 1.36; one-way classic ANOVA, P = 9.484e-05, F = 11.17, DFd = 2, η2 = 0.305). Multiple comparisons are carried out using Fisher’s least significant difference (LSD) tests or unpaired t tests with Welch’s correction (in the cases of Welch’s ANOVA). Error bars indicate SEM.
Fig. 2.
Fig. 2.
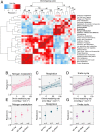
Metagenomics of the microbial community associated with weathered minerals in tropical forests link increased respiration, nitrogen, and carbohydrate metabolic potential of the microbial community to enhance weathering beneath N2-fixers. (A) Correlation heatmap matrix of gene abundance allocated to MG-RAST Subsystem-Level 1 (“High Level Metabolic”) pathways for the 12 sequenced metagenomes of reacted olivine at different weathering rates reveals that well-supported cluster (bootstrap value >70) coupling olivine weathering rates to respiration, N, and carbohydrate metabolism and virulence and defense response potential within the metagenome. The heatmap is constructed using R with Manhattan dissimilarity index, complete clustering method, and Pearson test correlations; values in italics indicate bootstrapping for each major node. High level pathways encompassing the cumulative abundance of all N metabolism (B and E) and respiration (C and F) genes and the Krebs (tricarboxylic acid) cycle (D and G) genes all correlate with weathering rates (Pearson test, *P < 0.05; respiration: Pearson correlation test r = 0.607, P = 0.036, F = 5.84, DFd =10, N metabolism: Pearson correlation test r = 0.606, P = 0.037, F = 5.79, DFd = 10, Krebs cycle: Pearson correlation test r = 0.619, P = 0.032, F = 6.20, DFd = 10) and reveal patterns of increase following the order NF-far < NF-near < N2-fixers. Gene abundance in BG is normalized using the single copy gene rpoC (DNA-directed RNA polymerase beta' subunit) to account for number of sequenced genomes. Error bars indicate SEM.
Fig. 3.
Fig. 3.
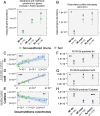
Implications of improved metagenomic potential for Fe and S reduction and anaerobic metabolism to release of Fe-bound P—a benefit N2-fixers may also pass to neighboring nonfixing trees. (A) Significant enrichments in Fe reduction gene orthologs (cumulative gene abundance including decaheme and multiheme cytochrome c genes) are observed in the soil mineral metagenomes of N2-fixers and neighboring nonfixers near them (N2-fixers: mean = 9.83e-6, SD = 5.91 to 6, n = 6, NF-near: mean = 8.06e-6, SD = 1.38e-6, n = 3, NF-far: mean = 2.54e-6, SD = 5.41e-7, n = 3, Welch’s ANOVA, **P = 0.0047, W = 21.44, DFd = 4.58, ω2 = 0.844). (B) Sulfite reduction genes (cumulative abundance of sulfite reductases dsr A, B, and C) are signficantly enriched in the soil mineral metagenomes of N2-fixes and nonfixers near fixers relative to nonfixers far from fixers (N2-fixers: mean = 1.369e-5, SD = 7.97e-6, n = 6, NF-near: mean = 1.370e-5, SD = 3.6e-6, n = 3, NF-far: mean = 5.21e-6, SD = 1.15e-6, n = 3, Welch’s ANOVA, *P = 0.0286, W = 8.90, DFd = 4.39, ω2 = 0.681). (C) The anaerobic marker fnr correlates positively with deca/multiheme cytochrome c genes involved in Fe(III) reduction (Pearson correlation test r = 0.828, ***P = 0.0001, F = 28.33, DFd = 13). (D) The anaerobic marker norB correlates positively with deca/multiheme cytochrome c genes (Pearson correlation test r = 0.971, ***P = 2e-9, F = 213.3, DFd = 13). (E) The aerobic marker catalase correlates negatively with deca/multiheme cytochrome c genes (Pearson correlation test r = - 0.660, **P = 0.0074, F = 10.02, DFd = 13). (F) The PICRUSt-predicted fnr gene abundance is significantly greater in soil metagenomes of N2-fixers and NF-near relative to NF-far trees (N2-fixers: mean = 7.68e-4, SD = 4.54e-5, n = 21; NF-Near: mean = 7.26e-4, SD = 4.08e-5, n = 13; NF-Far: mean = 7.06e-4, SD = 4.00e-5, n = 12; Welch’s ANOVA **P = 0.0012, W = 8.881, DFd = 25.78, ω2 = 0.354). (G) The PICRUSt-predicted norB gene abundance is significantly greater in soil metagenomes of N2-fixers and NF-near relative to NF-far trees (N2-fixers: mean = 1.54e-4, SD = 2.20e-5, n = 21, NF-Near: mean = 1.56e-4, SD = 1.99e-5, n = 13, NF-Far: mean = 1.36e-4, SD = 1.52e-5, n = 12; Welch’s ANOVA *P = 0.012, W = 5.278, DFd = 26.62, ω2 = 0.224). (H) The PICRUSt-predicted catalase (CAT) gene abundance is significantly lower in soil metagenomes of N2-fixers and NF-near relative to NF-far trees (N2-fixers: mean = 1.93e-4, SD = 5.09e-5, n = 21, NF-Near: mean = 2.00e-4, SD = 2.82e-5, n = 13, NF-Far: mean = 2.87e-4, SD = 5.23e-5, n = 12; Welch’s ANOVA ***P = 6.22e-5, W = 14.636, DFd = 24.96, ω2 = 0.494). Multiple comparisons are carried out using unpaired t tests with Welch’s correction. Error bars reveal SEM.
Fig. 4.
Fig. 4.
The Fe cycling gene pool in tropical forest soils is dominated by acidophilic Acidobacteriia. Characterization of the MAGs of Ca. Acidoferrum panamensis, genus novus, species novum, and Ca. Acidoferrum typicum, species novum (part of the newly proposed order Ca. Acidoferrales, ordo novus) compared to the known Fe(III) reducer Acidobacterium capsulatum reveals that this new group of uncultured acidobacteriia may be the most numerous Fe cyclers in the tropical soil microbiome. (A) Members of class Acidobacteriia (phylum Acidobacteria) dominate the pools of TIGRFAM03507-03509 domain hits involved in Fe(III) reduction across tropical forest soils. (B) The MGX-based relative abundance of metagenomic reads mapping to Acidobacteria exhibit a strong positive correlation with the summed metagenomic relative abundance of MtrC/OmcA, DmsE/MtrA, and MtrB/PioB domain hits (Pearson correlation test r = 0.731, **P = 0.0030, F = 13.77, DFd = 12). (C) The QIIME 16S rRNA-based relative abundance of Acidobacteriia exhibits a negative correlation with soil pH (Pearson correlation test r = − 0.513, ***P = 0.0004, F = 15.00, DFd = 42). (D) The QIIME 16S rRNA-based relative abundance of Acidobacteriia is significantly greater in soils beneath N2-fixing legume trees and nonfixing trees near N2-fixers compared to soils of nonfixing trees far from N2-fixers (N2-fixers: mean = 0.0788, SD = 0.0668, n = 21, NF-Near: mean = 0.0867, SD = 0.0456, n = 13, NF-Far: mean = 0.0562, SD = 0.0328, n = 12; one-way classic ANOVA, ***P = 0.0003, F = 9.788, DFd = 43, η2 = 0.313). (E) Heatmap revealing the BLAST P values (log-normalized) of hits against a set of selected Fe cycling proteins (refer to the Main Text for more details). (F) The IDTAXA classifier 16S rRNA hits against the GTDB (set at default parameters) reveal that the relative abundance of Ca. Acidoferrum is significantly greater in soil microbiomes of N2-fixers and nonfixers near N2-fixers relative to nonfixers far from N2-fixers (N2-fixers: mean = 0.0288, SD = 0.0120, n = 21, NF-Near: mean = 0.0288, SD = 0.0141, n = 13, NF-Far: mean = 0.0131, SD = 0.0040, n = 10; Welch’s ANOVA, ***P = 1.25e-05, W = 18.82, DFd = 23.83, ω2 = 0.571). (G) The relative abundance of Ca. Acidoferrum negatively correlates with soil pH (Spearman correlation test, rho = - 0.395, **P = 0.0096, DFd = 40). (H) The relative abundance of Ca. Acidoferrum negatively correlates with soil C:N (Spearman correlation test, rho = − 0.607, ***P < 0.0001, DFd = 41). Multiple comparisons are carried out using Post-Hoc Fisher LSD tests (classic ANOVA) or unpaired t tests with Welch’s correction (Welch’s ANOVA). Error bars show SEM.
Fig. 5.
Fig. 5.
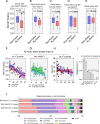
N2-fixing legumes modify the soil microbiome through changes in soil pH and C:N ratio. (A) Under-crown sampling from our five sites reveals that N2-fixers have on average more acidic topsoil than nonfixers (unpaired two-tailed t test, P = 0.017, t = 2.48, DFn = 26, Cohen’s d = 0.688). (BE) Pairing of N2-fixing and nonfixing trees at different area sizes (scales) demonstrate that N2-fixers have significantly lower under-crown soil pH than nonfixers when paired at 1,000 m2 or 500 m2 scales with the effect fading at the 250 m2 and near absent at the 50 m2 scale (paired two-tailed t tests, *P < 0.05 comparing site means). (F) The BA of N2-fixers at the 25 m2 scale significantly correlates with soil pH for both fixers and nonfixers (Pearson test, ***P < 0.0001, r = −0.78 for nonfixers and Pearson test, **P = 0.0042, r = -0.60 for N2-fixers); (G) The BA of N2-fixers at the 1,000 m2 scale significantly correlates with soil pH for 6 to 50 y old forests (Pearson test, **P = 0.0098, r = −0.30, n = 72) but not for 0- to 5-y-old forests (Pearson test, ns P = 0.615, r = −0.12, n = 19). This is consistent with fixer effects on soil pH associated with their successional growth and symbiotic N2-fixation in the course of forest secondary succession rather than initial species filtering at the onset of secondary successional processes. (H) The BA of N2-fixers at the 25 m2 significantly correlates with soil C:N under the crown of nonfixers (Pearson test, *P = 0.0297, r = −0.42), but not fixers (Pearson test, ns P = 0.766, r = −0.06), suggesting that the presence of fixers instigates changes in organic matter composition beneath nonfixers that is dependent on the percent BA occupied by N2-fixers locally. (I) PERMANOVA R2 highlights soil pH and C:N as the major covariates of soil microbiome composition (non-metric multidimensional scaling analysis with Manhattan dissimilarity index of species-level operational taxonomic units [OTUs]). Soil elemental concentrations are based on nitric acid digests of soil powders. (J) Analysis of nonfixer soil microbiomes at different distances away from N2-fixers (2.5 m, n = 11, 5.0 m, n = 11, and >7.0 m, n = 3) and N2-fixers (n = 21) reveals stepwise changes in the relative abundance of major prokaryotic phyla (distance effect on the microbiomes of nonfixing trees: PERMANOVA P = 0.014, R2 = 0.152; Manhattan distance matrix based on phylum-level OTUs). A detailed account of methodology behind the pairing at different scales can be found in Dataset S1.

Similar articles

Cited by

References

    1. ter Steege H., et al. ., Continental-scale patterns of canopy tree composition and function across Amazonia. Nature 443, 444–447 (2006). - PubMed
    1. Hedin L. O., Brookshire E. N. J., Menge D. N. L., Barron A. R., The nitrogen paradox in tropical forest ecosystems. Annu. Rev. Ecol. Evol. Syst. 40, 613–635 (2009).
    1. Sprent J. I., Ardley J., James E. K., Biogeography of nodulated legumes and their nitrogen-fixing symbionts. New Phytol. 215, 40–56 (2017). - PubMed
    1. Batterman S. A., et al. ., Key role of symbiotic dinitrogen fixation in tropical forest secondary succession. Nature 502, 224–227 (2013). - PubMed
    1. Epihov D. Z., et al. ., N2-fixing tropical legume evolution: A contributor to enhanced weathering through the Cenozoic? Proc. Biol. Sci. 284, 20170370 (2017). - PMC - PubMed

Publication types

MeSH terms