

Effects of weather-related social distancing on city-scale transmission of respiratory viruses: a retrospective cohort study
- PMID: 33836685
- PMCID: PMC8033554
- DOI: 10.1186/s12879-021-06028-4
Effects of weather-related social distancing on city-scale transmission of respiratory viruses: a retrospective cohort study
Abstract
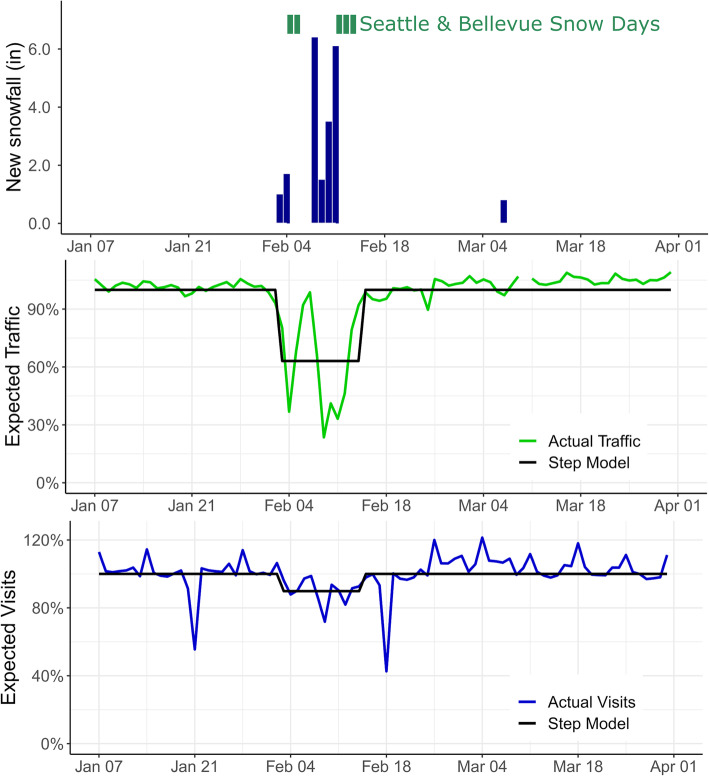
Background: Unusually high snowfall in western Washington State in February 2019 led to widespread school and workplace closures. We assessed the impact of social distancing caused by this extreme weather event on the transmission of respiratory viruses.
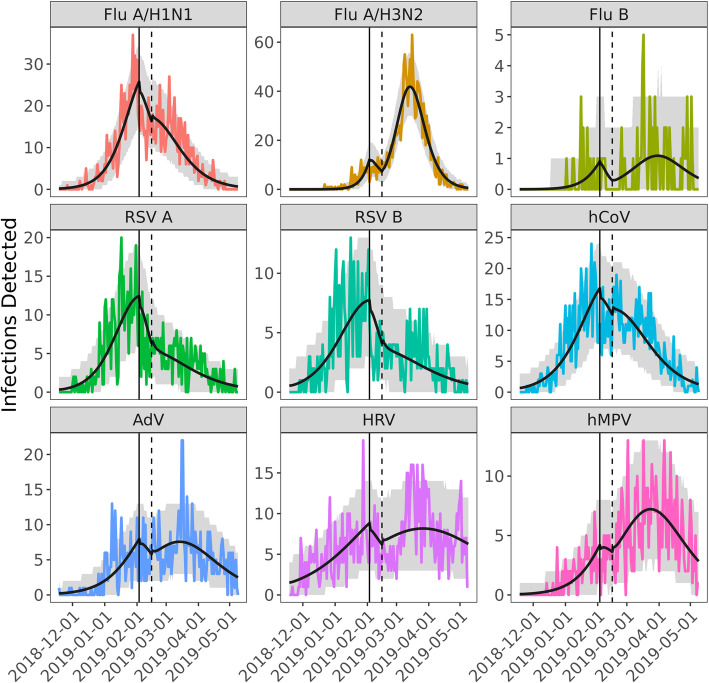
Methods: Residual specimens from patients evaluated for acute respiratory illness at hospitals in the Seattle metropolitan area were screened for a panel of respiratory viruses. Transmission models were fit to each virus to estimate the magnitude reduction in transmission due to weather-related disruptions. Changes in contact rates and care-seeking were informed by data on local traffic volumes and hospital visits.
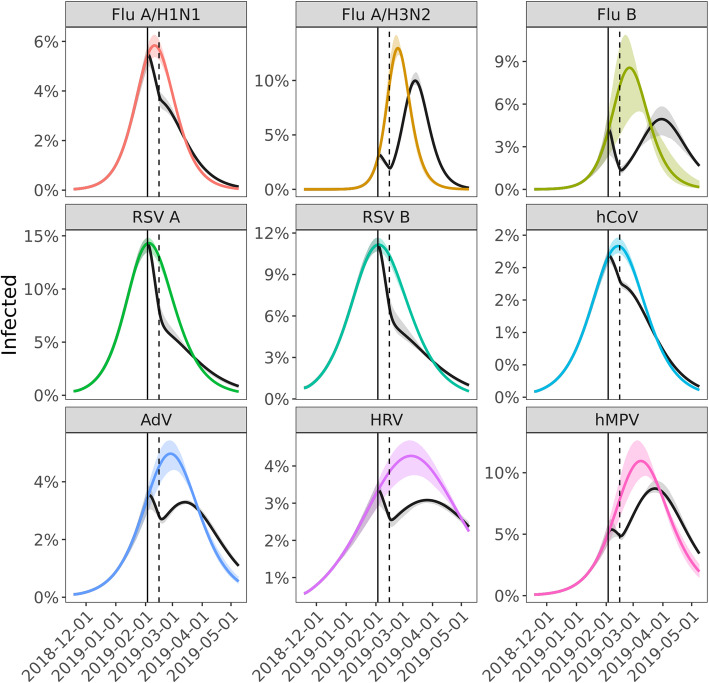
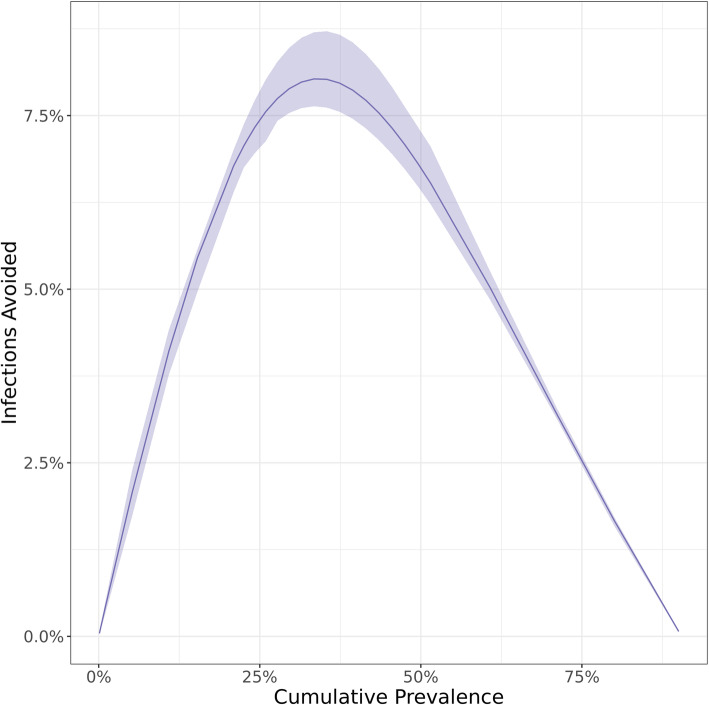
Results: Disruption in contact patterns reduced effective contact rates during the intervention period by 16 to 95%, and cumulative disease incidence through the remainder of the season by 3 to 9%. Incidence reductions were greatest for viruses that were peaking when the disruption occurred and least for viruses in an early epidemic phase.
Conclusion: High-intensity, short-duration social distancing measures may substantially reduce total incidence in a respiratory virus epidemic if implemented near the epidemic peak. For SARS-CoV-2, this suggests that, even when SARS-CoV-2 spread is out of control, implementing short-term disruptions can prevent COVID-19 deaths.
Keywords: Epidemiology; Influenza, human; Non-Pharmaceutical Interventions; Respiratory syncytial virus, human.
Conflict of interest statement
Michael L. Jackson has received grant funding from Sanofi Pasteur, unrelated to the present work. Janet A. Englund is a consultant for Sanofi Pasteur and Meissa Vaccines, Inc., and receives research support from GlaxoSmithKline, AstraZeneca, and Novavax. Helen Chu is a consultant for Merck and GlaxoSmithKline. Gregory R. Hart, Denise J. McCulloch, Amanda Adler, Elisabeth Brandstetter, Kairsten Fay, Peter Han, Kirsten Lacombe, Jover Lee, Thomas R. Sibley, Deborah A. Nickerson, Mark J. Rieder, Lea M. Starita, Amanda Adler, Trevor Bedford, and Michael Famulare declare no competing interests.
Figures
Similar articles
-
Chopping the tail: How preventing superspreading can help to maintain COVID-19 control.Epidemics. 2021 Mar;34:100430. doi: 10.1016/j.epidem.2020.100430. Epub 2020 Dec 21. Epidemics. 2021. PMID: 33360871 Free PMC article.
-
Early trends for SARS-CoV-2 infection in central and north Texas and impact on other circulating respiratory viruses.J Med Virol. 2020 Oct;92(10):2130-2138. doi: 10.1002/jmv.26010. Epub 2020 Jun 2. J Med Virol. 2020. PMID: 32410236 Free PMC article.
-
Dynamic Panel Data Modeling and Surveillance of COVID-19 in Metropolitan Areas in the United States: Longitudinal Trend Analysis.J Med Internet Res. 2021 Feb 9;23(2):e26081. doi: 10.2196/26081. J Med Internet Res. 2021. PMID: 33481757 Free PMC article.
-
Community interventions in Low-And Middle-Income Countries to inform COVID-19 control implementation decisions in Kenya: A rapid systematic review.PLoS One. 2020 Dec 8;15(12):e0242403. doi: 10.1371/journal.pone.0242403. eCollection 2020. PLoS One. 2020. PMID: 33290402 Free PMC article.
-
[What is the effect of social distancing on the course of COVID-19 epidemic?].Pol Merkur Lekarski. 2021 Feb 24;49(289):71-79. Pol Merkur Lekarski. 2021. PMID: 33713099 Review. Polish.
Cited by
-
The Impact of COVID-19 on Outpatient Antibiotic Prescriptions in Ontario, Canada; An Interrupted Time Series Analysis.Open Forum Infect Dis. 2021 Oct 30;8(11):ofab533. doi: 10.1093/ofid/ofab533. eCollection 2021 Nov. Open Forum Infect Dis. 2021. PMID: 34805442 Free PMC article.
-
Capturing Household Structure and Mobility within and between Remote Aboriginal Communities in Northern Australia Using Longitudinal Data: A Pilot Study.Int J Environ Res Public Health. 2022 Sep 22;19(19):12002. doi: 10.3390/ijerph191912002. Int J Environ Res Public Health. 2022. PMID: 36231301 Free PMC article.
-
The cost-effectiveness of social distancing measures for mitigating the COVID-19 pandemic in a highly-populated country: A case study in Indonesia.Travel Med Infect Dis. 2022 Jan-Feb;45:102245. doi: 10.1016/j.tmaid.2021.102245. Epub 2021 Dec 23. Travel Med Infect Dis. 2022. PMID: 34954344 Free PMC article.
-
Environmental Factors Influencing COVID-19 Incidence and Severity.Annu Rev Public Health. 2022 Apr 5;43:271-291. doi: 10.1146/annurev-publhealth-052120-101420. Epub 2022 Jan 4. Annu Rev Public Health. 2022. PMID: 34982587 Free PMC article. Review.
-
Does behavior mediate the effect of weather on SARS-CoV-2 transmission? evidence from cell-phone data.PLoS One. 2024 Jun 21;19(6):e0305323. doi: 10.1371/journal.pone.0305323. eCollection 2024. PLoS One. 2024. PMID: 38905199 Free PMC article.
References
-
- Kang M, Wu J, Ma W, He J, Lu J, Liu T, et al. Evidence and characteristics of human-to-human transmission of SARS-CoV-2. MedRxiv. 2020. 10.1101/2020.02.03.20019141.
-
- Perez-Padilla R, de la Rosa-Zamboni D, Ponce de Leon S, Hernandez M, Quinones-Falconi F, Bautista E, Ramirez-Venegas A, Rojas-Serrano J, Ormsby CE, Corrales A, et al. Pneumonia and respiratory failure from swine-origin influenza A (H1N1) in Mexico. N Engl J Med. 2009;361(7):680–689. doi: 10.1056/NEJMoa0904252. - DOI - PubMed
MeSH terms
Grants and funding
LinkOut - more resources
Full Text Sources
Other Literature Sources
Miscellaneous
