

Unsupervised phenotyping of sepsis using nonnegative matrix factorization of temporal trends from a multivariate panel of physiological measurements
- PMID: 33836745
- PMCID: PMC8033653
- DOI: 10.1186/s12911-021-01460-7
Unsupervised phenotyping of sepsis using nonnegative matrix factorization of temporal trends from a multivariate panel of physiological measurements
Abstract
Background: Sepsis is a highly lethal and heterogeneous disease. Utilization of an unsupervised method may identify novel clinical phenotypes that lead to targeted therapies and improved care.
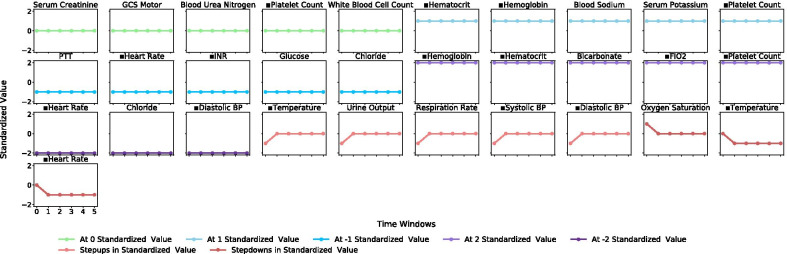
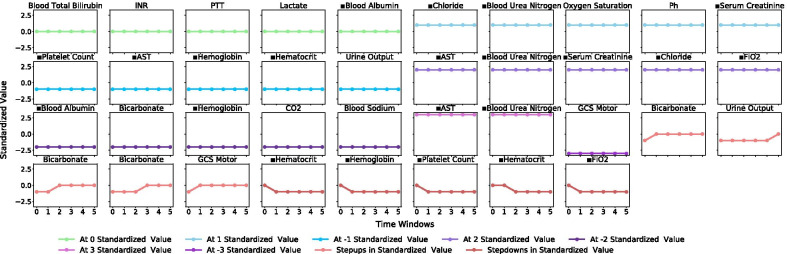
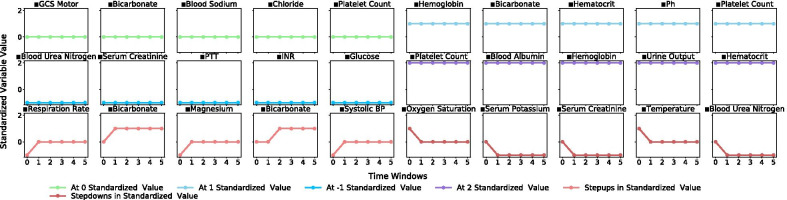
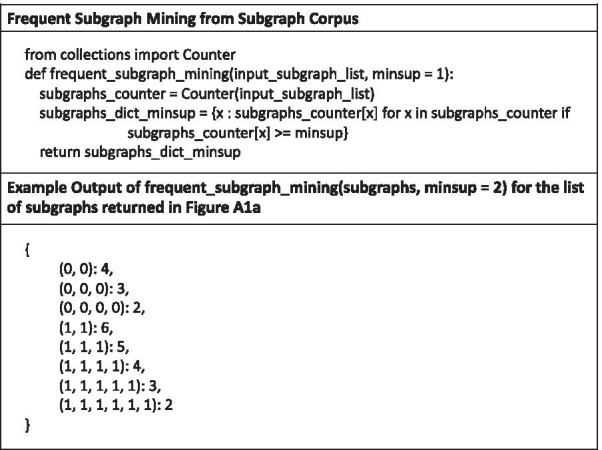
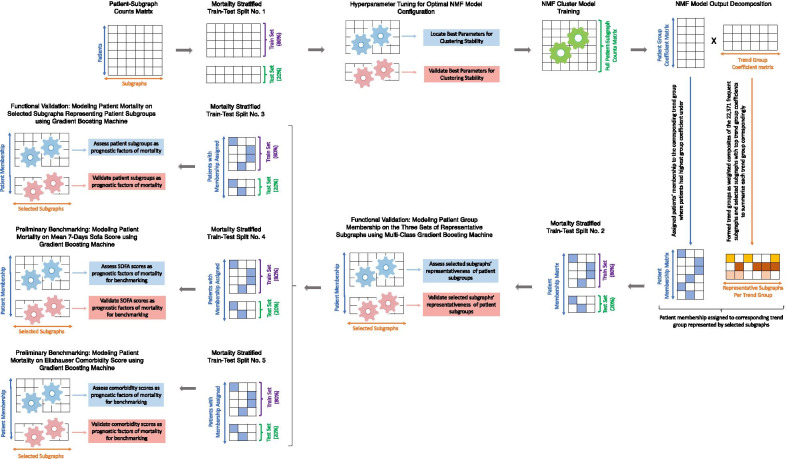
Methods: Our objective was to derive clinically relevant sepsis phenotypes from a multivariate panel of physiological data using subgraph-augmented nonnegative matrix factorization. We utilized data from the Medical Information Mart for Intensive Care III database of patients who were admitted to the intensive care unit with sepsis. The extracted data contained patient demographics, physiological records, sequential organ failure assessment scores, and comorbidities. We applied frequent subgraph mining to extract subgraphs from physiological time series and performed nonnegative matrix factorization over the subgraphs to derive patient clusters as phenotypes. Finally, we profiled these phenotypes based on demographics, physiological patterns, disease trajectories, comorbidities and outcomes, and performed functional validation of their clinical implications.
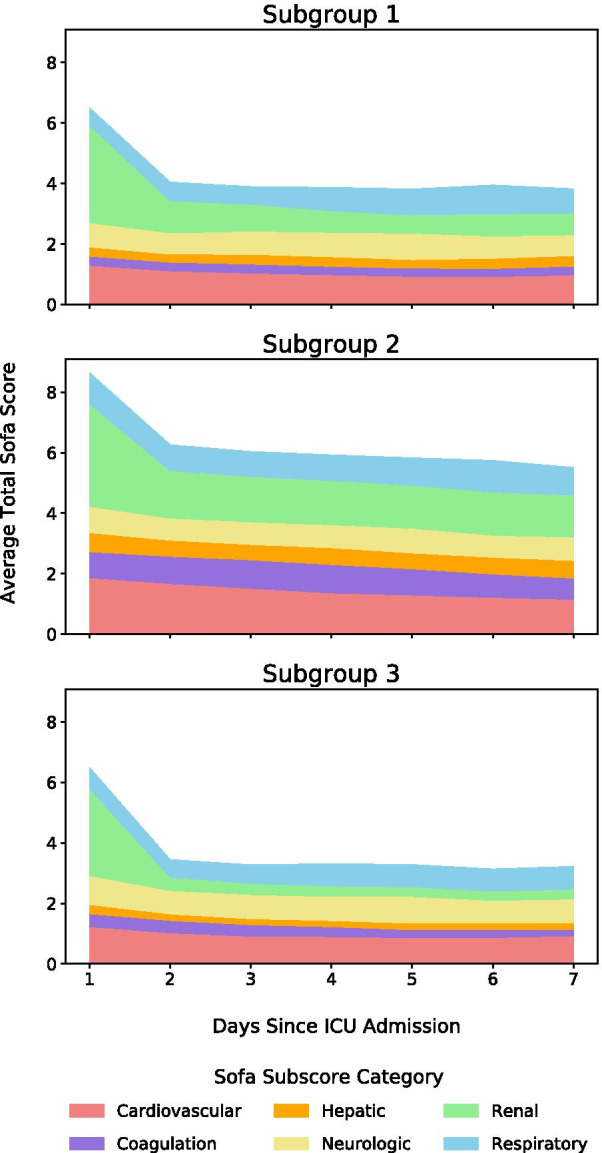
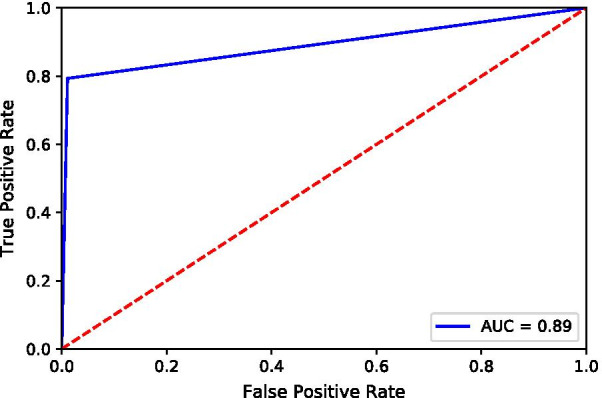
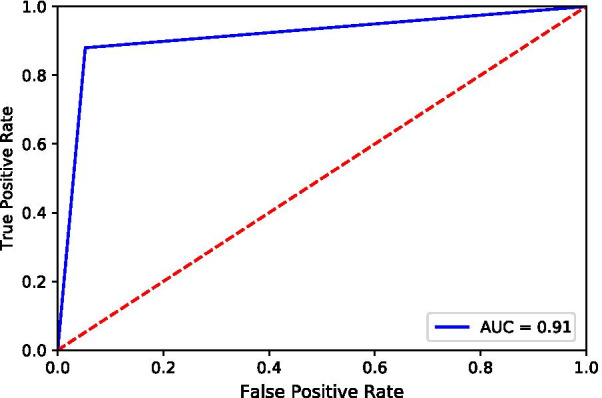
Results: We analyzed a cohort of 5782 patients, derived three novel phenotypes of distinct clinical characteristics and demonstrated their prognostic implications on patient outcome. Subgroup 1 included relatively less severe/deadly patients (30-day mortality, 17%) and was the smallest-in-size group (n = 1218, 21%). It was characterized by old age (mean age, 73 years), a male majority (male-to-female ratio, 59-to-41), and complex chronic conditions. Subgroup 2 included the most severe/deadliest patients (30-day mortality, 28%) and was the second-in-size group (n = 2036, 35%). It was characterized by a male majority (male-to-female ratio, 60-to-40), severe organ dysfunction or failure compounded by a wide range of comorbidities, and uniquely high incidences of coagulopathy and liver disease. Subgroup 3 included the least severe/deadly patients (30-day mortality, 10%) and was the largest group (n = 2528, 44%). It was characterized by low age (mean age, 60 years), a balanced gender ratio (male-to-female ratio, 50-to-50), the least complicated conditions, and a uniquely high incidence of neurologic disease. These phenotypes were validated to be prognostic factors of mortality for sepsis patients.
Conclusions: Our results suggest that these phenotypes can be used to develop targeted therapies based on phenotypic heterogeneity and algorithms designed for monitoring, validating and intervening clinical decisions for sepsis patients.
Keywords: Clustering; Frequent subgraph mining; Gradient boosting machine; Intensive care unit; Nonnegative matrix factorization; Phenotyping; Physiological measurements; Sepsis; Unsupervised learning.
Conflict of interest statement
The authors declare that they have no competing interests.
Figures

Similar articles
-
Methods for Phenotyping Adult Patients in Sepsis and Septic Shock: A Scoping Review.Crit Care Explor. 2022 Mar 30;4(4):e0672. doi: 10.1097/CCE.0000000000000672. eCollection 2022 Apr. Crit Care Explor. 2022. PMID: 35372844 Free PMC article.
-
Derivation and Validation of Novel Phenotypes of Multiple Organ Dysfunction Syndrome in Critically Ill Children.JAMA Netw Open. 2020 Aug 3;3(8):e209271. doi: 10.1001/jamanetworkopen.2020.9271. JAMA Netw Open. 2020. PMID: 32780121 Free PMC article.
-
Derivation, Validation, and Potential Treatment Implications of Novel Clinical Phenotypes for Sepsis.JAMA. 2019 May 28;321(20):2003-2017. doi: 10.1001/jama.2019.5791. JAMA. 2019. PMID: 31104070 Free PMC article.
-
Derivation and validation of generalized sepsis-induced acute respiratory failure phenotypes among critically ill patients: a retrospective study.Crit Care. 2024 Oct 1;28(1):321. doi: 10.1186/s13054-024-05061-4. Crit Care. 2024. PMID: 39354616 Free PMC article.
-
Definition and Epidemiology of Sepsis.Semin Respir Crit Care Med. 2024 Aug;45(4):461-468. doi: 10.1055/s-0044-1787990. Epub 2024 Jul 5. Semin Respir Crit Care Med. 2024. PMID: 38968960 Review.
Cited by
-
Northwestern University resource and education development initiatives to advance collaborative artificial intelligence across the learning health system.Learn Health Syst. 2024 Apr 15;8(3):e10417. doi: 10.1002/lrh2.10417. eCollection 2024 Jul. Learn Health Syst. 2024. PMID: 39036530 Free PMC article.
-
Informatics and machine learning methods for health applications.BMC Med Inform Decis Mak. 2020 Dec 30;20(Suppl 11):342. doi: 10.1186/s12911-020-01344-2. BMC Med Inform Decis Mak. 2020. PMID: 33380332 Free PMC article.
-
Comparison between machine learning methods for mortality prediction for sepsis patients with different social determinants.BMC Med Inform Decis Mak. 2022 Jun 16;22(Suppl 2):156. doi: 10.1186/s12911-022-01871-0. BMC Med Inform Decis Mak. 2022. PMID: 35710407 Free PMC article.
-
Methods for Phenotyping Adult Patients in Sepsis and Septic Shock: A Scoping Review.Crit Care Explor. 2022 Mar 30;4(4):e0672. doi: 10.1097/CCE.0000000000000672. eCollection 2022 Apr. Crit Care Explor. 2022. PMID: 35372844 Free PMC article.
-
Longitudinal dynamic clinical phenotypes of in-hospital COVID-19 patients across three dominant virus variants in New York.Int J Med Inform. 2024 Jan;181:105286. doi: 10.1016/j.ijmedinf.2023.105286. Epub 2023 Nov 8. Int J Med Inform. 2024. PMID: 37956643 Free PMC article.
References
Publication types
MeSH terms
Grants and funding
LinkOut - more resources
Full Text Sources
Other Literature Sources
Medical
