. 2021 Aug 1;27(15):4287-4300.
doi: 10.1158/1078-0432.CCR-20-4574. Epub 2021 Apr 9.

Myeloid Cell-associated Resistance to PD-1/PD-L1 Blockade in Urothelial Cancer Revealed Through Bulk and Single-cell RNA Sequencing

Affiliations

Myeloid Cell-associated Resistance to PD-1/PD-L1 Blockade in Urothelial Cancer Revealed Through Bulk and Single-cell RNA Sequencing

Li Wang et al. Clin Cancer Res. .

Abstract

Purpose: To define dominant molecular and cellular features associated with PD-1/PD-L1 blockade resistance in metastatic urothelial cancer.

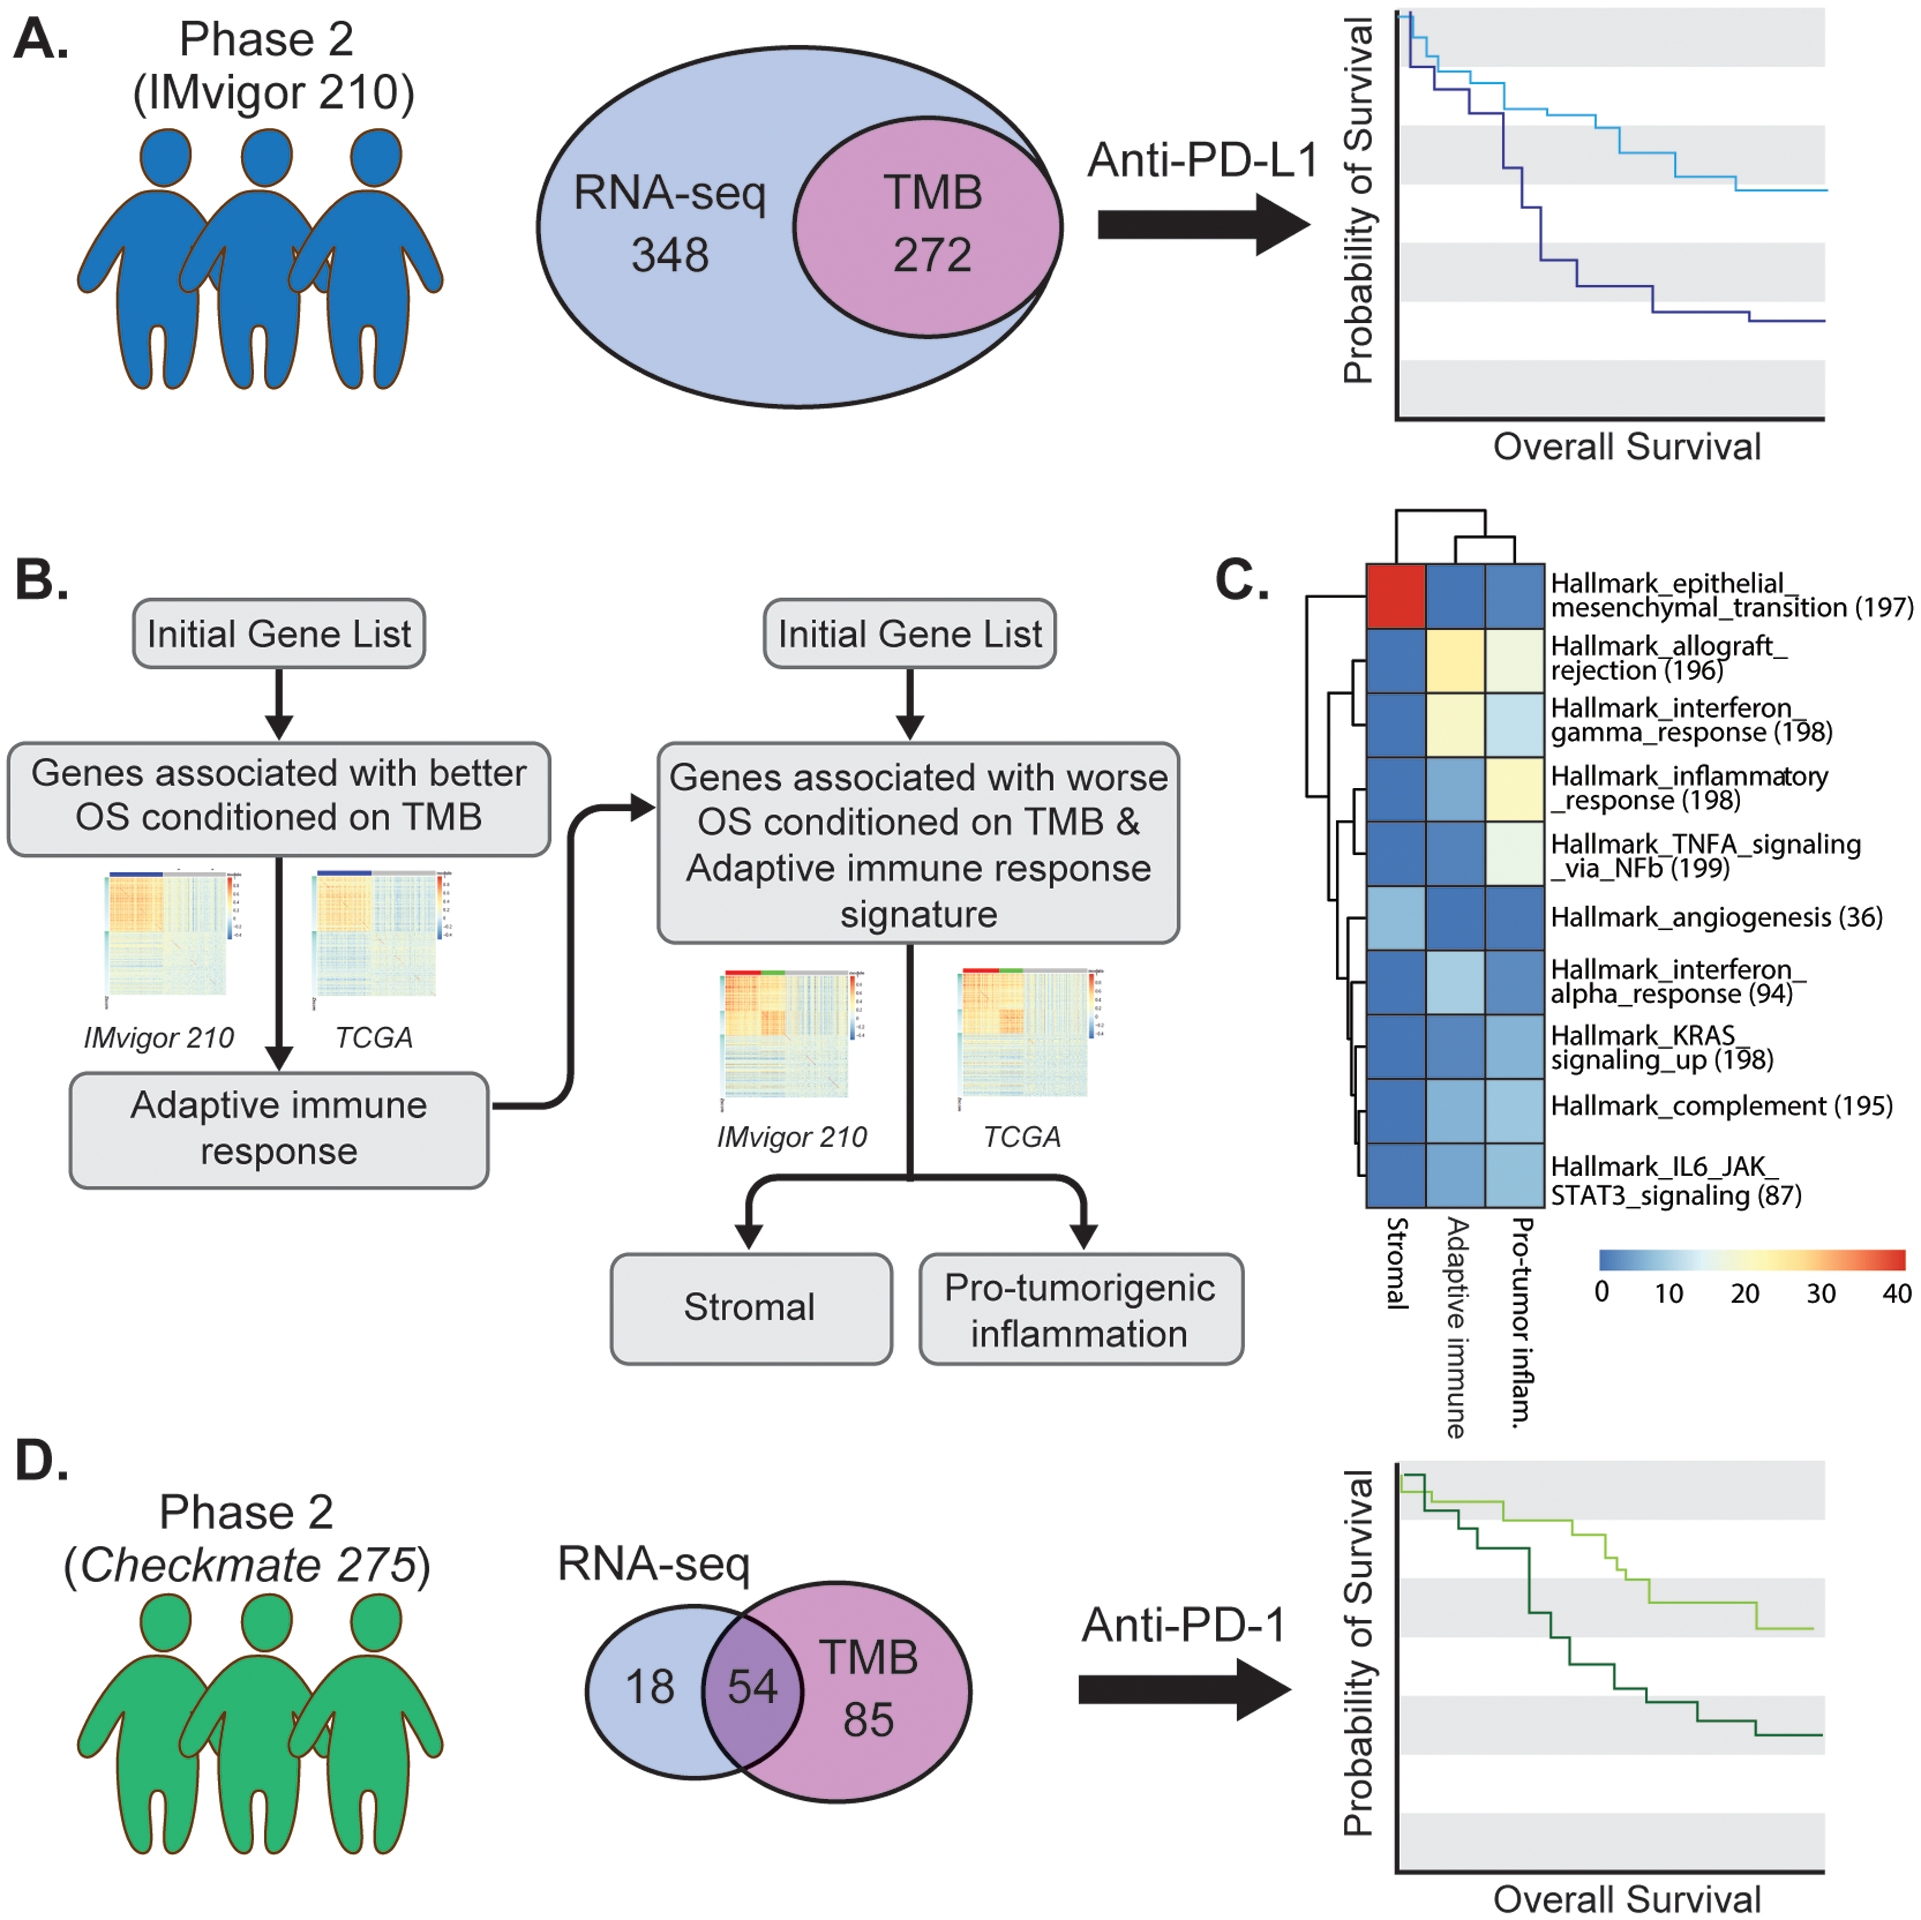
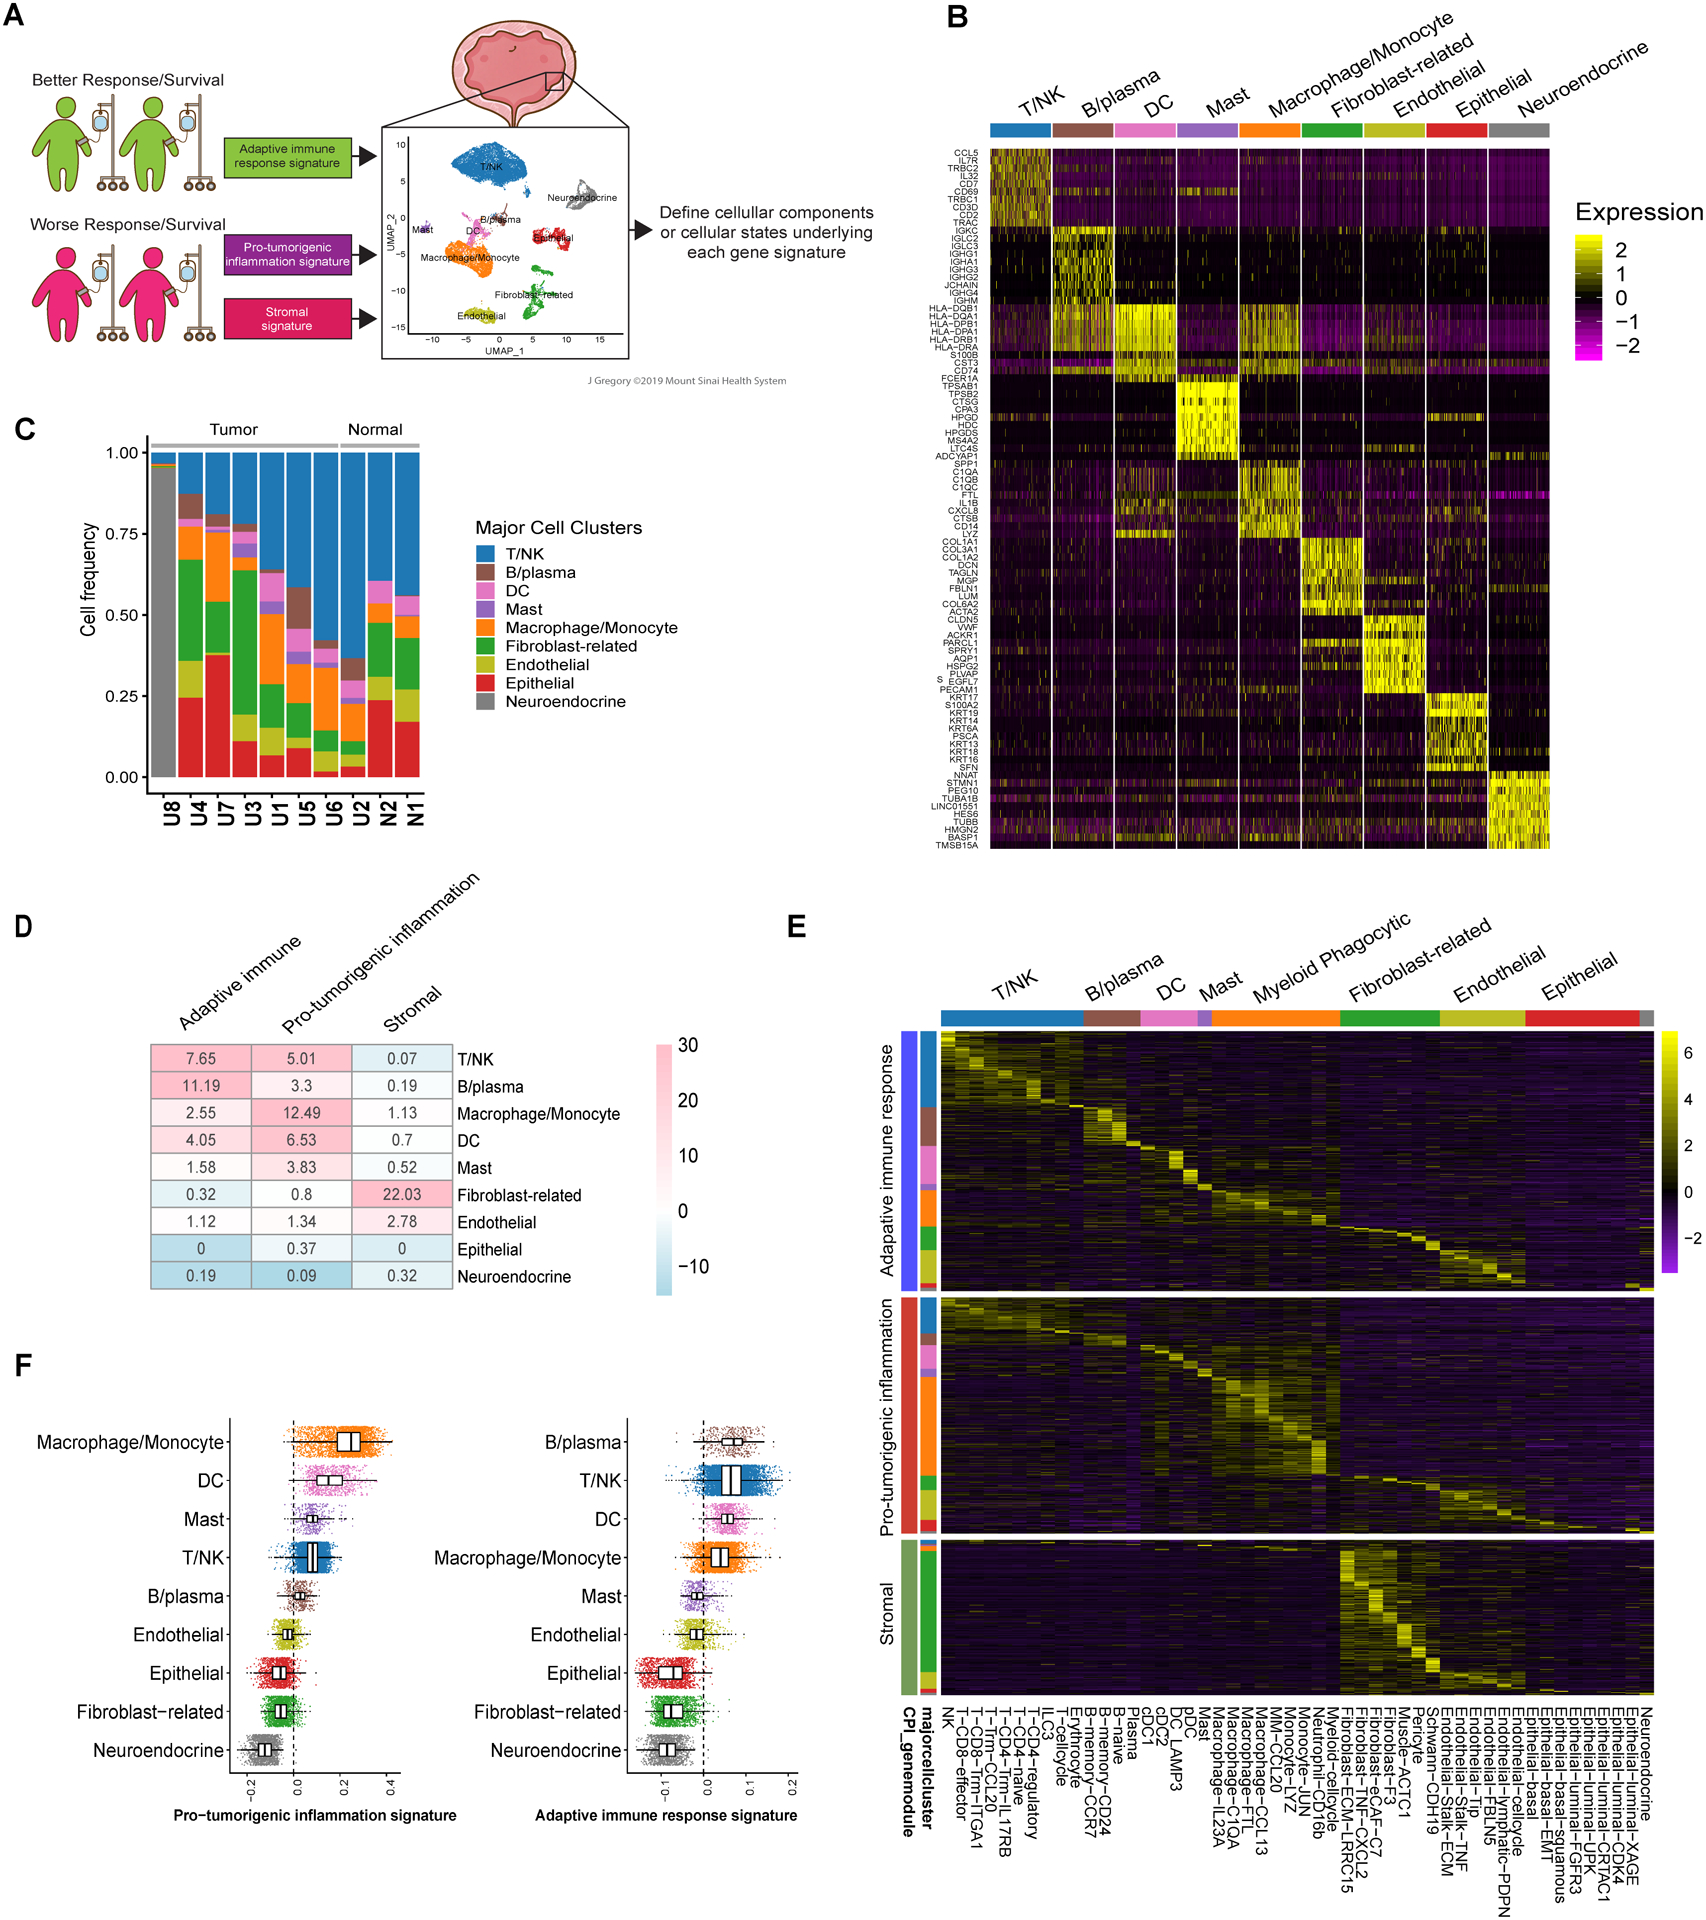
Experimental design: We pursued an unbiased approach using bulk RNA sequencing data from two clinical trials to discover (IMvigor 210) and validate (CheckMate 275) pretreatment molecular features associated with resistance to PD-1/PD-L1 blockade in metastatic urothelial cancer. We then generated single-cell RNA sequencing (scRNA-seq) data from muscle-invasive bladder cancer specimens to dissect the cellular composition underlying the identified gene signatures.

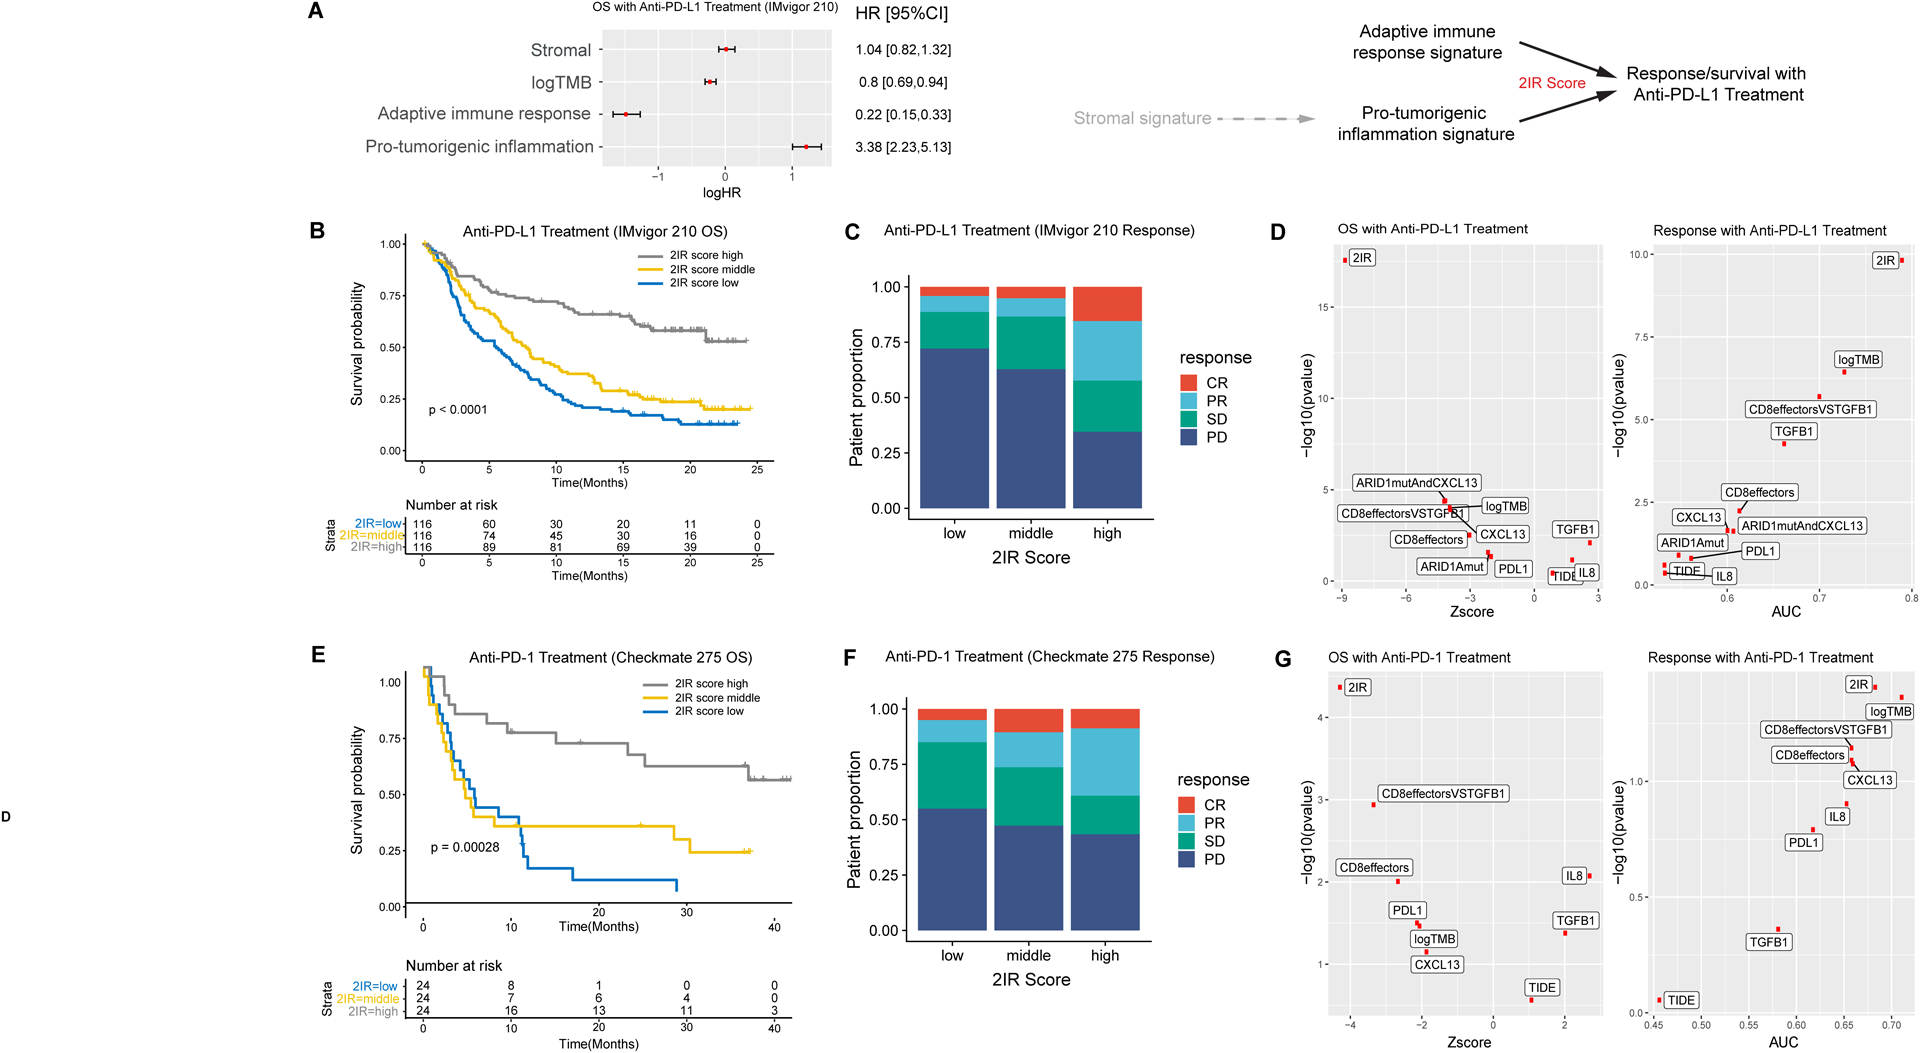
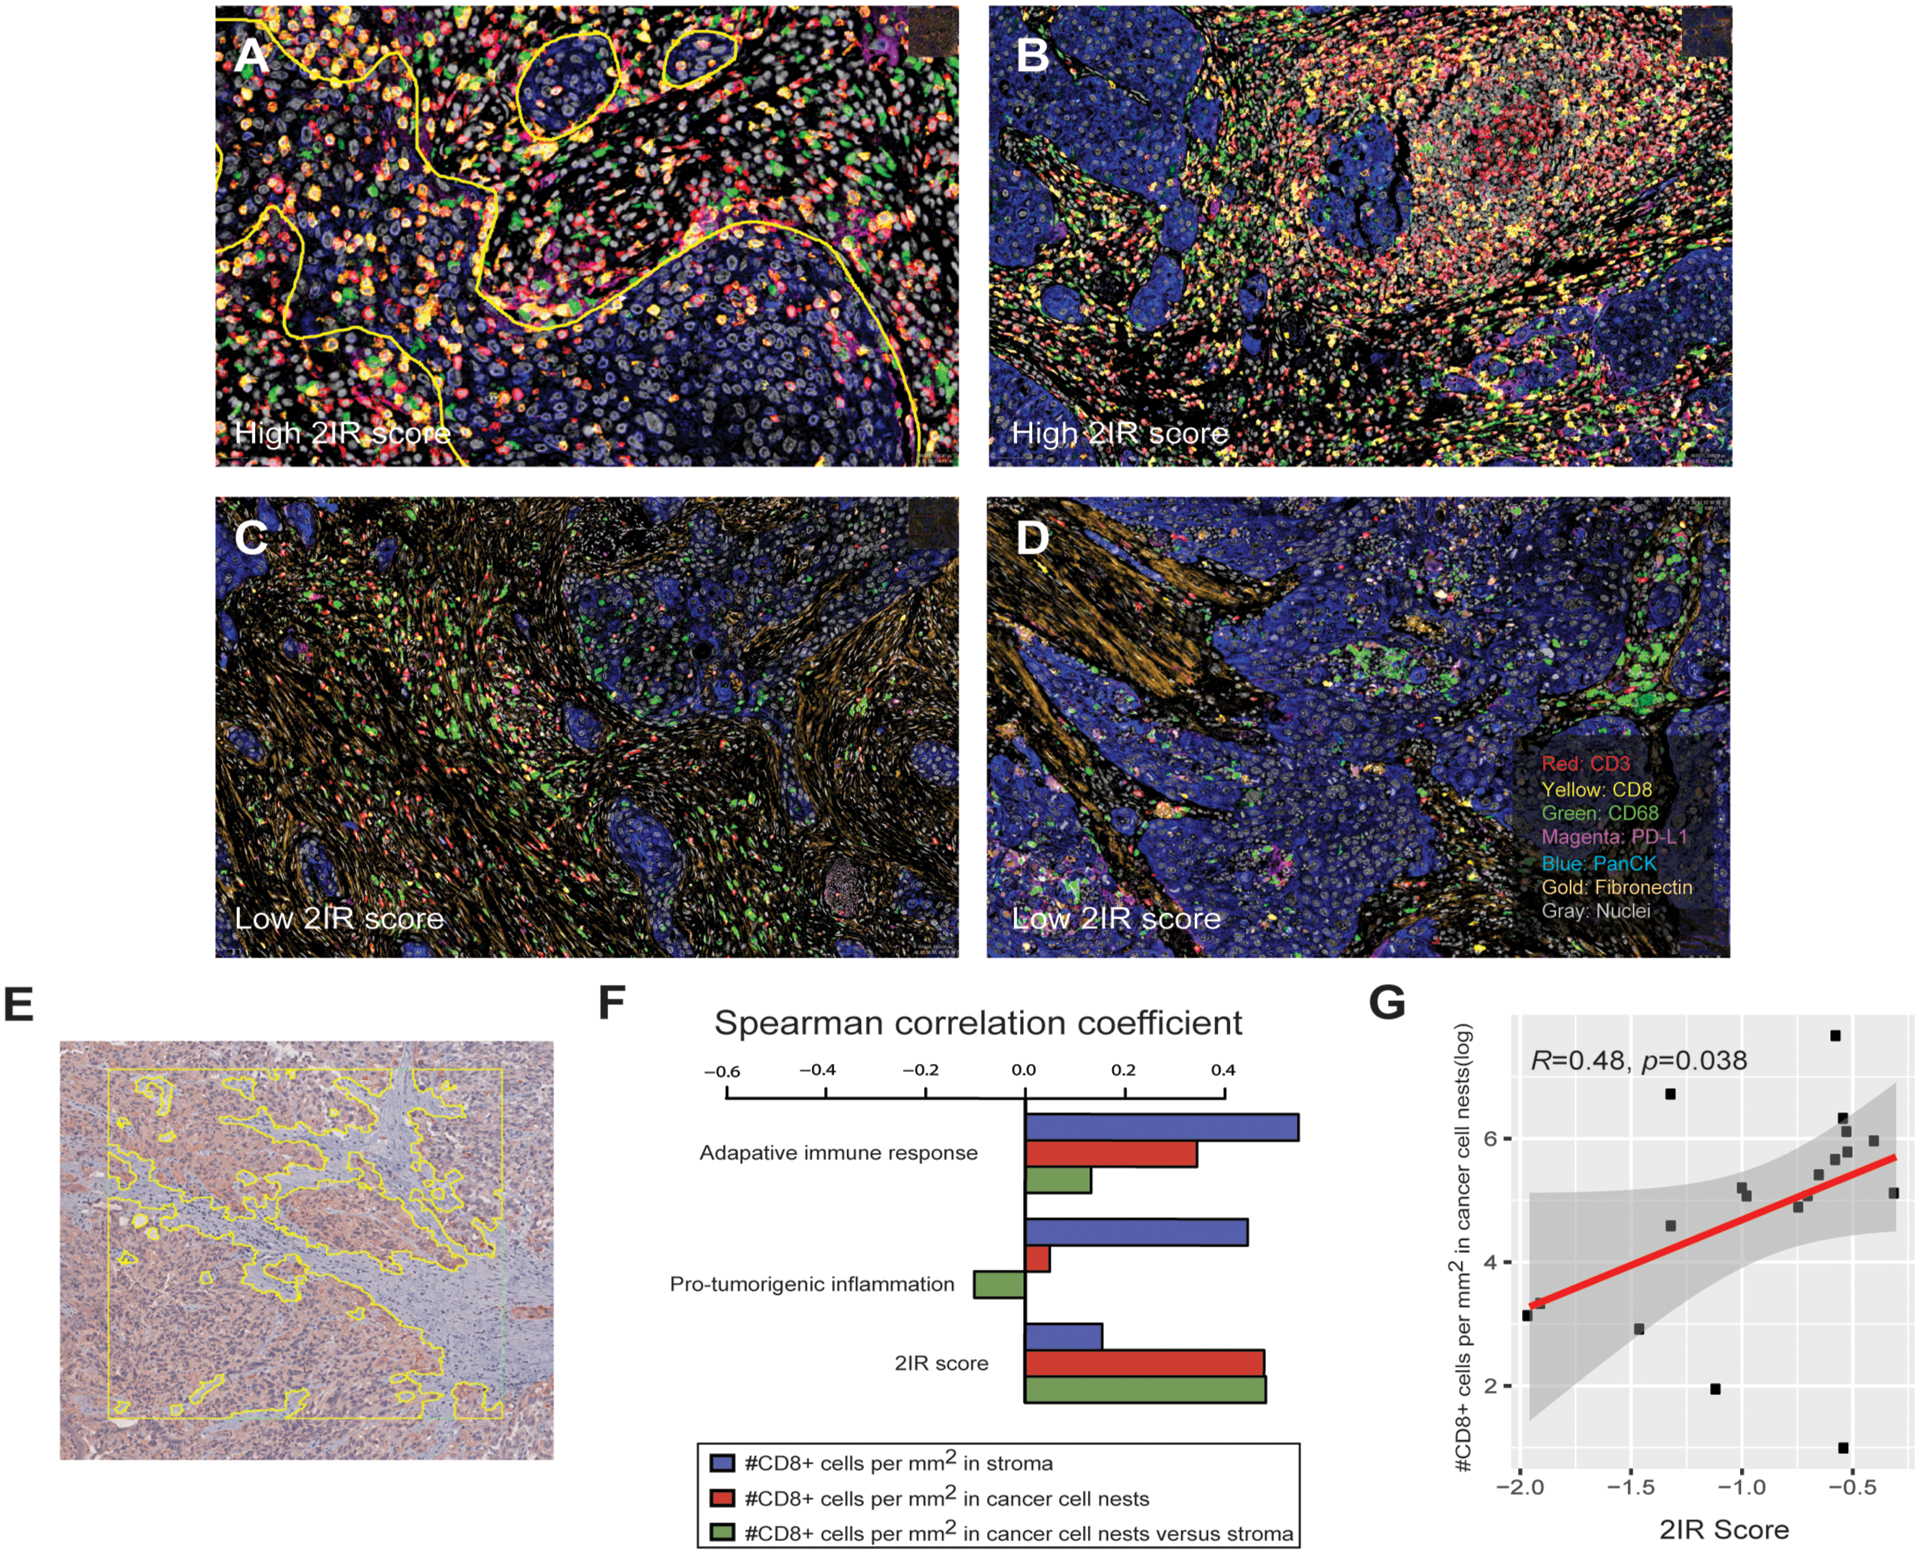
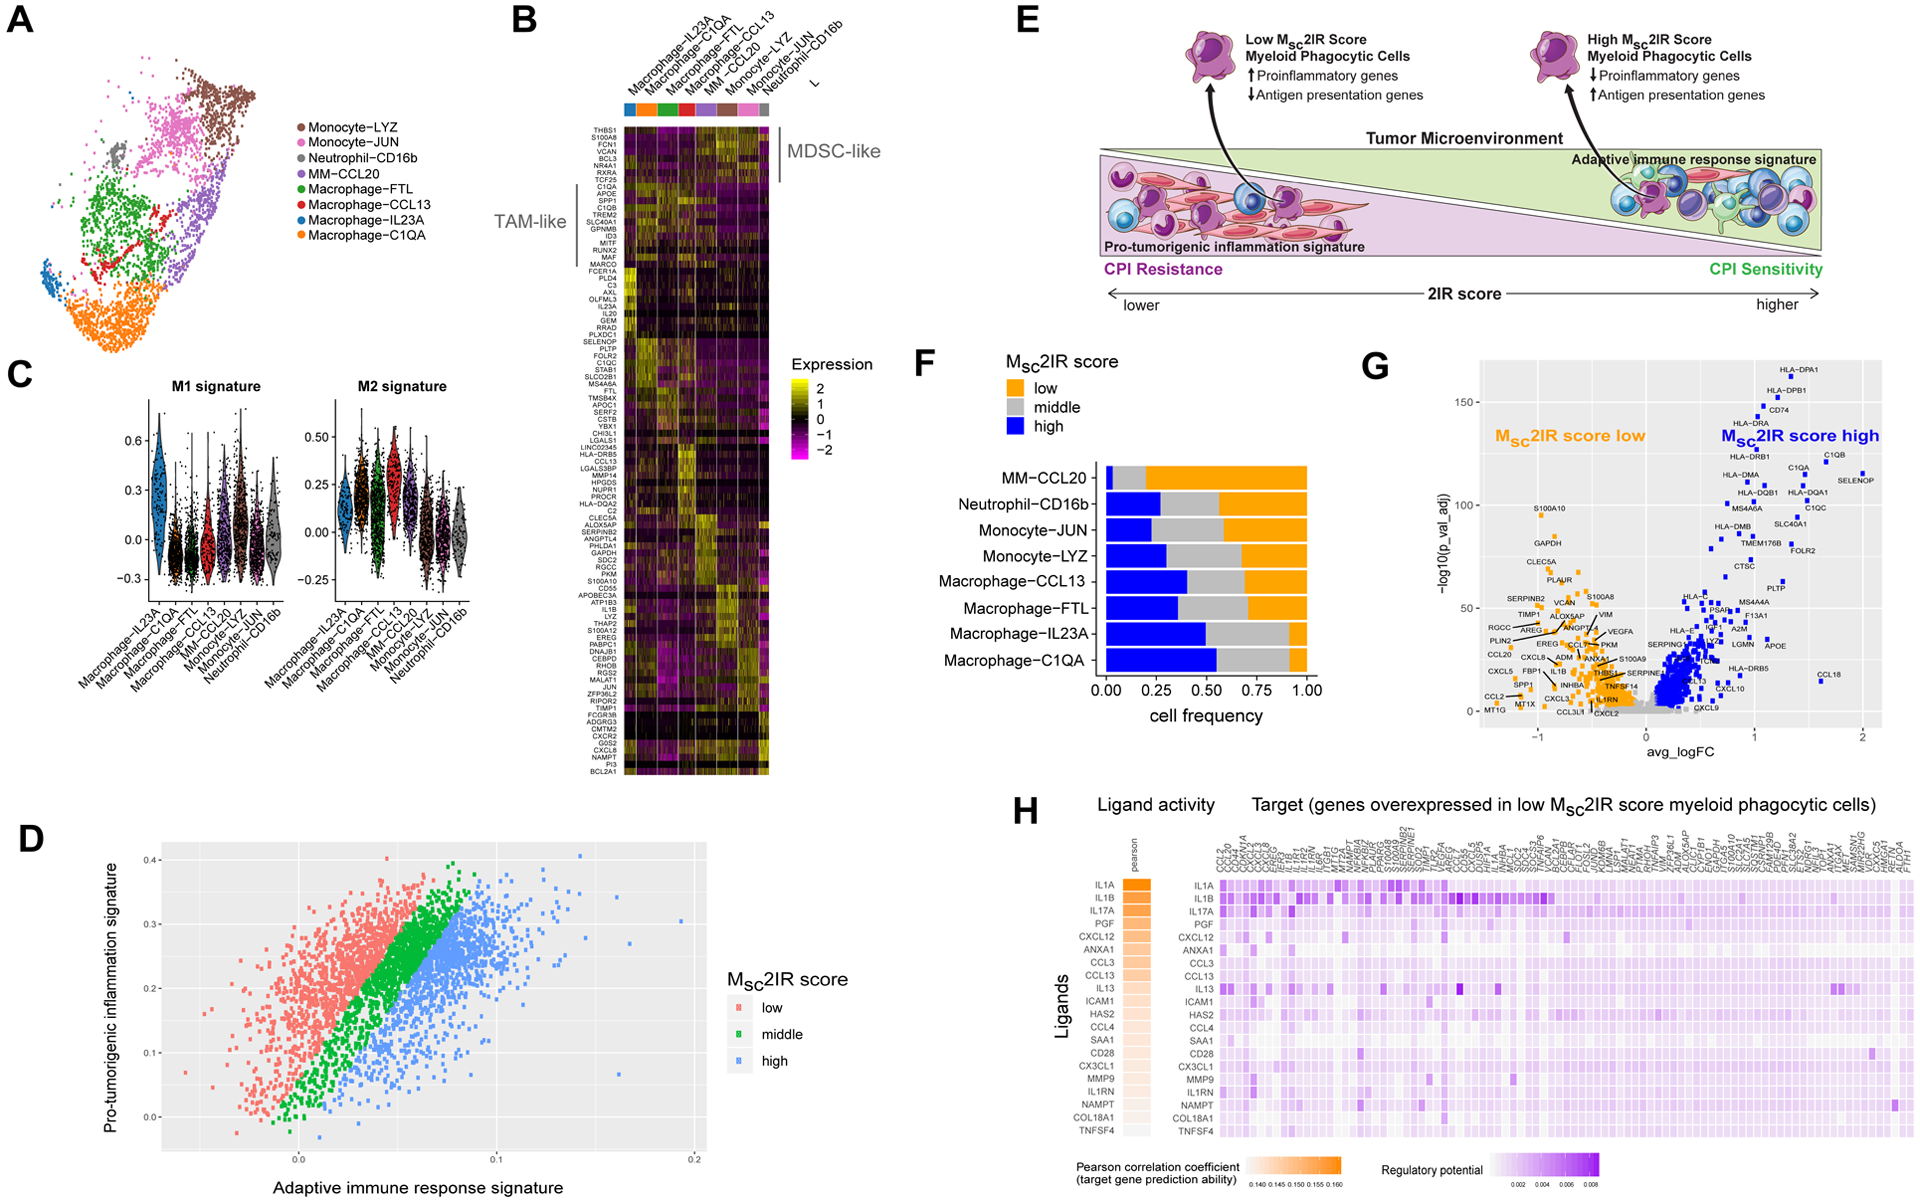
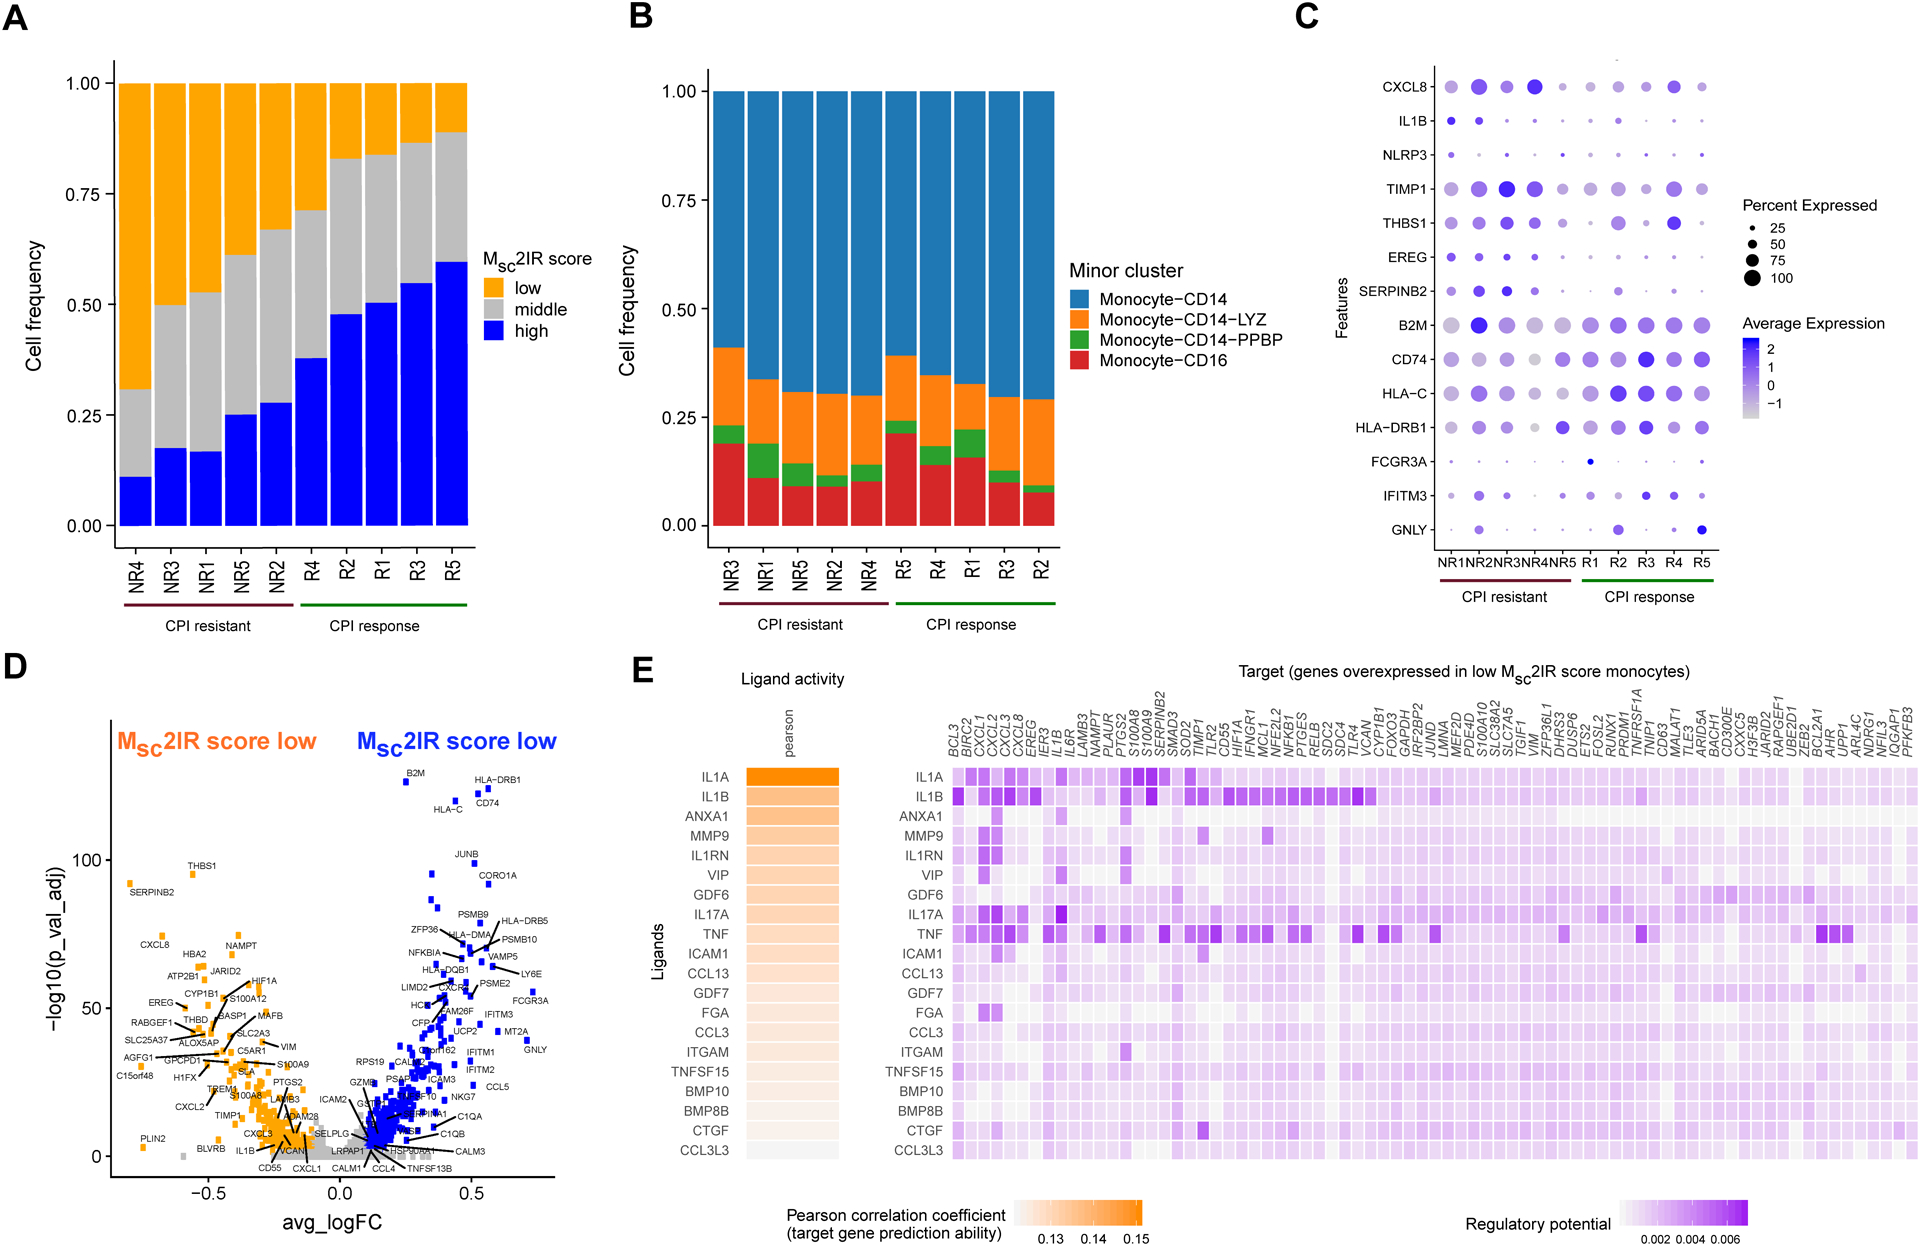
Results: We identified an adaptive immune response gene signature associated with response and a protumorigenic inflammation gene signature associated with resistance to PD-1/PD-L1 blockade. The adaptive immune response:protumorigenic inflammation signature expression ratio, coined the 2IR score, best correlated with clinical outcomes, and was externally validated. Mapping these bulk gene signatures onto scRNA-seq data uncovered their underlying cellular diversity, with prominent expression of the protumorigenic inflammation signature by myeloid phagocytic cells. However, heterogeneity in expression of adaptive immune and protumorigenic inflammation genes was observed among single myeloid phagocytic cells, quantified as the myeloid single cell immune:protumorigenic inflammation ratio (Msc2IR) score. Single myeloid phagocytic cells with low Msc2IR scores demonstrated upregulation of proinflammatory cytokines/chemokines and downregulation of antigen presentation genes, were unrelated to M1 versus M2 polarization, and were enriched in pretreatment blood samples from patients with PD-L1 blockade-resistant metastatic urothelial cancer.

Conclusions: The balance of adaptive immunity and protumorigenic inflammation in individual tumor microenvironments is associated with PD-1/PD-L1 resistance in urothelial cancer with the latter linked to a proinflammatory cellular state of myeloid phagocytic cells detectable in tumor and blood.See related commentary by Drake, p. 4139.


Figures

Figure 1.
Figure 1.. Cohorts and workflow for discovery of gene signatures associated with sensitivity and resistance to anti-PD-1/PD-L1 treatment in metastatic urothelial cancer.
A. IMvigor 210 was a single-arm phase 2 study investigating PD-L1 inhibition with atezolizumab in patients with metastatic urothelial cancer. The illustration depicts the numbers of patients with available pre-PD-L1 inhibition RNA-sequencing (RNA-seq) data, tumor mutational burden (TMB) data, or both, derived from archival tumor specimens available for the current analysis. B. Step-wise approach to the identification of consistently co-expressed gene modules, conditioned on TMB, associated with better overall survival or worse overall survival with PD-L1 blockade treatment in patients with metastatic urothelial cancer. Data from The Cancer Genome Atlas (TCGA) urothelial bladder cancer dataset was used to identify consistently co-expressed gene modules (see Methods). C. Hallmark pathways enriched in the adaptive immune response, pro-tumorigenic inflammation, and stromal gene signatures using Fisher’s exact test (nominal two-sided p-value <1e-5). Color corresponds to the −log10 of the p-value. D. Checkmate 275 was a single-arm phase 2 study investigating PD-1 inhibition with nivolumab in patients with metastatic urothelial cancer. The illustration depicts the number of patients with available pre-PD-1 inhibition RNA-sequencing data, TMB data, or both derived from archival tumor specimens used for validation of the association between the adaptive immune response, pro-tumorigenic inflammation, and stromal gene signatures and outcomes with PD-1/PD-L1 blockade in metastatic urothelial cancer.
Figure 2.
Figure 2.. The adaptive immune response and pro-tumorigenic inflammation gene signatures, and the ratio of signature expression termed the 2IR score, are associated with clinical outcomes with PD-1/PD-L1 blockade in patients with metastatic urothelial cancer.
A. Multivariable Cox regression model for overall survival (OS; n=272 patients with RNA sequencing and tumor mutational burden (TMB) data) including adaptive immune response, pro-tumorigenic inflammation, and stromal gene signature expression, as well as TMB from the IMvigor 210 cohort (HR, hazard ratio; 95% CI, 95% confidence interval; error bars represent 95% CI of the HRs). Gene signature expression and TMB were standardized before entering the Cox regression model. The plot indicates log HRs while annotation provides HRs. Schematic representation of the relationship of the adaptive immune response, pro-tumorigenic inflammation, and stromal gene signatures and outcomes with atezolizumab indicating potential indirect role of the stromal signature on resistance mediated more directly through the pro-tumorigenic inflammation signature and the 2IR score representing the adaptive Immune response:pro-tumorigenic Inflammation gene signature expression Ratio. B. Kaplan-Meier curve for overall survival (OS) stratified by the 2IR score cut at tertiles in the IMvigor 210 cohort (n=348 patients with RNA sequencing data; log-rank p value shown). C. Objective response rate with PD-L1 blockade in the IMvigor 210 cohort according to the 2IR score (cut at tertiles). For each 2IR score tertile, bar graphs depict the percentage of patients achieving a complete response (CR), partial response (PR), stable disease (SD), or progressive disease (PD) as the best objective response with PD-L1 blockade. D. The association between each biomarker (or biomarker combination) and overall survival (OS) in the IMvigor 210 cohort was evaluated using the Z-score by univariate Cox regression analysis and the p-value by log likelihood ratio test (left). The association between each biomarker and response to PD-L1 blockade (CR/PR versus SD/PD) was evaluated using the area under curve (AUC) score and the p-value by the Wald’s test in univariate logistic regression (right). E. Kaplan-Meier curves for overall survival (OS) stratified by the 2IR score (cut at tertiles) in the Checkmate 275 cohort (n=72 patients with RNA sequencing data; log rank p value shown). F. Objective response rate with PD-1 blockade in the Checkmate 275 cohort according to the 2IR score (cut at tertiles). For each 2IR score tertile, bar graphs depict the percentage of patients achieving a complete response (CR), partial response (PR), stable disease (SD), or progressive disease (PD) as the best objective response with PD-1 blockade. G. The association between each biomarker (or biomarker combination) and overall survival (OS) in the Checkmate 275 cohort was evaluated using the Z-score by univariate Cox regression analysis and the p-value by log likelihood ratio test (left). The association between each biomarker and response to PD-1 blockade (CR/PR versus SD/PD) was evaluated using the area under curve (AUC) score and the p-value by the Wald’s test in univariate logistic regression (right).
Figure 3.
Figure 3.. The adaptive immune response and pro-tumorigenic inflammation gene signatures are associated with spatial organization of immune cells in the tumor microenvironment.
A-D. Representative images of multiplexed immunohistochemical consecutive staining on a single slide (MICSSS) demonstrating abundance of CD8+ T cells (A, B) and tertiary lymphoid-like structures (B) in specimens with high 2IR scores and a paucity of CD8+ T cells and prominent macrophages and stroma (C, D) in specimens with a low 2IR scores. Yellow outline in panel A represents demarcation of cancer cell nests. All slides were initially scanned at 20x magnification. E. Representative image of urothelial cancer specimen demonstrating region of interest (ROI), designated by the square, and machine learning-based segmentation of cancer cell nest and stromal zones to define T cell localization in the tumor microenvironment using pancytokeratin immunohistochemical staining, designated by the yellow outline bordering cytokeratin-expressing cells. F. Spearman’s correlation between enumeration of CD8+ T cells localized to cancer cell nests or stromal zones and adaptive immune response gene signature, pro-tumorigenic inflammation gene signature, or 2IR score. The results are based on analysis of 76 ROIs across 19 specimens with both immunohistochemistry and RNA sequencing data from the Checkmate 275 cohort. G. Correlation between enumeration of CD8+ T cells localized to cancer cell nests and the 2IR score. The results are based on analysis of 76 ROIs across 19 specimens with both immunohistochemistry and RNA sequencing data from the Checkmate 275 cohort. Spearman’s correlation was used to determine the correlation coefficient R and p value.
Figure 4.
Figure 4.. Defining the cellular origins of adaptive immune response, pro-tumorigenic inflammation, and stromal gene signature expression using single-cell RNA sequencing.
A. Schematic representation of projection of gene signatures identified using bulk RNA sequencing data linked to outcomes with anti-PD-1/PD-L1 treatment onto single-cell RNA sequencing data generated from a separate cohort of invasive urothelial bladder cancer specimens. The illustration depicts nine major cell clusters visualized using Uniform Manifold Approximation and Projection (UMAP) across eight urothelial cancer specimens and two adjacent normal urothelial cancer specimens profiled using droplet-based encapsulation single-cell RNA sequencing. The adaptive immune response, pro-tumorigenic inflammation, and stromal gene signatures identified using bulk RNA sequencing data from clinical trial cohorts were projected onto the single-cell RNA sequencing data to define the predominant cellular sources of the respective signature gene expression. B. Single-cell expression of top 10 overexpressed genes in each major cell cluster. Heatmap visualization color-coding the scaled gene expression level for selected marker genes (rows). Visualized are 500 randomly selected cells per cluster. C. Frequency of cell populations in individual samples included in the single-cell RNA sequencing cohort. For each sample, bar graphs depict the percentage of cells in clusters associated with each population. Samples were ranked according to T/NK cell frequency. Normal indicates samples obtained for urothelial tissue that was considered grossly normal by visual inspection adjacent to site of harvested tumor tissue. D. Heatmap of overlap between genes comprising the adaptive immune response, pro-tumorigenic inflammation, and stromal gene signatures and genes overexpressed in each of the major cell clusters in the single-cell RNA sequencing cohort. The number in each cell corresponds to the odds ratio for the corresponding overlap between genes, the color corresponds to the −log10 p-value (for enrichment) or log10 p value (for depletion) by two-sided Fisher’s exact test. E. Heatmap visualizing the expression of adaptive immune response, pro-tumorigenic, and stromal signature genes across each of the major and minor cell clusters in the single-cell RNA sequencing cohort. F. Expression level of pro-tumorigenic inflammation signature genes per cell (left) and adaptive immune response signature genes per cell (right) as assessed by the AddModuleScore() function in the Seurat package across major cell populations.
Figure 5.
Figure 5.. The pro-tumorigenic inflammation gene signature is expressed prominently by myeloid phagocytic cells and low Msc2IR score myeloid phagocytic cells are characterized by increased expression of proinflammatory genes and decreased expression of antigen presentation genes.
A. Eight minor myeloid phagocytic cell clusters visualized using Uniform Manifold Approximation and Projection (UMAP) across eight urothelial cancer specimens and two adjacent normal urothelial cancer specimens profiled using droplet-based encapsulation single-cell RNA sequencing. B. Myeloid phagocytic cell populations in the single-cell RNA sequencing cohort. Heatmap visualization color-coding the scaled gene expression level for selected marker genes (rows). Visualized are 200 randomly selected cells per cluster or all cells when the cell cluster contained <200 cells. C. Expression level of M1 and M2 macrophage polarization signature genes in the myeloid phagocytic cell populations as assessed by the AddModuleScore() function in the Seurat package. D. Expression of pro-tumorigenic inflammation signature genes versus adaptive immune response genes in single myeloid phagocytic cells in the urothelial cancer tumor microenvironment and classification of single myeloid phagocytic cells by myeloid single cell 2IR (Msc2IR) score. E. Schematic representation of the relationship between the 2IR score in the urothelial cancer tumor microenvironment based on bulk RNA sequencing and the Msc2IR score in individual myeloid phagocytic cells based on single cell RNA sequencing. F. The frequency of cells with low, intermediate and high Msc2IR score within each myeloid phagocytic cell minor population. G. Volcano plot of genes differentially expressed between myeloid phagocytic cells with high versus low Msc2IR scores. P-value was calculated by Wilcoxon rank-sum test and then adjusted by Bonferroni correction. Genes with log fold change (FC) >0.1 and adjusted p-value <0.05 were considered as significant. H. Top-ranking ligands inferred to regulate genes upregulated in low Msc2IR score myeloid phagocytic cells according to NicheNet. Heatmap visualization of ligand activity and downstream target genes inferred to be regulated by each respective ligand.
Figure 6.
Figure 6.. Low Msc2IR score monocytes are enriched in the pre-treatment peripheral blood of patients with metastatic urothelial cancer resistant to anti-PD-L1 treatment.
Single-cell RNA sequencing data from peripheral blood mononuclear cells collected prior to the initiation of treatment from five patients with metastatic urothelial cancer who achieved an objective response, and five patients with metastatic urothelial cancer who did not achieve an objective response, to anti-PD-L1 immune checkpoint inhibition (CPI). A. The frequency of monocytes with low, intermediate and high Msc2IR scores in the pre-treatment peripheral blood of patients (n=10 patients) resistant or sensitive to anti-PD-L1 CPI. B. The frequency of monocyte minor cell populations in the pre-treatment peripheral blood of patients (n=10 patients) resistant or sensitive to anti-PD-L1 CPI. C. Dot plot of expression of select genes in monocytes from pre-treatment peripheral blood of patients (n=10 patients) resistant or sensitive to anti-PD-L1 CPI. D. Volcano plot of genes differentially expressed between peripheral blood monocytes with high and low 2IR score. P-value was calculated by Wilcoxon rank-sum test and then adjusted by Bonferroni correction. Genes with log fold change (FC) >0.1 and adjusted p-value <0.05 were considered as significant. E. Top-ranking ligands inferred to regulate genes upregulated in low Msc2IR score peripheral blood monocytes according to NicheNet. Heatmap visualization of ligand activity and downstream target genes inferred to be regulated by each respective ligand.

Comment in

Similar articles

Cited by

References

    1. Rosenberg JE, Hoffman-Censits J, Powles T, et al. Atezolizumab in patients with locally advanced and metastatic urothelial carcinoma who have progressed following treatment with platinum-based chemotherapy: A single-arm, multicentre, phase 2 trial. Lancet 2016;387(10031). - PMC - PubMed
    1. Powles T, O’Donnell PH, Massard C, et al. Efficacy and Safety of Durvalumab in Locally Advanced or Metastatic Urothelial Carcinoma. JAMA Oncol 2017;45(2):e172411. - PMC - PubMed
    1. Sharma P, Retz M, Siefker-Radtke A, et al. Nivolumab in metastatic urothelial carcinoma after platinum therapy (CheckMate 275): a multicentre, single-arm, phase 2 trial. Lancet Oncol 2017;18(3). - PubMed
    1. Bellmunt J, de Wit R, Vaughn DJ, et al. Pembrolizumab as Second-Line Therapy for Advanced Urothelial Carcinoma. N Engl J Med 2017;NEJMoa1613683. - PMC - PubMed
    1. Patel MR, Ellerton J, Infante JR, et al. Avelumab in metastatic urothelial carcinoma after platinum failure (JAVELIN Solid Tumor): pooled results from two expansion cohorts of an open-label, phase 1 trial. Lancet Oncol 2018;19(1):51–64. - PMC - PubMed

Publication types

MeSH terms

Substances