

Global Diversity and Biogeography of the Zostera marina Mycobiome
- PMID: 33837008
- PMCID: PMC8174750
- DOI: 10.1128/AEM.02795-20
Global Diversity and Biogeography of the Zostera marina Mycobiome
Abstract
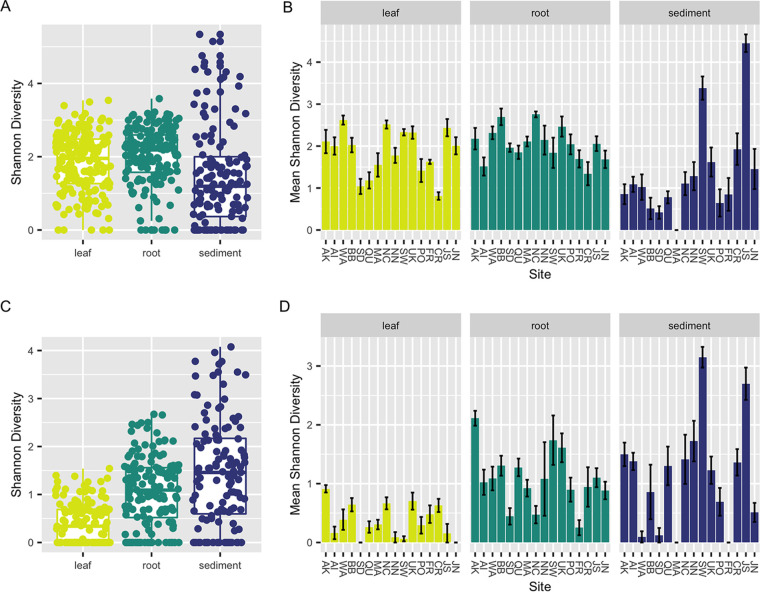
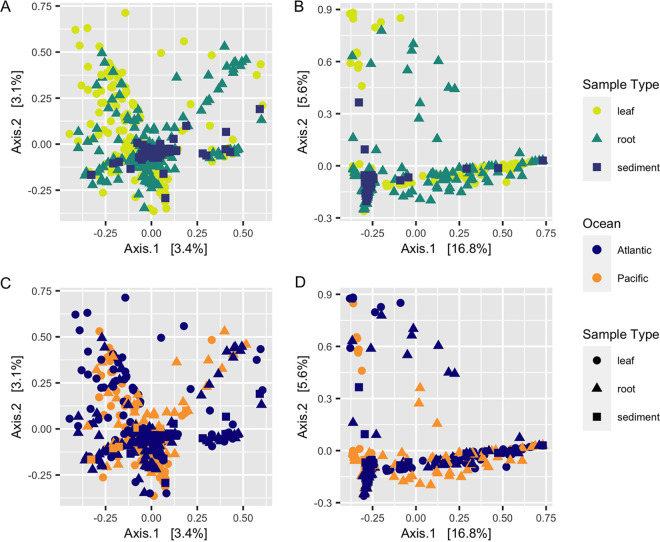
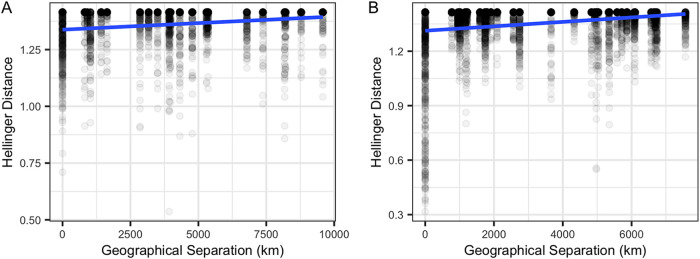
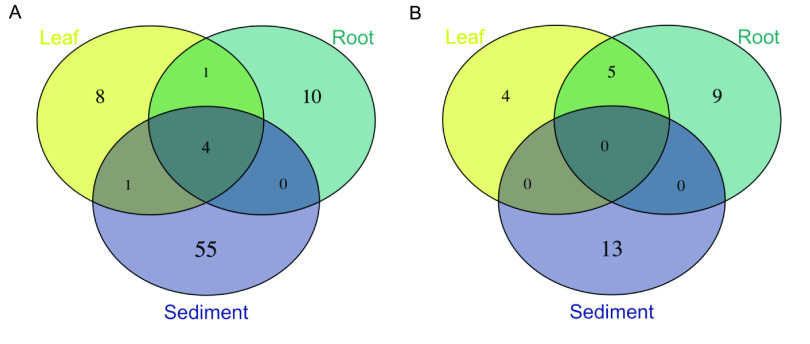
Seagrasses are marine flowering plants that provide critical ecosystem services in coastal environments worldwide. Marine fungi are often overlooked in microbiome and seagrass studies, despite terrestrial fungi having critical functional roles as decomposers, pathogens, or endophytes in global ecosystems. Here, we characterize the distribution of fungi associated with the seagrass Zostera marina, using leaves, roots, and rhizosphere sediment from 16 locations across its full biogeographic range. Using high-throughput sequencing of the ribosomal internal transcribed spacer (ITS) region and 18S rRNA gene, we first measured fungal community composition and diversity. We then tested hypotheses of neutral community assembly theory and the degree to which deviations suggested that amplicon sequence variants (ASVs) were plant selected or dispersal limited. Finally, we identified a core mycobiome and investigated the global distribution of differentially abundant ASVs. We found that the fungal community is significantly different between sites and that the leaf mycobiome follows a weak but significant pattern of distance decay in the Pacific Ocean. Generally, there was evidence for both deterministic and stochastic factors contributing to community assembly of the mycobiome, with most taxa assembling through stochastic processes. The Z. marina core leaf and root mycobiomes were dominated by unclassified Sordariomycetes spp., unclassified Chytridiomycota lineages (including Lobulomycetaceae spp.), unclassified Capnodiales spp., and Saccharomyces sp. It is clear from the many unclassified fungal ASVs and fungal functional guilds that knowledge of marine fungi is still rudimentary. Further studies characterizing seagrass-associated fungi are needed to understand the roles of these microorganisms generally and when associated with seagrasses. IMPORTANCE Fungi have important functional roles when associated with land plants, yet very little is known about the roles of fungi associated with marine plants, like seagrasses. In this study, we report the results of a global effort to characterize the fungi associated with the seagrass Zostera marina across its full biogeographic range. Although we defined a putative global core fungal community, it is apparent from the many fungal sequences and predicted functional guilds that had no matches to existing databases that general knowledge of seagrass-associated fungi and marine fungi is lacking. This work serves as an important foundational step toward future work investigating the functional ramifications of fungi in the marine ecosystem.
Keywords: 18S rRNA; ITS2; Zostera marina; abundance-occupancy; core; dispersal limited; eelgrass; global distribution; marine fungi; microbial eukaryotes; mycobiome; plant selected; seagrasses.
Figures
References
-
- Grossart H-P, Wurzbacher C, James TY, Kagami M. 2016. Discovery of dark matter fungi in aquatic ecosystems demands a reappraisal of the phylogeny and ecology of zoosporic fungi. Fungal Ecol 19:28–38. 10.1016/j.funeco.2015.06.004. - DOI
-
- Kagami M, de Bruin A, Ibelings BW, Van Donk E. 2007. Parasitic chytrids: their effects on phytoplankton communities and food-web dynamics. Hydrobiologia 578:113–129. 10.1007/s10750-006-0438-z. - DOI
-
- Gutiérrez MH, Pantoja S, Tejos E, Quiñones RA. 2011. The role of fungi in processing marine organic matter in the upwelling ecosystem off Chile. Mar Biol 158:205–219. 10.1007/s00227-010-1552-z. - DOI
Publication types
MeSH terms
LinkOut - more resources
Full Text Sources
Other Literature Sources
Miscellaneous
