. 2021 Sep;11(9):2248-2265.
doi: 10.1158/2159-8290.CD-20-1661. Epub 2021 Apr 9.

IFNγ Is Critical for CAR T Cell-Mediated Myeloid Activation and Induction of Endogenous Immunity

Affiliations

IFNγ Is Critical for CAR T Cell-Mediated Myeloid Activation and Induction of Endogenous Immunity

Darya Alizadeh et al. Cancer Discov. 2021 Sep.

Abstract

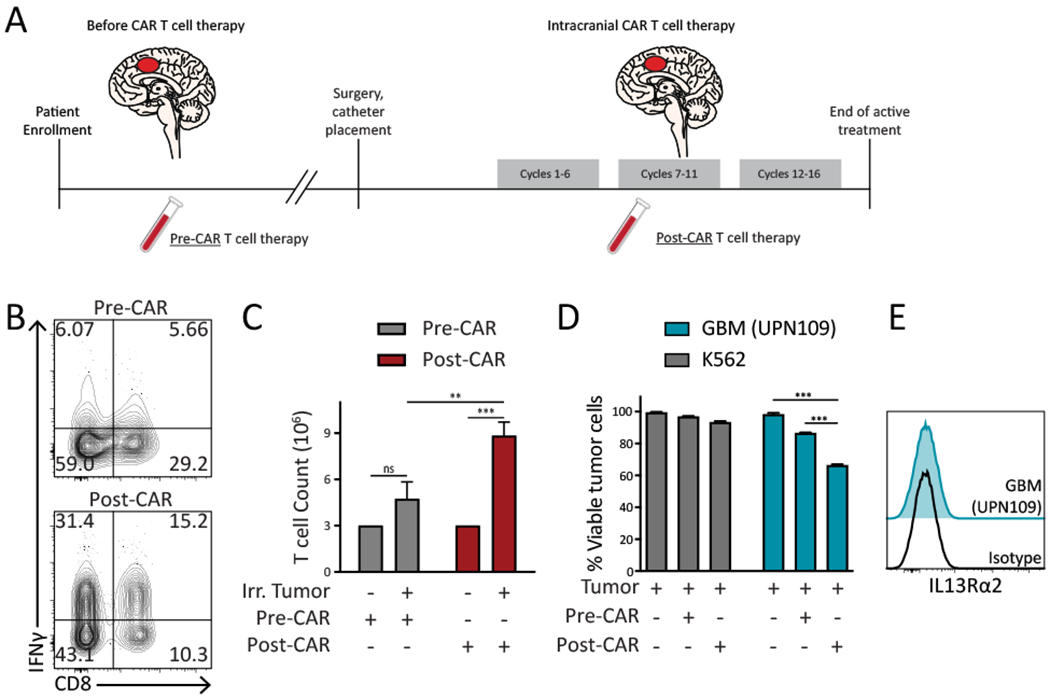
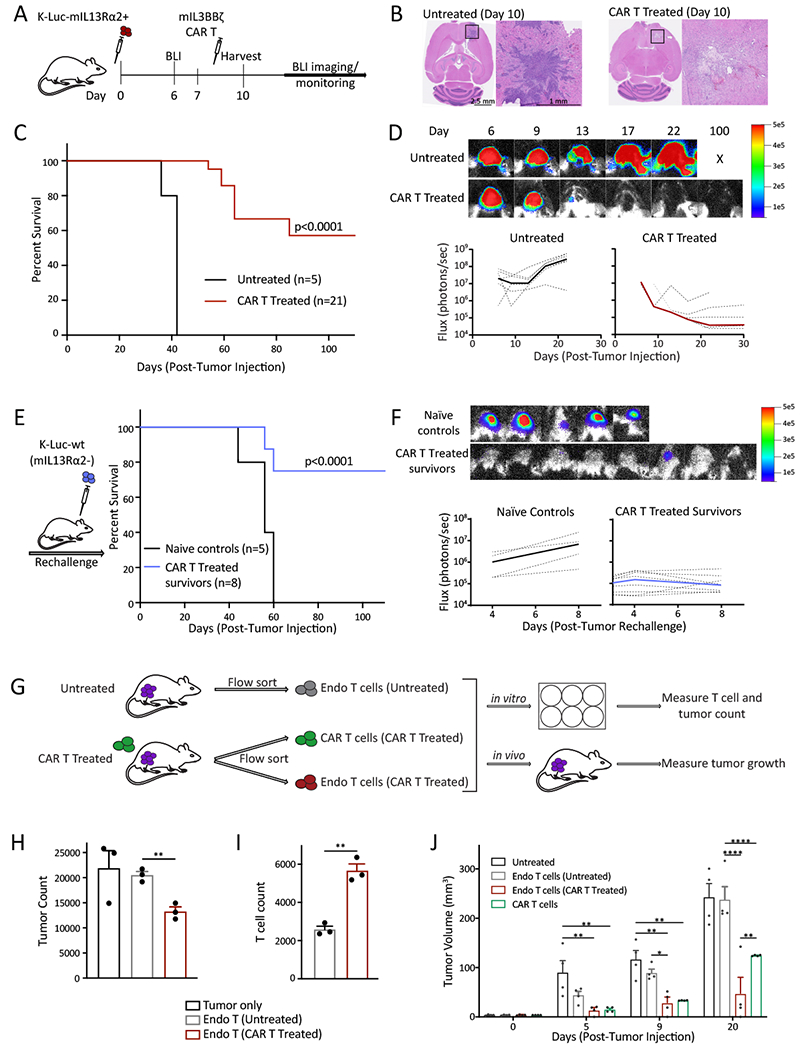
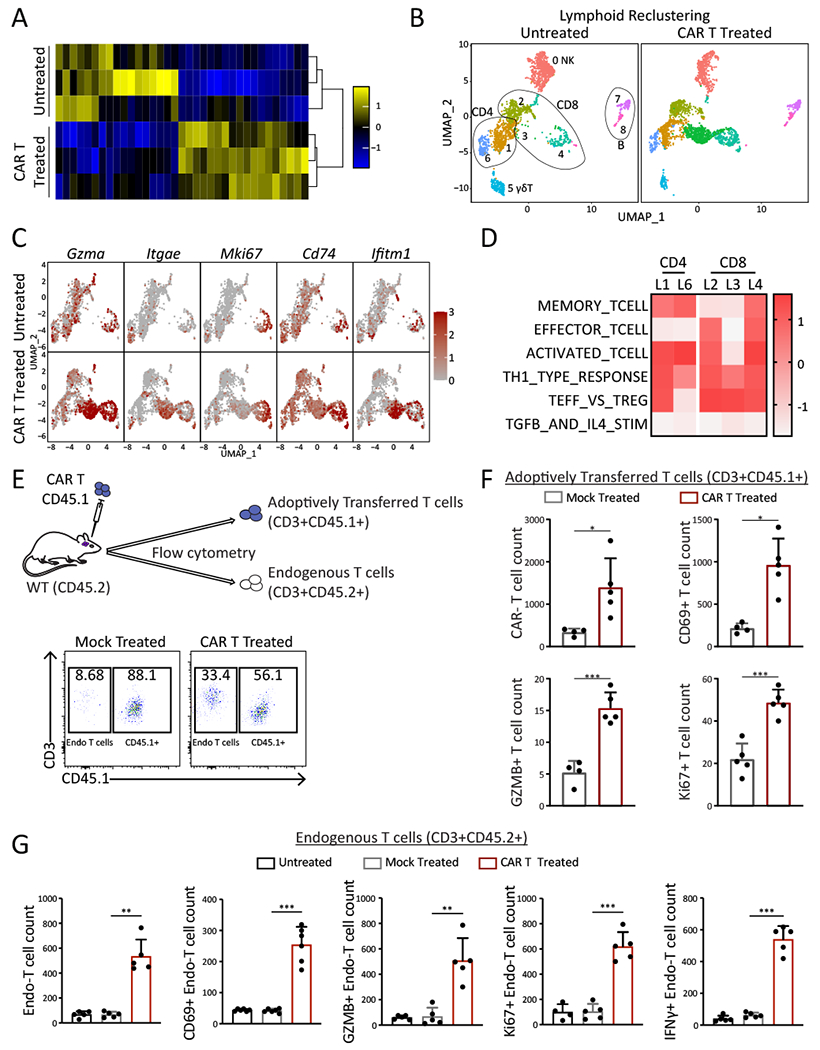
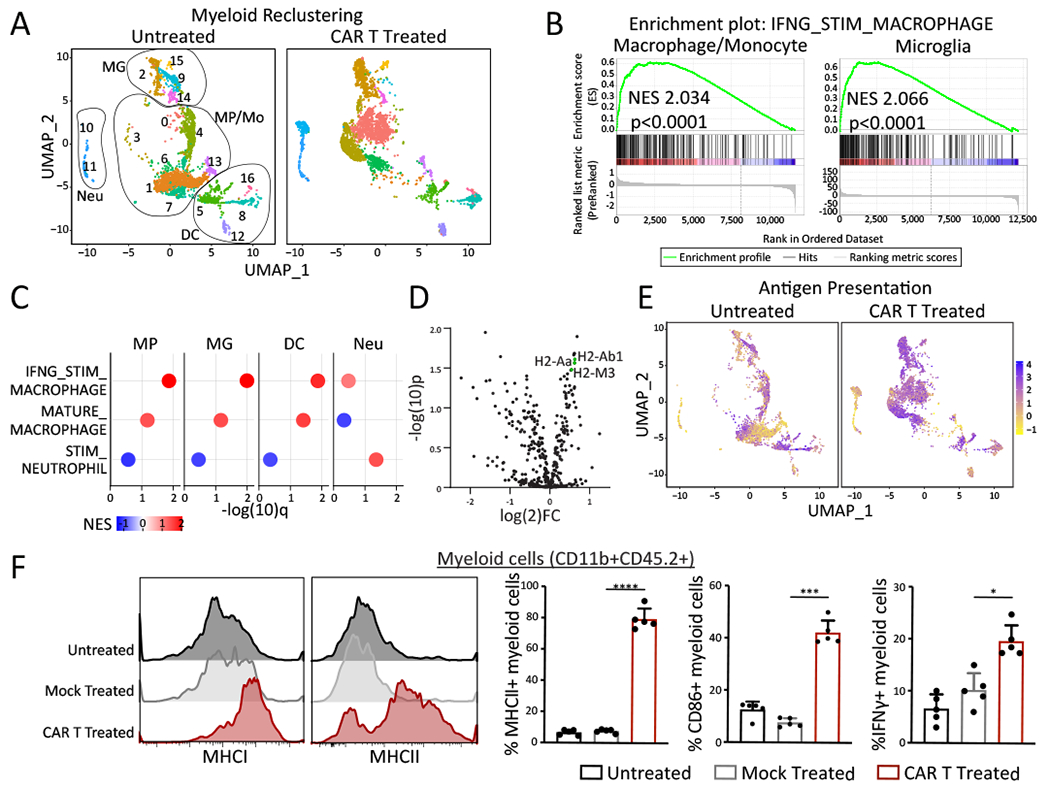
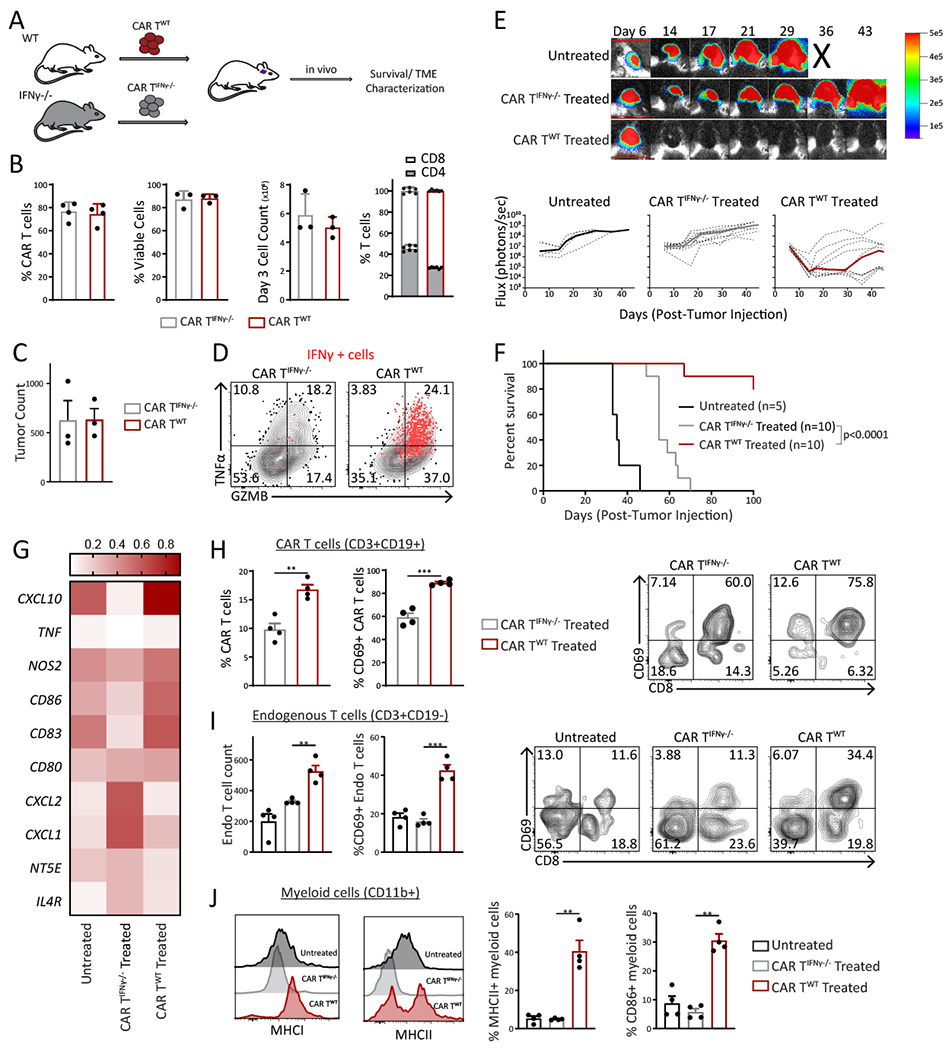
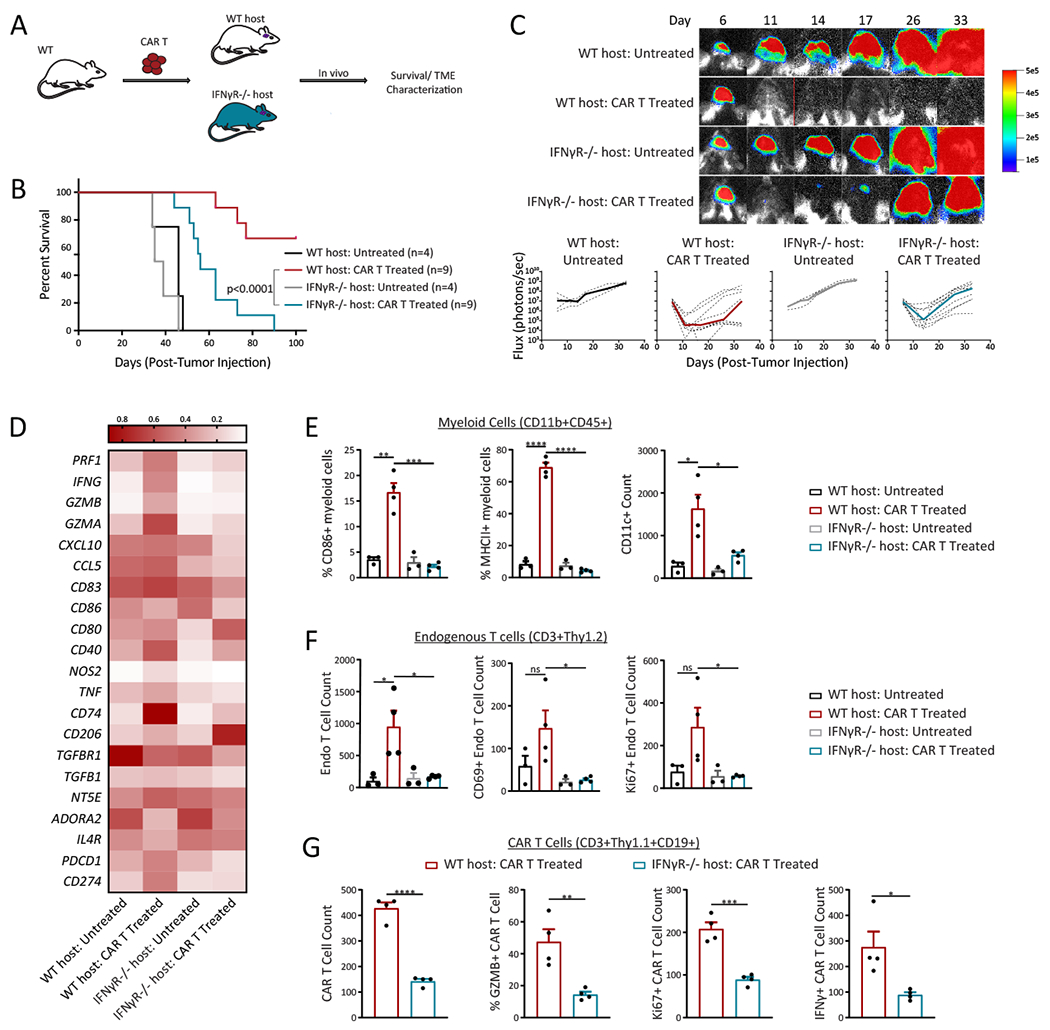
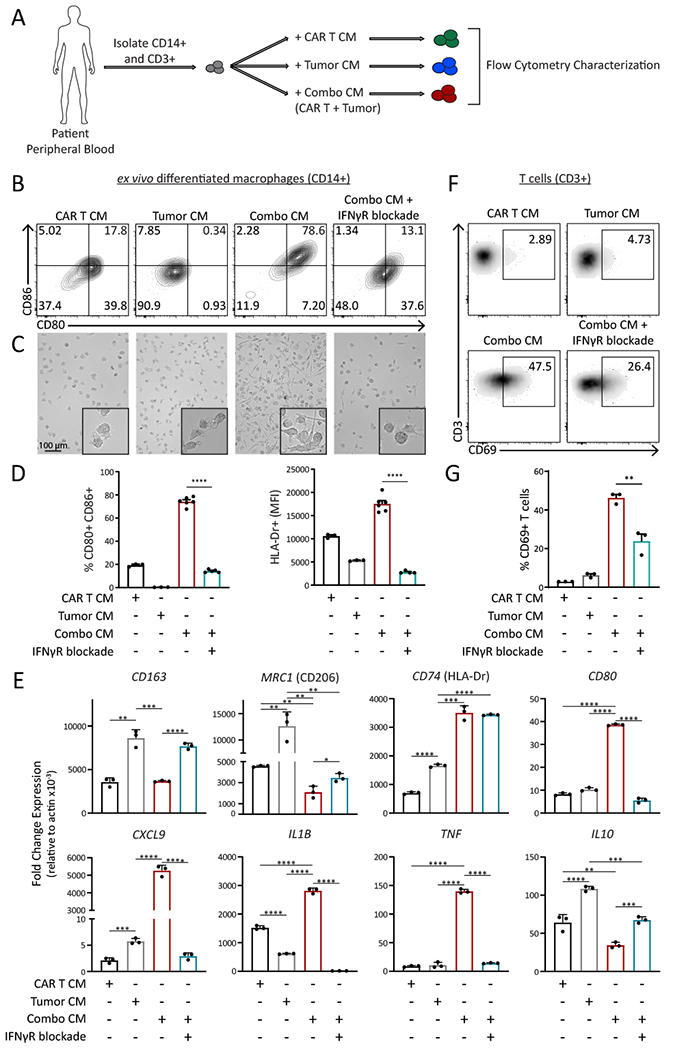
Chimeric antigen receptor (CAR) T cells mediate potent antigen-specific antitumor activity; however, their indirect effects on the endogenous immune system are not well characterized. Remarkably, we demonstrate that CAR T-cell treatment of mouse syngeneic glioblastoma (GBM) activates intratumoral myeloid cells and induces endogenous T-cell memory responses coupled with feed-forward propagation of CAR T-cell responses. IFNγ production by CAR T cells and IFNγ responsiveness of host immune cells are critical for tumor immune landscape remodeling to promote a more activated and less suppressive tumor microenvironment. The clinical relevance of these observations is supported by studies showing that human IL13Rα2-CAR T cells activate patient-derived endogenous T cells and monocytes/macrophages through IFNγ signaling and induce the generation of tumor-specific T-cell responses in a responding patient with GBM. These studies establish that CAR T-cell therapy has the potential to shape the tumor microenvironment, creating a context permissible for eliciting endogenous antitumor immunity. SIGNIFICANCE: Our findings highlight the critical role of IFNγ signaling for a productive CAR T-cell therapy in GBM. We establish that CAR T cells can activate resident myeloid populations and promote endogenous T-cell immunity, emphasizing the importance of host innate and adaptive immunity for CAR T-cell therapy of solid tumors.This article is highlighted in the In This Issue feature, p. 2113.


Conflict of interest statement

Conflict of Interest

Patents associated with IL13Rα2-CAR-T have been licensed by Mustang Bio., Inc., for which S.J.F. and C.E.B. receive royalty payments. All other authors declare no potential conflicts of interest.

Figures

Figure 1.
Figure 1.. CAR T therapy stimulates endogenous tumor-specific T cell responses.
A, Treatment schema of a unique responder to IL13Rα2-CAR T therapy. T cells (CD3+) were isolated from peripheral blood prior to the initiation of therapy (Pre-CAR T) and during therapeutic response (Post-CAR). B, Representative flow cytometry showing intracellular IFNγ levels in patient T cells obtained before therapy (Pre-CAR) and during response (Post-CAR). T cells were cocultured with irradiated autologous tumor (UPN109) followed by a 4 hour stimulation. C, T cell count after 14-day co-culture with autologous irradiated (Irr.) patient tumor cell line. D, In vitro killing by patient T cells against autologous (UPN109) or nonspecific tumor line (K562) at 1:1, E:T ratio. E, Representative flow cytometry demonstrates the IL13Rα2 expression of the patient autologous (UPN109) tumor line. Data are presented as means ± s.e.m. (C and D) and were analyzed by two-tailed, unpaired Student’s t-test. *p < 0.05, **p < 0.01, ***p < 0.001 and ****p < 0.0001 for indicated comparison.
Figure 2.
Figure 2.. mIL13BBζ CAR T cells induce an endogenous immunological memory response and generation of tumor reactive T cells.
A, Schematic of in vivo experimental design. B, Representative images of hematoxylin and eosin (H&E) staining show invasive K-Luc in untreated brains and tumor elimination in CAR T treated brains. C, Survival curve of mice bearing K-Luc-mIL13Rα2+ tumors in untreated and CAR T treated groups. D, Representative bioluminescent (BLI) images (top) and flux values (bottom) show tumor growth in untreated and CAR T-treated groups. Individual mice are represented with dotted lines, while median flux is represented by the thick line. E, Survival of mice cured by CAR T therapy and rechallenged with IL13Rα2 negative K-Luc tumors. F, Representative bioluminescent (BLI) images from day 8 post-rechallenge tumor injection (top) and flux values (bottom) show tumor growth in naïve controls and survivors of CAR T therapy groups. Individual mice are represented with dotted lines, while median flux is shown by the thick line. G, Overview of experimental design. H, In vitro killing and I, expansion of endogenous T cells isolated from untreated or CAR T-treated mice against K-Luc-mIL13Rα2+ tumor cells (E:T, 10:1). J, Assessment of in vivo killing capacity of isolated CAR T cells and endogenous T cells from untreated or CAR T-treated cells in tumor (K-Luc-mIL13Rα2+) bearing mice. Data are representative of at least two independent experiments. Data are presented as means ± s.e.m. (H, I and J) and were analyzed by two-tailed, unpaired Student’s t-test. Differences between survival curves (C and E) were analyzed by log-rank (Mantel–Cox) test. *p < 0.05, **p < 0.01, ***p < 0.001 and ****p < 0.0001 for indicated comparisons.
Figure 3.
Figure 3.. CAR T cells activate endogenous T cells in glioma tumor microenvironment.
A, Nanostring analysis shows global changes in gene expression of intratumoral T cells (CD3+) isolated from untreated or CAR T-treated mice 3 days post-therapy. B, UMAP plots depict changes in lymphoid compartments in the glioma TME after CAR T therapy. C, Feature plots demonstrate phenotypic characterization of T cell subclusters and enriched pathways within CD8 and CD4 T cell subclusters post therapy. D, Heatmap of enrichment scores (GSEA analysis) shows enriched pathways in T cell subclusters. E, Experimental design demonstrating the adoptive transfer of CD45.1+ mock or CAR T cells (top) and a representative flow cytometry analysis show frequency of endogenous (CD3+CD45.2+) or adoptively transferred T cells (CD3+CD45.1+) in glioma TME (bottom). F, Bar graphs compare adoptively transferred mock (CD3+CD45.1+) or CAR T cell (CD3+CD45.1+CD19+) number and phenotypic characterization (CD69, Ki67 and GZMB). G, Bar graphs compare endogenous T cell (CD3+CD45.2+) numbers and phenotypic characterization (CD69, Ki67 GZMB, and IFNγ) in untreated, mock or CAR T treated mice (n=5 per group). Data are representative of at least two independent experiments. Data are presented as means ± s.e.m. (F and G) and were analyzed by two-tailed, unpaired Student’s t-test. *p < 0.05, **p < 0.01, and ***p < 0.001 for indicated comparison.
Figure 4.
Figure 4.. CAR T cells activate the resident myeloid population in glioma tumor microenvironment.
A, UMAP plots of scRNAseq depict changes in intratumoral myeloid cells from CAR T-treated or untreated mice (3-days post therapy). B, Enrichment plot of IFNγ signaling pathways in intratumoral macrophage and microglia cells in CAR T-treated compared with untreated, as identified by the GSEA computational method. C. GSEA analysis reveals upregulation of population specific pathways in myeloid subclusters following CAR T treatment (MP: macrophage; MG: microglia; DC: dendritic cells; Neu: neutrophils). D, Nanostring analysis show global changes in gene expression of myeloid cells (CD11b+) isolated from CAR T-treated vs untreated mice. E, UMAP projections indicate relative expression levels of antigen presentation gene signatures at a single-cell level within the myeloid compartment. F, Representative flow cytometry histograms (left) and summary bar graphs (right) show intratumoral CD11b+CD45.2+ cells expressing MHCII, MHCI, CD86, and IFNγ. Data are presented as means ± s.e.m and analyzed by two-tailed, unpaired Student’s t-test. *p < 0.05, **p < 0.01, ***p < 0.001, ****p<0.0001 for indicated comparison.
Figure 5.
Figure 5.. Lack of IFNγ production by CAR T cells impairs antitumor activity and activation of host immune cells.
A, Schematic of the experimental design. B, Comparison of percent CAR positivity, viability, expansion, and CD4:CD8 ratio in CAR Twt and CAR TIFNγ−/− . C, In vitro killing of CAR Twt and CAR TIFNγ−/− against K-Luc-mIL13Rα2+ cells (E:T, 1:1). D, Representative flow cytometry plot depicts intracellular cytokine levels (TNFα, GZMB and IFNγ) in wt and IFNγ−/− CAR T cells after exposure to K-Luc-mIL13Rα2+ tumors. E, Representative bioluminescent (BLI) images (top) and flux values (bottom) show tumor growth in untreated, CAR Twt or CAR TIFNγ-/−. Individual mice are represented with dotted lines and median flux is shown in thick line. F, Survival curve of mice bearing K-Luc-mIL13Rα2+ tumors in untreated, CAR Twt treated and CAR TIFNγ−/− treated groups. G, Heatmap indicates normalized expression of genes associated with immune activation and suppression in the TME. H, Bar graphs (left) and representative flow cytometry plots (right) comparing CAR T cell (CD3+CD19+) number and activation phenotype (CD69). I. Bar graphs (left) and representative flow cytometry plots (right) comparing endogenous T cell (CD3+CD19−) number and activation phenotype (CD69). J, Representative histograms (left) and bar graphs (right) showing phenotype in myeloid (CD11b+) compartment. Data are representative of at least two independent experiments. Each symbol represents one individual (H, I, and J). Data are presented as means ± s.e.m and were analyzed by two-tailed, unpaired Student’s t-test. Differences between survival curves (F) were analyzed by log-rank (Mantel–Cox) test. *p < 0.05, **p < 0.01, and ***p < 0.001 for indicated comparison.
Figure 6.
Figure 6.. CAR T therapy is impaired in IFNγR−/− tumor-bearing host.
A, Schematic of the experimental design. B, Survival curve of mice bearing K-Luc-mIL13Rα2+ tumors in untreated or CAR T treated in wt host or IFNγR−/− host. C, Representative bioluminescent (BLI) images (top) and flux values (bottom) show tumor growth. Individual mice are represented with dotted lines, while median flux is represented by the thick line. D, Heatmap indicate normalized expression of genes associated with immune activation or suppression in the TME. E, Bar graphs of myeloid cells (CD11b+ CD45+) show phenotypic changes (CD86, MHCII, and CD11c). F, Bar graphs of endogenous T cells (CD3+Thy1.2) show changes in T cell count, CD69 and Ki67. G, Bar graphs of CAR T cells (CD3+Thy1.1+CD19+) demonstrate changes in number, GZMB, Ki67, and IFNγ. Data are representative of at least two independent experiments. Each symbol represents one individual mouse. Data are presented as means ± s.e.m. (E-G) and were analyzed by two-tailed, unpaired Student’s t-test. Differences between survival curves (B) were analyzed by log-rank (Mantel–Cox) test. *p < 0.05, **p < 0.01, ***p < 0.001and ****p < 0.0001 for indicated comparison.
Figure 7.
Figure 7.. CAR T cells can activate GBM patient immune cells through the IFNγ pathway.
A, Schema of experimental design. B, Representative flow cytometry, C, microscopy images and D, bar graph summary of phenotypic changes of patient macrophages after incubation in conditioned media (CM) collected from unactivated T cells (CAR T CM), tumor only (Tumor CM) versus tumor-activated CAR T cells (Combo CM) or tumor-activated CAR T cells with IFNγR blockade. E, qPCR analysis shows genes associated with macrophage activation after incubation in condition media as described in B-D. F, Representative flow cytometry and G, bar graph summary of phenotypic changes in patient T cells after incubation in conditioned media as described in B-D. Each symbol represents one replicate. Data are presented as means ± s.e.m. (D, E, and G) and were analyzed by two-tailed, unpaired Student’s t-test. *p < 0.05, **p < 0.01, ***p < 0.001 and ****p < 0.0001 for indicated comparison.

References

    1. McGranahan T, Therkelsen KE, Ahmad S, Nagpal S. Current State of Immunotherapy for Treatment of Glioblastoma. Current treatment options in oncology 2019;20:24. - PMC - PubMed
    1. Alexander BM, Cloughesy TF. Adult Glioblastoma. Journal of clinical oncology : official journal of the American Society of Clinical Oncology 2017;35:2402–9 - PubMed
    1. Medikonda R, Dunn G, Rahman M, Fecci P, Lim M. A review of glioblastoma immunotherapy. Journal of neuro-oncology 2021;151:41–53 - PubMed
    1. Akhavan D, Alizadeh D, Wang D, Weist MR, Shepphird JK, Brown CE. CAR T cells for brain tumors: Lessons learned and road ahead. Immunological reviews 2019;290:60–84 - PMC - PubMed
    1. Hegde M, Corder A, Chow KK, Mukherjee M, Ashoori A, Kew Y, et al. Combinational targeting offsets antigen escape and enhances effector functions of adoptively transferred T cells in glioblastoma. Molecular therapy : the journal of the American Society of Gene Therapy 2013;21:2087–101 - PMC - PubMed

Publication types

Substances