

Longitudinal Imaging of T Cells and Inflammatory Demyelination in a Preclinical Model of Multiple Sclerosis Using 18F-FAraG PET and MRI
- PMID: 33837066
- PMCID: PMC8717198
- DOI: 10.2967/jnumed.120.259325
Longitudinal Imaging of T Cells and Inflammatory Demyelination in a Preclinical Model of Multiple Sclerosis Using 18F-FAraG PET and MRI
Abstract
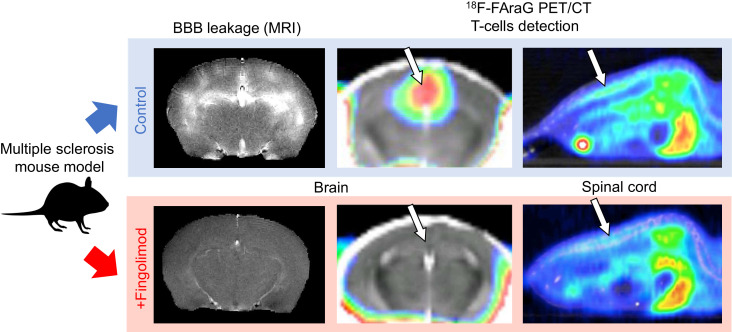
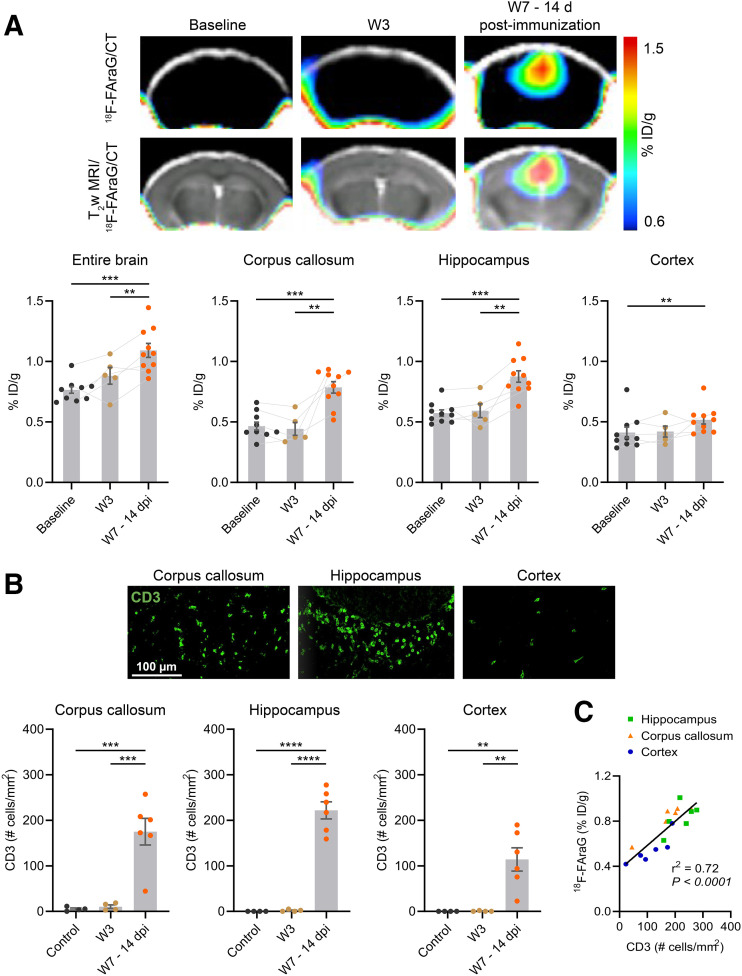
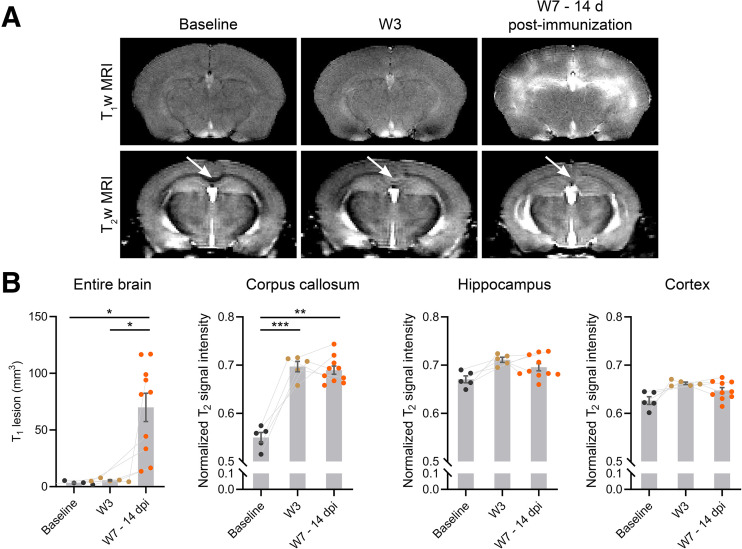
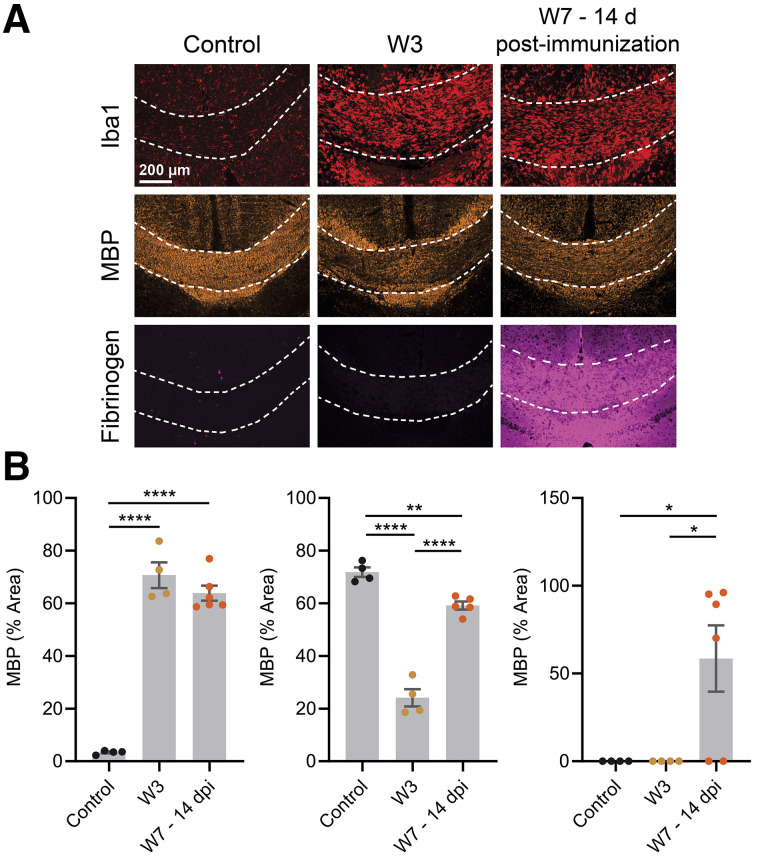
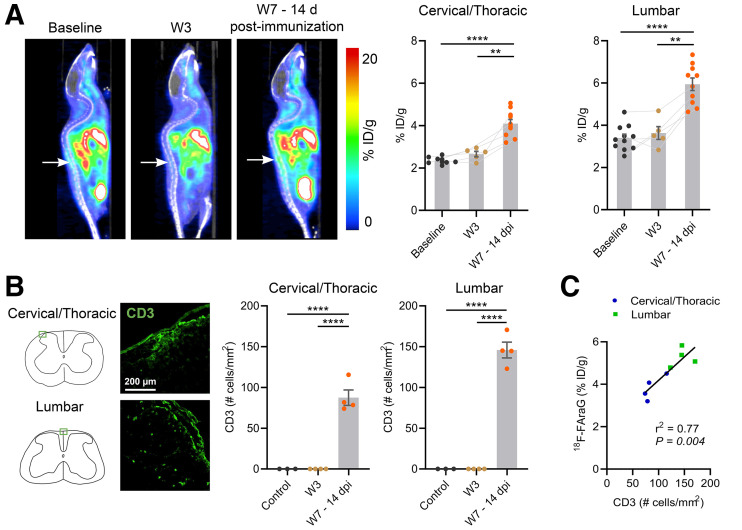
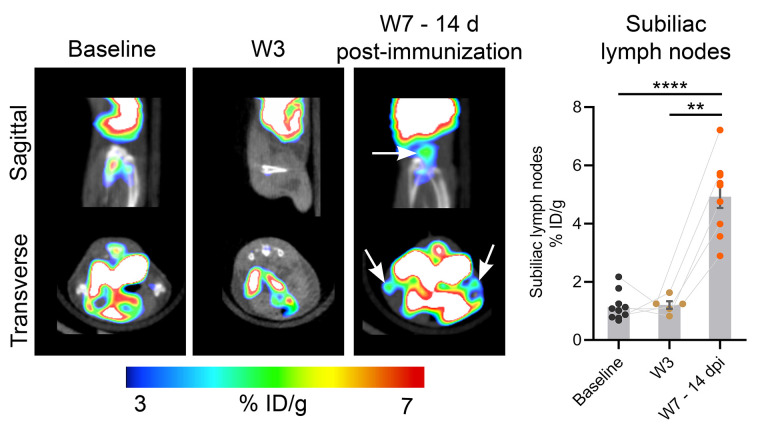
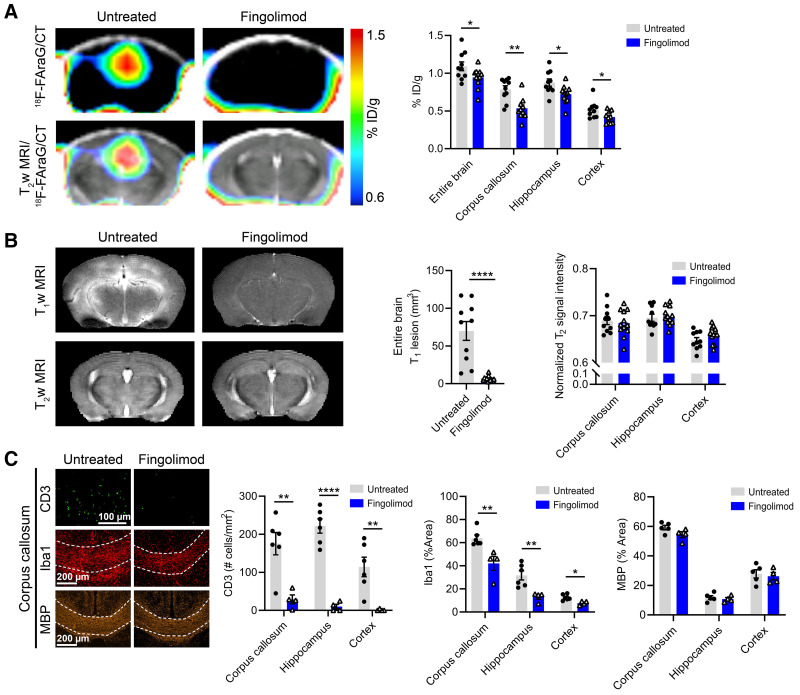
Lymphocytes and innate immune cells are key drivers of multiple sclerosis (MS) and are the main target of MS disease-modifying therapies (DMT). Ex vivo analyses of MS lesions have revealed cellular heterogeneity and variable T cell levels, which may have important implications for patient stratification and choice of DMT. Although MRI has proven valuable to monitor DMT efficacy, its lack of specificity for cellular subtypes highlights the need for complementary methods to improve lesion characterization. Here, we evaluated the potential of 2'-deoxy-2'-18F-fluoro-9-β-d-arabinofuranosylguanine (18F-FAraG) PET imaging to noninvasively assess infiltrating T cells and to provide, in combination with MRI, a novel tool to determine lesion types. Methods: We used a novel MS mouse model that combines cuprizone and experimental autoimmune encephalomyelitis to reproducibly induce 2 brain inflammatory lesion types, differentiated by their T cell content. 18F-FAraG PET imaging, T2-weighted MRI, and T1-weighted contrast-enhanced MRI were performed before disease induction, during demyelination with high levels of innate immune cells, and after T cell infiltration. Fingolimod immunotherapy was used to evaluate the ability of PET and MRI to detect therapy response. Ex vivo immunofluorescence analyses for T cells, microglia/macrophages, myelin, and blood-brain barrier (BBB) integrity were performed to validate the in vivo findings. Results:18F-FAraG signal was significantly increased in the brain and spinal cord at the time point of T cell infiltration. 18F-FAraG signal from white matter (corpus callosum) and gray matter (cortex, hippocampus) further correlated with T cell density. T2-weighted MRI detected white matter lesions independently of T cells. T1-weighted contrast-enhanced MRI indicated BBB disruption at the time point of T cell infiltration. Fingolimod treatment prevented motor deficits and decreased T cell and microglia/macrophage levels. In agreement, 18F-FAraG signal was decreased in the brain and spinal cord of fingolimod-treated mice; T1-weighted contrast-enhanced MRI revealed intact BBB, whereas T2-weighted MRI findings remained unchanged. Conclusion: The combination of MRI and 18F-FAraG PET enables detection of inflammatory demyelination and T cell infiltration in an MS mouse model, providing a new way to evaluate lesion heterogeneity during disease progression and after DMT. On clinical translation, these methods hold great potential for stratifying patients, monitoring MS progression, and determining therapy responses.
Keywords: 18F-FAraG PET imaging; MRI; T cells; central nervous system; multiple sclerosis.
© 2022 by the Society of Nuclear Medicine and Molecular Imaging.
Figures
References
-
- Lucchinetti C, Bruck W, Parisi J, Scheithauer B, Rodriguez M, Lassmann H. Heterogeneity of multiple sclerosis lesions: implications for the pathogenesis of demyelination. Ann Neurol. 2000;47:707–717. - PubMed
-
- Kutzelnigg A, Lucchinetti CF, Stadelmann C, et al.Cortical demyelination and diffuse white matter injury in multiple sclerosis. Brain. 2005;128:2705–2712. - PubMed
Publication types
MeSH terms
Grants and funding
LinkOut - more resources
Full Text Sources
Other Literature Sources
Medical