. 2021 Oct;31(10):1742-1752.
doi: 10.1101/gr.271908.120. Epub 2021 Apr 9.

Automated quality control and cell identification of droplet-based single-cell data using dropkick

Affiliations

Automated quality control and cell identification of droplet-based single-cell data using dropkick

Cody N Heiser et al. Genome Res. 2021 Oct.

Abstract

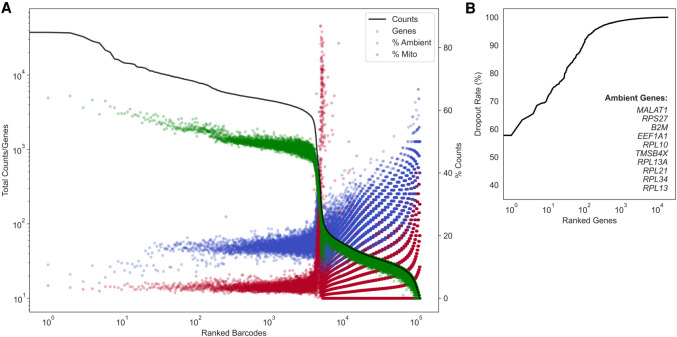
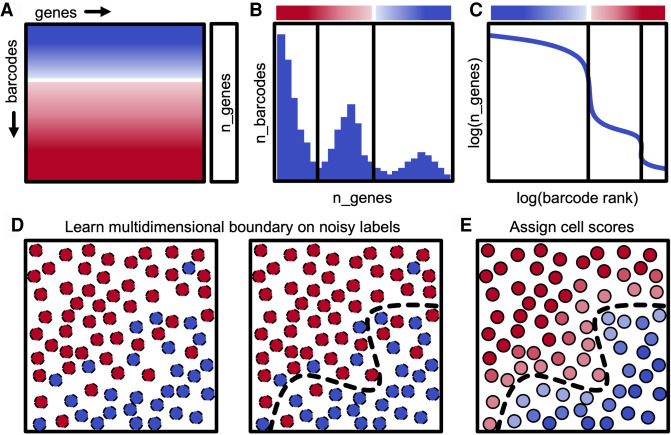
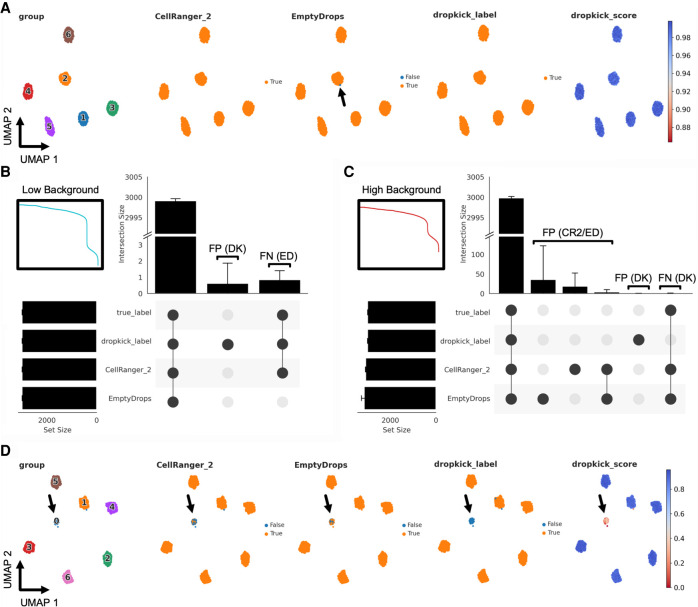
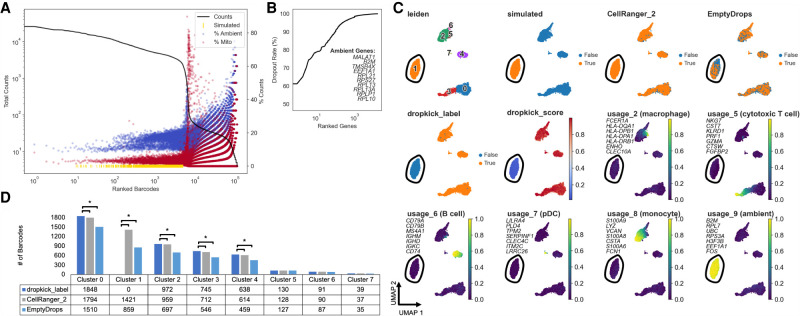
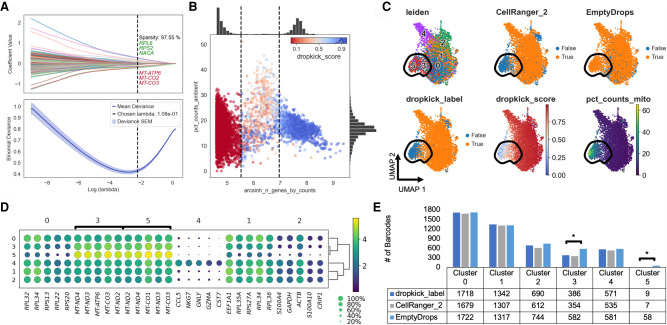
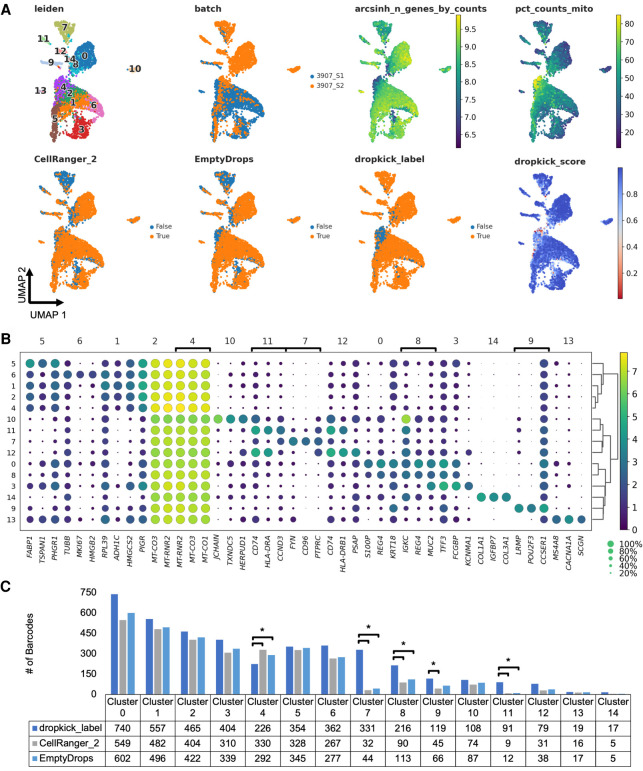
A major challenge for droplet-based single-cell sequencing technologies is distinguishing true cells from uninformative barcodes in data sets with disparate library sizes confounded by high technical noise (i.e., batch-specific ambient RNA). We present dropkick, a fully automated software tool for quality control and filtering of single-cell RNA sequencing (scRNA-seq) data with a focus on excluding ambient barcodes and recovering real cells bordering the quality threshold. By automatically determining data set-specific training labels based on predictive global heuristics, dropkick learns a gene-based representation of real cells and ambient noise, calculating a cell probability score for each barcode. Using simulated and real-world scRNA-seq data, we benchmarked dropkick against conventional thresholding approaches and EmptyDrops, a popular computational method, showing greater recovery of rare cell types and exclusion of empty droplets and noisy, uninformative barcodes. We show for both low- and high-background data sets that dropkick's weakly supervised model reliably learns which genes are enriched in ambient barcodes and draws a multidimensional boundary that is more robust to data set-specific variation than existing filtering approaches. dropkick provides a fast, automated tool for reproducible cell identification from scRNA-seq data that is critical to downstream analysis and compatible with popular single-cell Python packages.


Figures

Figure 1.
Figure 1.
Evaluating data set quality with the dropkick QC module. (A) Profile of total counts (black trace) and genes (green points) detected per ranked barcode in the 4000 pan–T cell data set (10x Genomics). Percentage of mitochondrial (red) and ambient (blue) reads for each barcode included to denote quality along data set profile. (B) Profile of dropout rate per ranked gene. Ambient genes are identified by dropkick and used to calculate ambient percentage in A.
Figure 2.
Figure 2.
Description of dropkick filtering method. (A) Diagram of scRNA-seq counts matrix with initial cell confidence for each barcode based solely on total genes detected (n_genes), depicted by color (red, empty droplet; blue, real cell). (B) Histogram showing the distribution of barcodes by their n_genes value. Black lines indicate automated thresholds for training the dropkick model. (C) log(n_genes) versus log(rank) representation of barcode distribution as in dropkick QC report (Fig. 1A). Thresholds from B are superimposed. (D) Thresholds in heuristic space (B,C) are used to define initial training labels for logistic regression. (E) dropkick chooses an optimal regularization strength through cross-validation and then assigns cell probabilities and labels to all barcodes using the trained model in gene space.
Figure 3.
Figure 3.
Evaluating dropkick filtering performance with synthetic data. (A) UMAP embedding of all barcodes kept by dropkick_label, CellRanger_2, and EmptyDrops for an example low-background simulation. Points colored by each of the three filtering labels, as well as ground-truth clusters determined by the simulation and dropkick score (cell probability). Arrow highlights a single false-negative (FN) barcode in the EmptyDrops label set for this replicate. (B) UpSet plot showing mean size of shared barcode sets across dropkick_label, CellRanger_2, EmptyDrops, and true labels for 10 simulations. Error bars, SD. Unique sets show false-positive (FP) barcodes labeled by dropkick and FN barcodes excluded by EmptyDrops. Inset shows log-rank representation of the low-background simulation in A. (C) Same as in B, for 10 high-background simulations. Inset shows log-rank representation of the high-background simulation in D. (D) Same as in A, for an example high-background simulation. Arrow highlights cluster 0, designated as “empty droplets” by simulation (see Methods: Synthetic scRNA-seq data simulation).
Figure 4.
Figure 4.
Benchmarking dropkick performance on simulated high-background data. (A) Log-rank total counts curve for the high-background PBMC simulation. The horizontal dashed line indicates the threshold below which ground-truth empty droplets were used to build simulated barcodes from a multinomial distribution (100 total counts). Gold rug plot indicates the location along the total counts curve of 2000 simulated high-UMI droplets (see Methods: High-Background PBMC Simulation). (B) Genes in PBMC simulation ranked by dropout rate. Top 10 ambient genes are listed, defining ambient profile used to calculate percentage in A. (C) UMAP embedding of all barcodes kept by dropkick_label, CellRanger_2, and EmptyDrops. Points colored by each of the three filtering labels, Leiden clusters determined by NMF analysis, dropkick score (cell probability), and select cell type metagene usages from NMF. Top seven gene loadings for each NMF factor are printed on their respective plots, in axis order from top to bottom. Circled area shows independent cluster of simulated empty droplets. (D) Table and bar graph enumerating the total number of barcodes detected by each algorithm in all NMF clusters. Significant cluster enrichment as determined by sc-UniFrac is denoted by brackets.
Figure 5.
Figure 5.
dropkick recovers expected cell populations and eliminates low-quality barcodes in experimental data. (A) Plot of coefficient values for 2000 highly variable genes (top) and mean binomial deviance ± SEM (bottom) for fivefold cross-validation along the lambda regularization path defined by dropkick. The top and bottom three coefficients are shown, in axis order, along with total model sparsity representing the percentage of coefficients with values of zero (top). Chosen lambda value indicated by dashed vertical line. (B) Joint plot showing scatter of percentage of ambient counts versus arcsinh-transformed genes detected per barcode, with histogram distributions plotted on margins. Initial dropkick thresholds defining the training set are shown as dashed vertical lines. Each point (barcode) is colored by its final dropkick score after model fitting. (C) UMAP embedding of all barcodes kept by dropkick_label, CellRanger_2, and EmptyDrops. Points colored by each of the three filtering labels, as well as Leiden clusters determined by NMF analysis, dropkick score (cell probability), and percentage counts mitochondrial. Circled area shows high mitochondrial enrichment in a population discarded by dropkick. (D) Dot plot showing top differentially expressed genes for each NMF cluster. The size of each dot indicates the percentage of cells in the population with nonzero expression for the given gene, and the color indicates the average normalized expression value in that population. Bracketed genes indicate significantly enriched populations in EmptyDrops compared with dropkick_label as shown in E. (E) Table and bar graph enumerating the total number of barcodes detected by each algorithm in all NMF clusters. Significant cluster enrichment as determined by sc-UniFrac is denoted by brackets.
Figure 6.
Figure 6.
dropkick outperforms analogous methods on challenging data sets. (A) UMAP embedding of all barcodes kept by dropkick_label (dropkick score ≥ 0.5), CellRanger_2, and EmptyDrops for human colorectal carcinoma inDrop samples. Points colored by each of the three filtering labels, as well as clusters determined by NMF analysis, dropkick score (cell probability), arcsinh-transformed total genes detected, percentage counts mitochondrial, and original batch. 3907_S1 is normal human colonic mucosa, and 3907_S2 is colorectal carcinoma from the same patient. (B) Dot plot showing top differentially expressed genes for each NMF cluster. The size of each dot indicates the percentage of cells in the population with nonzero expression for the given gene, and the color indicates the average expression value in that population. Bracketed genes indicate significantly enriched or depleted populations in dropkick compared with CellRanger_2 and/or EmptyDrops labels as shown in C. (C) Table and bar graph enumerating the total number of barcodes detected by each algorithm in all NMF clusters for the combined data set. Significant cluster enrichment as determined by sc-UniFrac is denoted by brackets.

Similar articles

Cited by

References

    1. Banerjee A, Herring CA, Chen B, Kim H, Simmons AJ, Southard-Smith AN, Allaman MM, White JR, Macedonia MC, McKinley ET, et al. 2020. Succinate produced by intestinal microbes promotes specification of tuft cells to suppress ileal inflammation. Gastroenterology 159: 2101–2115.e5. 10.1053/j.gastro.2020.08.029 - DOI - PMC - PubMed
    1. Chen B, Ramirez-Solano MA, Heiser CN, Liu Q, Lau KS. 2021. Processing single-cell RNA-seq data for dimension reduction-based analyses using open-source tools. STAR Protoc 2: 100450. 10.1016/j.xpro.2021.100450 - DOI - PMC - PubMed
    1. Fleming SJ, Marioni JC, Babadi M. 2019. CellBender remove-background: a deep generative model for unsupervised removal of background noise from scRNA-seq datasets. bioRxiv 10.1101/791699 - DOI
    1. Friedman J, Hastie T, Tibshirani R. 2010. Regularization paths for generalized linear models via coordinate descent. J Stat Soft 33: 1–22. 10.18637/jss.v033.i01 - DOI - PMC - PubMed
    1. Hoerl AE, Kennard RW. 1970. Ridge regression: biased estimation for nonorthogonal problems. Technometrics 12: 55–67. 10.1080/00401706.1970.10488634 - DOI

Publication types